
Abstract
Purpose
Generic preference-based measures often lack validity in states of impaired mobility. Our aim was to derive a novel health state classification system from the MobQoL tool, for the purpose of preference-based measurement of states of impaired mobility.
Materials and methods
Data were collected through online and postal surveys. Respondents were recruited through the NHS, charitable organisations and HealthWise Wales. Statistical and psychometric analyses were used to assess the validity and reliability of the MobQoL tool. Exploratory factor analysis and Rasch analysis were used to determine dimensional structure and to select items for the MobQoL health state classification system.
Results
Three hundred and forty-two respondents completed the survey. Respondents had a wide range of different mobility impairments. Nine of the MobQoL items demonstrated adequate validity and reliability. Exploratory factor analysis and Rasch analysis confirmed two sub-scales within the item structure: 1) physical and role functioning, and 2) mental wellbeing. Seven items were found to have adequate model fit and were retained in the final health state classification system, called the MobQoL-7D.
Conclusions
The MobQoL-7D contains seven dimensions of mobility-related quality of life: accessibility, contribution, pain/discomfort, independence, self-esteem, mood/emotions and anxiety. Population level preference weights are now needed for different states of mobility impairment.
Mobility impairment has distinct impacts on mental wellbeing and physical/role functioning.
The MobQoL-7D will facilitate accurate preference-based outcome measurement in populations with impaired mobility, which in turn will promote methods of economic evaluation in this context.
MobQoL-7D offers a concise and valid tool for rehabilitation professionals to measure and monitor mobility-related quality of life as part of routine clinical practice.
IMPLICATIONS FOR REHABILITATION
Introduction
Prevalence of mobility impairment
In the UK, over 14.1 million people live with an impairment, disability or limiting chronic illness; approximately 44% of older people, 18% of working age adults and 8% of children are classified as having a disability [Citation1]. Mobility impairment is the leading cause of disability in the UK; 48% of people with a disability have some form of impairment or limitation to their mobility [Citation1]. National Health Service (NHS) posture and mobility services support more than 1.2 million people each year with long-term mobility needs, almost half of which are working age adults [Citation2].
The NHS provides many different interventions, therapies and assistive technologies to maintain, facilitate and improve independent mobility. Amongst the most commonly supplied interventions are mobility aids, such as powered and manual wheelchairs. In the latest reported quarterly data, over 700,000 patients were registered with an NHS wheelchair service in England alone [Citation3]. It is estimated that the NHS spends almost £200million each year on the provision of wheelchairs [Citation2].
At present there is limited robust economic evidence to inform the design of posture and mobility services, or to guide the provision of mobility aids and other mobility-enhancing interventions in an evidence-based manner [Citation4]. This is true across the world, particularly in developing countries where the economic evidence base for assistive technology is particularly limited [Citation5]. Globally, 20 million people with mobility impairments do not have access to adequate mobility aids [Citation6], which has a major impact on their fundamental freedoms and equality of opportunity [Citation7].
Applying methods of economic evaluation
Resources for healthcare in public health systems like the NHS are fundamentally limited. In order to promote efficiency and cost-effectiveness, evidence is needed to guide decisions about funding and resource allocation. For the economic evaluation of novel and existing health technologies, the National Institute for Health and Care Excellence (NICE) in the UK recommends the quality-adjusted life year (QALY) approach to outcome measurement [Citation8]. NICE provide independent guidance to the NHS based on evidence of cost-effectiveness, typically using cost per QALY estimates to inform decisions.
QALYs are calculated using generic (i.e., not condition or disease specific) preference-based measures of health-related quality of life. Preference-based measures are systems of health state classification, where each combination of answers represents a different health state. Each potential health state is assigned a utility weight derived from societal preference for that state. These preference weights typically range from death (0) to perfect health (1) and are traditionally estimated from the views of a sample of the general public. QALYs are calculated by multiplying the amount of time spent in a given health state by the relative desirability of that state.
The QALY framework has become increasingly influential in health policy as a theoretically universal and generic approach to measuring benefits via a single common outcome. However, due to the generic nature of commonly used preference-based measures, they may lack sensitivity in certain patient groups [Citation9,Citation10]. For instance, in health states where quality of life takes precedent over quantity of life (e.g., chronic illness and disability) QALYs can undervalue intervention effectiveness [Citation11].
Preference-based measures and mobility impairment
The use of generic preference-based measures, such as the EQ-5D and HUI systems, has been relatively limited in the context of mobility impairment, particularly congenital mobility impairment [Citation12]. In conditions such as cerebral palsy and spina bifida, increased clinical severity is associated with decreased utility. For instance, there appears to be a relationship between utility outcomes and gross motor function in cerebral palsy [Citation13,Citation14], and lesion level in spina bifida [Citation15,Citation16]. Conversely, preference-based measures often show limited correlation with other clinically relevant outcomes measures associated with mobility impairment [Citation13,Citation17–19], and can exhibit discrepancies in utility outcomes when compared with one another [Citation14,Citation19–21]. These discrepancies could impact determination of cost per QALYs and thus conclusions about the cost-effectiveness of mobility aids and other interventions related to mobility impairment. Due to the influence of the QALY approach in health policy and in prioritisation decisions, the validity and reliability of preference-based measures are paramount. At present there is little evidence to guide choice of preference-based measure when evaluating interventions for mobility impairments.
These issues are in part due to the complex relationship between mobility impairment, adaptation and health-related quality of life. The impacts of mobility impairment are widespread across many aspects of an individual’s life, and can be detrimental to psychological wellbeing and quality of life [Citation22,Citation23]. Yet people with long-term mobility impairments do not necessarily believe that mobility has a major impact on health-related quality of life when suitable adaptations are available [Citation24,Citation25]. The onset of mobility impairment appears to be influential, as individuals with congenital disabilities exhibit higher degrees of life satisfaction, self-identity and self-efficacy (related to their disability) than individuals who have had to adapt to acquired disability [Citation26].
Despite these nuances, the NICE approved the UK value set for EQ-5D-3L has a disutility of −0.66 for the lowest level of mobility; meaning that an individual who is unable to walk but is otherwise mobile using a mobility aid can achieve a maximum utility value of 0.34 (0 = death; 1 = perfect health), regardless of their outcomes on the other dimensions. This illustrates the discrepancy between the lived-experience and external perception of disease and disability severity. When assessing the desirability of a hypothetical health state, individuals tend to focus on the transition from their own health state to the hypothetical health state [Citation10,Citation27,Citation28]. Thus, processes of adaptation may not be accounted for [Citation10]. A proposed solution is to develop condition-specific preference-based measures which have improved sensitivity and relevance in specific patient-groups [Citation29].
To date over 50 condition-specific preference-based measures have been developed [Citation30], only a small number of which relate to conditions associated with mobility impairment, such as multiple sclerosis [Citation31] and amyotrophic lateral sclerosis [Citation32]. Several non-preference based outcome measures are available in the context of mobility impairment and mobility aid use [Citation33–40]. However, none of these focus specifically on the underlying impact of mobility on quality of life, and they cannot be used to directly measure utility outcomes.
In order to fill this gap in available measurement tools, we developed the MobQoL tool [Citation23]. The MobQoL tool is a novel outcome measure for mobility-related quality of life, and was developed from the outset as a condition-specific preference-based measure. Although the causes and severity of different mobility impairments are vast and varied, the MobQoL tool defines common attributes of mobility-related quality of life which are broadly relevant to all forms of mobility impairment.
The development of condition-specific preference-based measures takes a number of stages, including establishing dimensions, selecting items, validating the measure and developing preference-based health state values [Citation40]. The dimensions and item-list for the MobQoL tool were initially developed through qualitative interviews with people with a wide range of mobility impairments [Citation23]. The original descriptive system contains 15 items relating to 11 dimensions of mobility-related quality of life (see Supplementary File 1). Inclusion of all items in a subsequent MobQoL health state classification system would result in an unmanageable number of potential health states (415 = 1,073,741,824), thus making it impractical to develop a value set for the original MobQoL tool. This study was therefore undertaken to assess the measurement properties of each MobQoL item, and to subsequently derive a more concise health state classification system. This paper outlines the stages undertaken to validate the MobQoL tool, including determining the dimensional structure and reducing the number of items to produce a health state classification system amenable to preference-based health state valuation.
Aims and objectives
Our overarching aims were to assess the measurement properties of the MobQoL tool and to derive a concise health state classification system which could be widely disseminated and used within health economics research.
The key objectives of this study were:
To assess the basic measurement and psychometric properties of the MobQoL tool, including assessment of item validity and reliability
To determine the dimensional structure of the MobQoL tool
To develop a parsimonious MobQoL health state classification system covering the key dimensions of mobility-related quality of life
Materials and methods
A cross-sectional psychometric evaluation study was undertaken, with quantitative data collected through postal and online surveys. A range of measurement properties were analysed to determine the validity and reliability of the MobQoL tool. Validity indicates whether an outcome measure is consistently measuring a defined underlying construct or latent variable in a systematic manner; in the case of the MobQoL tool the underlying construct was theoretically proposed to be mobility-related quality of life. Reliability indicates measurement consistency and repeatability. Evaluation of basic measurement and psychometric properties informed the item selection process for the health state classification system. Furthermore, additional analyses were undertaken to determine the dimensional structure of MobQoL through exploratory factor analysis (EFA) and Rasch analysis.
Preference-based health state classification systems are typically multidimensional, but can also be unidimensional [Citation40]. Multidimensional systems should ideally exhibit limited correlation between dimensions to avoid implausible health states [Citation41,Citation42]. Each dimension is usually represented by one or two items in order to produce concise health state descriptions amenable to valuation [Citation42]. Unidimensional health state classification systems contain multiple items relating to a single dimension, and may benefit from adapted valuation techniques which do not rely on independence between dimensions [Citation40]. Part of the purpose of this study was to determine the dimensional structure of the MobQoL tool, and to determine whether the items related to a single dimension or multiple dimensions of mobility-related quality of life. The analyses were undertaken without a priori hypotheses of dimensionality.
Data collection and outcome measures
The primary sources of data were paper and electronic questionnaire surveys distributed to individuals with a wide array of mobility impairments. Questionnaire surveys contained:
A range of demographic questions
MobQoL tool
EQ-5D-5L (as a comparative generic preference-based measure)
ICECAP-A (as a comparative capability measure)
PIADS (as a comparative assistive technology impact measure)
The three additional outcome measures listed above were included in the survey to allow assessment of convergent validity and to define groups of respondents.
The EQ-5D-5L is advocated by NICE [Citation8] and widely used nationally and internationally to calculate QALYs. Respondents are asked to rate their health by scoring each dimension using one of five response options, ranging from no problems to extreme problems. Health states are converted to a single summary index score by weighting the level of each dimension and deducting those weights from 1 (perfect health).
The ICECAP-A is a validated measure of capability and wellbeing, which is advocated by NICE when measuring and valuing effects of non-health interventions, such as social care [Citation43]. The ICECAP-A offers an alternative approach to the EQ-5D-5L for measuring generic health outcomes in certain types of economic evaluations. The ICECAP-A can be used to calculate an estimated cost per “year of full capability,” which is an alternative to the QALY framework as it focuses on a broader measurement of wellbeing beyond health and physical functioning [Citation44].
The PIADS is a validated outcome measure for assessing the effects of assistive technology on functional independence, wellbeing and quality of life [Citation36]. The questionnaire contains 26 separate items, covering concepts such as happiness, independence, efficiency and productivity. Each item is scored from −3 to +3, with individual item scores informing three sub-scales: “Competence,” “Adaptability,” and “Self-esteem.” The PIADS is considered to be generically applicable across all major forms of assistive technology.
As part of the demographic questions, respondents were also asked to indicate whether they felt their health was stable or unstable, using a simple measure of self-rated health (i.e., “Overall, do you consider your health to be stable at the moment?”).
Recruitment and sampling
Maximum variation sampling was utilised to create a diverse sample of individuals with a wide range of mobility impairments, both acquired and congenital. The predominant focus of sampling and recruitment was on mobility aid users with long-term mobility impairments, as they represent the primary target population for the MobQoL tool. As the MobQoL health state classification system must be able to differentiate between a wide variety of states of mobility impairment, respondents with short-term mobility impairments were also sought.
The Equality Act 2010 states that a long-term impairment is one which lasts for 12 months or more [Citation45]. Therefore, for the purpose of this research a long-term mobility impairment was defined as any condition, impairment, disability or illness causing impairment to mobility for 12 months or longer. Furthermore, a “significant” mobility impairment was defined as any short or long-term impairment to mobility which necessitates the use of a mobility aid and/or a mobility-enhancing intervention to enhance, maintain or facilitate mobility or to reduce complications related to mobility impairments. These definitions were specified to ensure that less significant mobility impairments, such as minor injuries, were not included under the definition of significant mobility impairment.
Inclusion and exclusion criteria
Due to maximum variation sampling the inclusion criteria were quite broad:
Aged 18 or over
Current or previous experience of a significant mobility impairment which necessitates the use of any form of mobility aid or mobility-enhancing intervention to enhance, maintain or facilitate independent mobility, and/or to reduce complications related to mobility impairments as part of rehabilitative treatment.
Specific disabilities, conditions, or functional status were not explicitly targeted, as mobility impairments are related to a vast array of conditions, disabilities and injuries. However, attempts were made in our recruitment strategy and sampling frame to establish a broad and varied sample containing individuals with congenital and acquired mobility impairments; progressive and static mobility impairments; and representing all NHS categorisations of mobility need (low, medium, high and specialist).
Recruitment strategy
Respondents were initially identified through NHS posture and mobility services, however due to the outbreak of COVID-19 during data collection, a number of NHS sites had to withdraw from the study. Additional online recruitment methods were therefore implemented. Three charitable organisations (Cerebral Palsy UK, Ehlers-Danlos Support UK and Multiple Sclerosis Trust) promoted the survey through their social media platforms and email mailing-lists. Furthermore, HealthWise Wales, a Welsh government register of individuals interested in taking part in health and wellbeing research, promoted the study to individuals on their mailing-list who met the inclusion criteria.
At the NHS sites, respondents were identified through patient record searches using the inclusion criteria and requested sample variation. Potential respondents were sent a postal study invitation pack containing a covering letter, an information sheet, the questionnaire survey, a consent form and a prepaid return envelope. For respondents taking part online, the partnered organisations distributed a summary of the study, eligibility criteria and a link to the online survey through their email mailing-lists and social media posts. The online survey included the information sheet, the consent form and demographic questions, which were used by the research team to validate the data and confirm eligibility. The online survey was hosted on JISC (https://www.onlinesurveys.ac.uk/).
Respondents recruited through the NHS who indicated that they had stable health were invited to complete a “retest” survey 2 weeks after the initial survey. This was undertaken to assess test-retest reliability, based on the assumption that a reliable outcome measure should not exhibit significant item response differences over a short time period if a respondent has stable health. In line with good practice all respondents who provided a valid UK address were sent a £5 high-street voucher as a thank you for providing a completed survey. Data were collected from March to June 2020.
Data handling and analysis
All relevant data protection guidance and regulations were followed. All collected data were anonymised to protect respondent privacy, with each respondent assigned a non-identifiable ID. The study received ethical approval from an NHS ethics committee (reference: 19/SC/0659) and an academic ethics committee at Bangor University.
A wide array of analyses were undertaken: statistical analysis and EFA were carried out using IBM SPSS® (v25) and Rasch analysis was carried out using Winsteps® (v4.5.4). Methods of data analysis are summarised below:
Convergent validity
Convergent validity of the MobQoL tool was assessed using Pearson’s Correlation Coefficient. Correlation was examined between the MobQoL tool and existing generic measures (EQ-5D-5L, ICECAP-A). Convergent validity provides an indication of whether a measurement tool accurately measures specified constructs, or at least measures them in accordance with another validated measure [Citation46]. For an item or dimension to be considered to have convergent validity, the strongest correlation should be with an equivalent item or dimension from an existing validated measure. In the interest of uniformity the strength of correlations was defined as such: absent (rs = 0.00 to 0.20), weak (rs = 0.20 to 0.35), moderate (rs = 0.35 to 0.50) and strong (rs > 0.50) [Citation47]. Our a priori hypotheses are presented in Supplementary File 2.
Basic measurement and psychometric properties
Items were initially assessed using statistical analysis of basic measurement and psychometric properties. Items which failed to meet certain thresholds were considered for removal. The following criteria were examined:
Missing data: The threshold for item exclusion was set at >4% missing data per item.
Floor/ceiling effects: The threshold for item exclusion was set at ≥25% of responses on first (floor) or last (ceiling) response choice. Any item with a 20–24.9% floor/ceiling effect was flagged but not instantly excluded.
Test-retest reliability: Assessed using Intraclass Correlation Coefficient (ICC). The threshold was set at ICC < 0.5, items scoring <0.5 were not excluded instantly, but were flagged.
Known-group validity: Assessed using the Mann–Whitney U test, which compares the difference between the mean ranks of two independent groups. Mann–Whitney U is considered to be more suitable than independent t tests when comparing data from ordinal variables (e.g., likert scales) [Citation48]. Three paired groups were defined using respondent outcomes from the PIADS outcome measure. For each of the PIADS sub-scales, respondents were grouped according to whether they had experienced positive (≥0) or negative impacts (<0) associated with assistive technology use and mobility impairment. The groups were then compared to determine whether their answers were significantly different on each MobQoL item. Respondents were also defined as either having “stable health” or “unstable health,” based on their self-rating of health stability at baseline. Any item which showed a non-significant (p > 0.05) difference between two or more of the known-groups was excluded. If non-significance was observed for only one group, the item was flagged.
Differential item functioning (DIF): As the purpose of a health state classification system is to act as a universal measurement tool, items should not function significantly differently due to demographic attributes unrelated to the measured construct [Citation42]. DIF was assessed based on gender using Rasch analysis (described in detail below). Problematic DIF for each item was defined as a significant (p < 0.05) difference of >1.0 log odds unit (logit) between male and female respondents. Any item exhibiting DIF by gender was excluded.
As noted, the criteria for exclusion were divided into thresholds, with severe issues warranting direct item removal. Items which exhibited less severe issues across multiple test were removed based on the following criteria:
Floor/ceiling effect between 20 and 24.9% and test-retest ICC <0.5
Floor/ceiling effect between 20 and 24.9% and non-significant (p > 0.05) difference between at least one known-group
Test-retest ICC <0.05 and non-significant (p > 0.05) difference between at least one known-group
Exploratory factor analysis
Following initial removal of items which did not meet basic measurement properties, EFA was undertaken. EFA is a technique to examine the inter-relationship between the items of a defined measurement scale [Citation46]. When conducting EFA, the correlation matrix of variables (i.e., items) is examined to identify groups of variables with strong correlations [Citation46]. Subsequently, the findings can be used to identify underlying factors which explain patterns of correlation between variables and to organise variables into independent factors or dimensions.
EFA was conducted to identify the underlying factors within the MobQoL tool, and to examine the potential correlations between items in each underlying factor. The adequacy of the data to undertake the EFA was confirmed using the Kaiser–Meyer–Olkin (KMO) measure of sampling adequacy and Bartlett’s test of sphericity. Using KMO, high values (close to 1.00) indicate a high probability of sampling adequacy, with 0.50 as an absolute minimum value to support conduct of EFA [Citation49]. Bartlett’s test of sphericity was used to confirm the presence of correlations amongst the items and to subsequently indicate whether EFA would be informative and plausible with this dataset. A significant test (p < 0.05) confirms the appropriateness of the data for EFA [Citation49].
In the EFA, independent factors were identified through eigenvalues ≥ 1 (Kaiser’s criterion) [Citation49] and through interpretation of the screeplot. Eigenvalues summarise the variance in the data which is reproduced by identified factors. The method of estimation for the EFA was “maximum likelihood,” as recommended by Fayers et al. [Citation46], with Promax rotation. Rotation is commonly used in EFA to increase interpretability of the factor structure without adjusting underlying mathematical properties. There are essentially two types of rotation: a) orthogonal (e.g., Varimax), which assumes orthogonality between factors, and b) oblique (e.g., Promax), which assumes that there is some correlation between factors. Orthogonality was assessed as part of the initial stages of the EFA using a factor correlation matrix, which indicated that oblique rotation would be optimal due to potential correlation between factors.
After completion of the EFA, the pattern matrix was examined to determine the size of the factor loadings for each item on each of the extracted factors. Any item with a factor loading <0.40 was considered to have less than adequate correlation with the factor, and was thus excluded from further analysis and removed from the potential list of items.
Rasch analysis
Upon completion of the EFA, the remaining items and factors were examined using Rasch analysis to determine construct validity through model fit and dimensionality.
Rasch analysis has become increasingly popular in the development of health state classification systems, particularly when attempting to reduce an existing condition-specific outcome measure into a smaller set of items amenable to health state classification. Rasch analysis is often used in conjunction with traditional psychometric testing and factor analysis to help reduce the number of items from an existing measure and to establish the dimensionality of a derived condition-specific preference-based measure [Citation30,Citation40].
Using this approach to mathematical modelling, data is converted to points on a continuous latent scale, expressed in logits [Citation50]. Common uses of this approach include examining item fit, item response ordering and DIF between different demographic groups. Rasch analysis was utilised in this study for four key purposes:
Fit of individual items and scales to the Rasch model: Item and scale fit to the Rasch model is expressed as infit and outfit mean-square (MnSQ) statistics in Winsteps®. MnSQ values are calculated by dividing the chi-square fit statistic by the degrees of freedom [Citation51]. The expected value of a MnSQ is equal to 1.0, which implies equity between unexplained variance in the raw data and the Rasch model. A MnSQ value of >1.0 indicates “underfit” to the model and can demonstrate too much unexplained variance in the data if too high (i.e., >1.3). A MnSQ value of <1 indicates “overfit” to the model and can demonstrate potential measurement inefficiency if too low (i.e., <0.7). Underfit is considered to be more problematic to measurement as it indicates erratic responses and noise in the data [Citation52]. For survey rating scales an MnSQ infit/outfit value of between 0.7 and 1.3 is considered indicative of good fit [Citation52]. Winsteps® also produces a standardised Z-score (Zstd) for fit statistics. These essentially show the probability that the data fits the model perfectly [Citation51]. An acceptable Zstd range is ±2, with values < −2 indicating potential overfit and values >2 indicating potential underfit. If MnSQ values are acceptable, the Zstd value is less important and can essentially be ignored [Citation51].
Item response ordering: Category probability curves and a “most probable response” map were used to examine the response threshold ordering of each item. Disordered response thresholds indicate that respondents have difficulty discriminating between two or more response categories [Citation53].
Reliability and measurement precision: Person Separation Reliability (PSR) and Person Separation Index (PSI) values were calculated as part of the Rasch analysis and used to determine the discriminative power of the measurement scale to differentiate between different respondents [Citation52]. Problematic PSR and PSI values demonstrate that additional items may be needed to differentiate between respondents. Adequate values were defined as PSR ≥ 0.80 and PSI ≥ 2.00 [Citation54].
Dimensionality: In order to determine the dimensionality of the identified factors and of the whole scale, the Rasch model was used to conduct principal component analysis (PCA) of the residuals. This approach is commonly used to identify any principal components (i.e., additional dimensions) after the Rasch dimension is removed. Thresholds for unidimensionality were defined as ≥60% of the variance explained by the raw data and an eigenvalue <3 for the first contrast [Citation55,Citation56].
Successive Rasch models were conducted using a range of different configurations of the MobQoL items, until a parsimonious solution with optimum fit to the model was achieved. The MobQoL health state classification system was then confirmed based on the optimum configuration of items and sub-scales. Analysis of Cronbach’s α coefficient was used to confirm the internal consistency of the sub-scales and the overall scale, with an α ≥ 0.7 indicating acceptable internal consistency [Citation46].
The health state classification system was presented to the project’s “patient and public involvement” (PPI) advisors at several stages, including at the final stage of item selection.
Results
Sample
In total, 342 respondents were recruited to the study. Demographic characteristics are summarized in . The mean age of respondents was 54 years (SD = 18.93), the sample contained more females (59%, n = 200) than males (37%, n = 126). A large proportion of the sample were retired (44%, n = 152), which is unsurprising given that almost a third of respondents were aged 65 or older. Respondents reported a vast array of conditions and disabilities which impaired their mobility, with Ehlers-Danlos Syndrome (15%, n = 50) and Multiple Sclerosis (14%, n = 49) representing the two most common conditions. Likewise, respondents reported use of a large variety of primary mobility aids, with walking sticks (30%, n = 102) and powered wheelchairs (16%, n = 53) representing the two most common aids. The mean length of time using any form of mobility aid was 8.6 years (SD = 9.18), and half of the sample reported using mobility aids “all of the time.” Most of the sample (59%, n = 202) reported having stable health. Just under 10% of the sample (n = 33) were invited to complete a retest survey, with 31 respondents providing retest data at the two week retest follow-up.
Table 1. Demographic characteristics.
Convergent validity
Correlations were generally as expected, but with some notable exceptions, see . All correlations were found to be significant (p < 0.01).
Table 2. Convergent validity: correlations between the MobQoL items and the dimensions of the EQ-5D-5L and ICECAP-A.
Correlation with EQ-5D-5L dimensions
The strongest correlation was between the MobQoL “Pain/discomfort” item and EQ-5D-5L “Pain/discomfort” dimension (rs = 0.76). The MobQoL “Self-esteem” (rs = 0.56), “Mood/emotions” (rs = 0.69) and “Anxiety” (rs = 0.68) items all showed strong convergence with the EQ-5D-5L “Anxiety/depression” dimension. The MobQoL “Frustration” item was moderately correlated with the EQ-5D-5L “Anxiety/depression” dimension (rs = 0.46), but showed slightly better correlation with the EQ-5D-5L “Usual activities” dimension (rs = 0.49), which was unexpected but plausible. The MobQoL “Relationships” and “Social inclusion” items were also moderately correlated with the EQ-5D-5L “Anxiety/depression” dimension (rs = 0.41 and 0.43 respectively), which may be indicative of the impact of relationships and social inclusion on mental health. Five MobQoL items were strongly correlated with the EQ-5D-5L “Usual activities” dimension: “Accessibility (home)” (rs = 0.52), “Accessibility (community)” (rs = 0.52), “Contribution” (rs = 0.61), “Activities” (rs = 0.59) and “Independence” (rs = 0.56). The EQ-5D-5L “Self-care” dimension was most correlated with the MobQoL “Contribution” item (rs = 0.49), and unexpectedly exhibited only moderate correlation with the MobQoL “Personal care” item (rs = 0.37). This is potentially due to the focus of the MobQoL “Personal care” item on satisfaction with personal care arrangements rather than ability to self-care. Although the EQ-5D-5L “Mobility” dimension was most correlated with the MobQoL “Accessibility (home)” item (rs = 0.42) as expected, it is worth noting that this dimension did not correlate strongly with any of the MobQoL items; additional moderate correlations were found with the “Accessibility (community)” (rs = 0.35), “Contribution” (rs = 0.38) and “Independence” (rs = 0.36) items. This is possibly due to the wording of the EQ-5D-5L “Mobility” item, as its focus on “walking” is unlikely to be reflective of how many of the respondents defined or experienced mobility (e.g., using mobility aids). The MobQoL “Energy” item was most strongly correlated with the EQ-5D-5L “Pain/discomfort” dimension (rs = 0.56).
Correlations with the ICECAP-A dimensions
The strongest correlation was between the MobQoL “Independence” item and the ICECAP-A “Being independent” dimension (rs = 0.64). As anticipated, the MobQoL “Mood/emotions” (rs = 0.53) and “Anxiety” (rs = 0.51) items were strongly correlated with the ICECAP-A “Feeling settled and secure” dimension. Additional strong correlations were also observed between this ICECAP-A dimension and the MobQoL “Contribution” and “Self-esteem” items (rs = 0.52 and 0.50 respectively). The ICECAP-A “Love, friendship and support” dimension was most correlated with the MobQoL “Social inclusion” item (rs = 0.41), but showed weak correlation with the MobQoL “Relationships” item (rs = 0.34), which was unexpected. The ICECAP-A “Achievement and progress” dimension exhibited its highest correlation with the MobQoL “Contribution” item (rs = 0.59) as expected, but also exhibited strong correlations with the MobQoL “Usual activities” (rs = 0.55), “Independence” (rs = 0.57), “Energy” (rs = 0.53), “Self-esteem” (rs = 0.51), “Mood/emotions” (rs = 0.51) and “Frustration” items (rs = 0.50). The MobQoL “Mood/emotions” item was the only item with a strong correlation with the ICECAP-A “Enjoyment and pleasure” dimension (rs = 0.50), although moderate correlations were observed with this ICECAP-A dimension and most other MobQoL items.
Basic measurement properties
See for a summary of all basic measurement and psychometric properties.
Table 3. Summary of all basic measurement and psychometric properties per MobQoL item.
None of the MobQoL items exhibited issues with missing data, the highest rate was 1.2% for the “Contribution” item, which still fell well below the specified threshold of >4%. Based on the proportion of responses on the first response choice, the “Social inclusion” item had a clear floor effect (37.06%) and the “Personal care” item exhibited a possible floor effect (21.93%). Based on the proportion of responses on the last response category, the “Activities” and “Energy” items had clear ceiling effects (29.82% and 32.65% respectively), and the “Contribution” (21.01%), Independence (21.47%) and Frustration (21.18%) items exhibited possible ceiling effects.
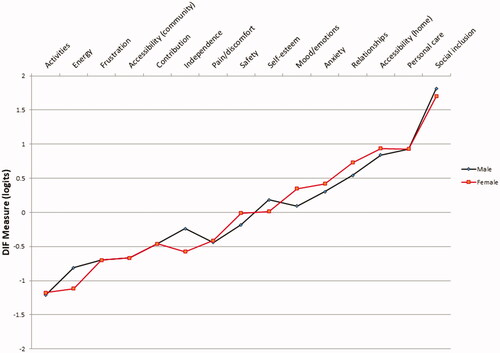
Nearly all of the items demonstrated good discriminative ability, with significant (p < 0.05) differences between known-groups across most of the items and groups. Mean ranks were as expected, with worse mean rank values for respondents with negative PIADS sub-scale scores and unstable health. Only the “Accessibility (community)” mean rank score was found to have a non-significant (p < 0.09) difference between groups on the PIADS “Self-esteem” sub-scale. None of the items exhibited DIF based on gender, with all logit differences <1 and non-significant (p > 0.05) ().
Figure 1. Differential item function by gender. Items are ordered by difficulty, from lowest difficulty (“Activities”) to highest difficulty (“Social inclusion”). The y axis shows the difficulty (in logits) of each item for each person classification (i.e., male or female).
Test-retest reliability outcomes were predominantly moderate (ICC = 0.5–0.75). Only the “Independence” item exhibited good test-retest reliability (ICC = 0.82). Poor test-retest reliability was identified for six items: “Accessibility (community),” “Relationships,” “Social inclusion,” “Personal care,” “Self-esteem,” and “Frustration,” with ICCs ranging from 0.33 to 0.48. The underwhelming test-retest outcomes may have been associated with the COVID-19 outbreak, as the start of lockdown in the UK occurred during the retest follow-up period, see discussion for additional comments.
Upon completing the analysis of basic psychometric properties, six items were excluded due to significant issues with basic measurement properties. The “Frustration” item was excluded for exhibiting poor test-retest reliability (ICC = 0.46) and a borderline ceiling effect (21.18%); the “Personal care” item was excluded for exhibiting poor test-retest reliability (ICC = 0.33) and a borderline floor effect (21.93%); the “Activities” and “Energy” items were excluded for exhibiting significant ceiling effects (29.82% and 32.65% respectively); the “Social inclusion” item was excluded for exhibiting a significant floor effect (37.06%); and the “Accessibility (community)” item was excluded for exhibiting poor test-retest reliability (ICC = 0.47) and a non-significant (p = 0.09) known-group difference on the PIADS “Self-esteem” sub-scale.
Exploratory factor analysis
EFA was carried out on the remaining nine items to determine the potential factorial structure of the MobQoL health state classification system. The KMO measure verified sampling adequacy (KMO = 0.88) and a significant Bartlett’s test of sphericity (p < 0.01) confirmed that EFA was suitable. Examination of the correlation matrix () revealed significant correlation (p < 0.01) between all variables, with correlations ranging from rs = 0.22 to 0.63. All items had a correlation of rs > 0.30 with at least one other item and no items had a correlation >0.90, demonstrating sufficient evidence of at least one underlying latent variable and no problematic multicolinearity [Citation57].
Table 4. Correlation matrix for the retained MobQoL items.
The “maximum likelihood” factor analysis with Promax rotation indicated that there were two potential factors worth retaining, which together explained 50.38% of the variance. These two factors had eigenvalues of 4.35 and 1.13 respectively, with all other eigenvalues falling below the ≥1 Kaiser’s criterion [Citation49] (). Examination of the scree plot also supported the retention of two factors, with the inflexion point on the second factor ().
Figure 2. Scree plot from exploratory factor analysis. Eigenvalues summarise the variance in the data which is reproduced by identified factors. The inflexion point is the point at which the line flattens, indicating minimal reproduced variance per factor.
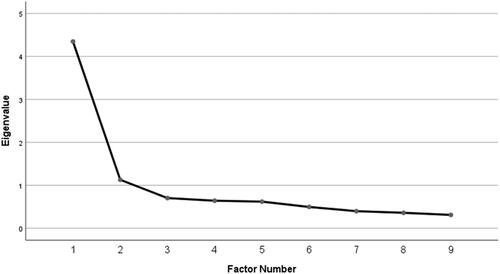
Table 5. Results from the exploratory factor analysis.
Items with factor loadings ≥0.4 were retained after rotation. Factor loadings are presented in the pattern matrix in . Based on the clustering of items, the first factor was summarised as containing mental wellbeing items related to mobility, and the second factor was summarised as containing physical and role functioning items related to mobility, thus these labels were subsequently used to define the factors. The pattern matrix showed than none of the items had factor loadings ≥0.4 on both factors, suggesting good factor structure. As the “Relationships” item had a factor loading of 0.39 and had exhibited borderline measurement issues in the previous tests, it was removed from further analyses.
Table 6. Pattern matrix: factor loadings from exploratory factor analysis.
Rasch analysis
The remaining eight items were examined for Rasch model fit and unidimensionality.
The initial 8-item scale structure exhibited good global fit to the Rasch model (), with infit and outfit statistics of 0.99 and 1.00 respectively. Measurement precision was also found to be adequate, with PSR and PSI values of 0.83 and 2.21 respectively. Examining fit for the two factor sub-scales separately, both exhibited good overall fit to the Rasch model, with infit and outfit statistics close to 1.00 (). The “Mental wellbeing” factor sub-scale showed better discriminative power (PSR = 0.80, PSI = 1.98) than the “Physical/role functioning” factor sub-scale (PSR = 0.77, PSI = 1.81) which fell marginally below the thresholds for both indices.
Table 7. Scale and sub-scale fit to the Rasch model.
All individual items exhibited adequate fit to the Rasch model, with outfit and infit statistics ranging from 0.8 to 1.19 (). The Zstd values for the “Safety” item suggested potential underfit to the model, with both the infit and outfit Zstd values >2, although this is unlikely to be problematic given the adequate MnSQ values [Citation51]. Examination of the category probability curves (see for an example) and the “most probable response” map () showed that none of items exhibited disordered response thresholds.
Figure 3. Example of category probability curve for the “Accessibility (home)” item. Each line refers to the probability of a given response choice (i.e., categories labelled 1 [most positive] to 4 [most negative]) relative to item difficulty .
![Figure 3. Example of category probability curve for the “Accessibility (home)” item. Each line refers to the probability of a given response choice (i.e., categories labelled 1 [most positive] to 4 [most negative]) relative to item difficulty .](/cms/asset/1c1a395b-4cce-415b-a3e0-5959e34f7aca/idre_a_1844319_f0003_c.jpg)
Figure 4. “Most probable response” map. The “most probable response” map shows the most likely combinations of item responses at various levels of severity, expressed in logits on the x axis. The area to the extreme left corresponds to response category 1 (most positive); the area to the extreme right corresponds to response category 4 (most negative). Category numbers are shown to the left of the modal area. Expected threshold locations are illustrated as the spaces between response choices, and show the likely responses on the MobQoL-7D at various severity levels.
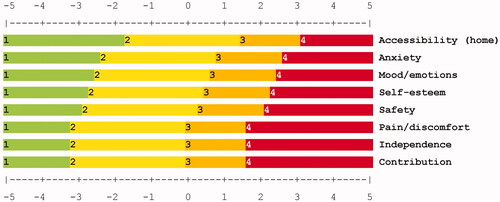
Table 8. Item fit to the Rasch model.
In the interest of parsimony, successive Rasch models were conducted to investigate the impact of item removal on global fit indices and dimensionality. The initial aim was to retain three items per factor sub-scale. The 3-item “Mental wellbeing” sub-scale exhibited good model fit (infit = 0.98, outfit = 0.93), reasonable measurement precision (PSR = 1.98, PSI = 0.80) and evidence of unidimensionality (raw variance = 67.3%, 1st contrast eigenvalue = 1.61), although the variance explained by the 1st contrast was somewhat higher than expected at 17.6% (). All possible combinations of 4-item and 3-item “Physical/role functioning” sub-scales were analysed, and compared to the original 5-item “Physical/role functioning” sub-scale; the optimal scales are presented in . The original “Physical/role functioning” 5-item sub-scale exhibited good model fit (infit = 0.98, outfit=.99), minor issues with measurement precision (PSR = 1.81, PSI = 0.77) and potential multidimensionality (raw variance = 56.6%, 1st contrast eigenvalue = 1.70, 1st contrast variance = 14.8%). The best fitting 4-item “Physical/role functioning” sub-scale omitted the “Safety” item and exhibited good model fit (infit = 0.97, outfit = 1.00), minor issues with measurement precision (PSR = 1.71, PSI = 0.75) and good evidence of unidimensionality (raw variance = 61.5%, 1st contrast eigenvalue = 1.46), although the variance explained by the 1st contrast was somewhat higher than expected at 14.1%. The best fitting 3-item “Physical/role functioning” sub-scale omitted the “Safety” and “Pain/discomfort” items and exhibited good model fit (infit = 0.96, outfit = 1.00), potential issues with measurement precision (PSR = 1.65, PSI = 0.73) and good evidence of unidimensionality (raw variance = 65.0%, 1st contrast eigenvalue = 1.59), although the variance explained by the 1st contrast was higher than expected at 18.6%.
Table 9. Sub-scale fit to the Rasch model.
The optimal 4-item “Physical/role functioning” sub-scale (with the “Safety” item removed) was eventually chosen as the best option, as it improved upon the original 5-item scale in terms of dimensionality without major impact on model fit or measurement precision. Although a 3-item sub-scale was originally sought in the interest of parsimony, issues with measurement precision were apparent in the optimal 3-item “Physical/role functioning” sub-scale. Furthermore, the importance of the association between pain and mobility was highlighted by PPI advisors. Due to the omission of the “Pain/discomfort” item and potentially worse measurement precision of the optimum 3-item sub-scale, the optimum 4-item sub-scale was considered to be the best choice.
Examining the item fit statistics for the 3-item “Mental wellbeing” sub-scale and 4-item “Physical/role functioning” sub-scale showed that all items exhibited good fit to the Rasch model with infit and outfit MnSQ values ranging from 0.71 to 1.13 (). The Zstd values for the “Contribution” (infit= −3.85, outfit= −4.07) and “Mood/emotions” (infit= −2.15, outfit= −2.49) items revealed potential overfit to the model, but given the acceptable MnSQ values, these were not considered to be problematic [Citation51]. There was no indication of underfit.
Table 10. Item fit to the Rasch model per sub-scale.
With the fit and dimensionality of the two sub-scales confirmed, overall dimensionality of the full 7-item scale (combining all items from the two sub-scales) was examined. As determined in the EFA, it was anticipated that the MobQoL items would yield two separate factors/sub-scales; the first being a physical/role functioning sub-scale of mobility-related quality of life, and the second being a mental wellbeing sub-scale of mobility-related quality of life. As such, in the Rasch dimensionality analysis a contrast dimension was expected, with item loadings reflecting the EFA factor structure. The Rasch PCA showed that 54.4% of the variance was explained by the Rasch dimension raw data. Of the variance, 12.8% was explained by the 1st contrast, which had a strength of less than 2 items (eigenvalue = 1.97). The variance explained by the first contrast suggested modest deviation from unidimensionality. Further inspection of factor loadings indicated that all items associated with the “Mental wellbeing” sub-scale loaded onto the Rasch dimension (all positive loadings ranging from 0.57 to 0.70) and all items associated with the “Physical/role functioning” sub-scale loading onto the contrast dimension (all negative loadings ranging from −0.25 to −0.56). This appears to support the underlying sub-scale structure of the measure.
Analysis of Cronbach’s α coefficient confirmed the internal consistency of the 4-item “Physical/role functioning” and 3-tem “Mental wellbeing” sub-scales (α = 0.764 and 0.829 respectively) and also of the full 7-item scale (α = 0.846).
Finalising the classification system: MobQoL-7D
After concluding the Rasch analysis, the final classification system was confirmed following consultation with the PPI advisory board. The system contains seven items each with four response levels, and is named the MobQoL 7-dimension (MobQoL-7D). Each item relates to a different conceptual dimension of mobility-related quality of life. Together the seven items form two sub-scales of mobility-related quality life; the first is associated with physical and role functioning related to mobility, and the second is associated with mental wellbeing related to mobility. In total the MobQoL-7D classification system describes 16,384 health states. The final classification system is presented in , and the subsequent questionnaire version is provided in Supplementary File 3. The “Accessibility (home)” item was relabelled as simply “Accessibility” following the removal of the related “Accessibility (community)” item.
Table 11. MobQoL-7D health state classification system.
Discussion
The development of the MobQoL-7D combined methods of qualitative “de novo” (i.e., developing from new) outcome measure development, psychometric testing, factor analysis and Rasch analysis. Principles of preference-based outcome measurement informed both item development and item selection.
Although there are existing outcome measures related to movement, occupational performance and assistive technology [Citation33–39], none of these instruments explicitly cover the concept of mobility-related quality of life. Our previous research identified the unique ways in which individuals with mobility impairments define and experience health-related quality of life [Citation23,Citation25], and also the issues with using generic preference-based measures in populations with impaired mobility [Citation12,Citation20]. The MobQoL-7D was therefore developed to be a novel condition-specific preference-based measure for patient groups with impaired mobility.
The original MobQoL descriptive system, developed through qualitative research [Citation23], contains 15 items, covering 11 proposed dimensions of mobility-related quality of life. Given the large number of items in the original descriptive system, this study was undertaken to derive a concise health state classification system suitable for preference-based valuation. Of the 15 original MobQoL items, the results indicated that seven items had sufficient measurement properties and were suitable for inclusion in a health state classification system. The EFA identified two underlying factors within the item structure, which were defined as: 1) physical and role functioning related to mobility, and 2) mental wellbeing related to mobility. Rasch analysis confirmed that these two factors represent two unidimensional sub-scales. The final MobQoL-7D health state classification system contains seven items, each representing a distinct conceptual dimension of mobility-related quality of life: Accessibility, contribution (i.e., contributing at home, work, education or in the community), pain/discomfort, independence, self-esteem, mood/emotions, and anxiety.
Condition-specific preference-based measures are typically derived from existing condition-specific measures [Citation30,Citation40], this approach offers two key benefits: firstly the health state classification system can be developed from an established condition-specific measure which is both clinically and psychometrically valid; secondly, utility outcomes can be retrospectively calculated from existing datasets. Conversely, developing a condition-specific preference-based measure from an existing condition-specific measure limits the choice of dimensions to only those covered in the original measure [Citation31], furthermore the descriptive system may be sub-optimal for health state classification.
In situations where there are no suitable condition-specific measures, methods of “de novo” condition-specific preference-based measures development are useful. Common “de novo” methods for item development include literature reviewing, consulting clinical experts and conducting qualitative interviews with specific patient groups [Citation58]. This approach can be advantageous, as items can be developed specifically for preference-based measurement, and relevant patient groups can be involved at all stages of developing and validating the measure [Citation40]. Various aspects of these different methods were combined to produce the MobQoL-7D, which appears to be a psychometrically sound measurement tool.
Mavranezouli et al. [Citation42] state that multidimensional preference-based measures should ideally comprise statistically independent dimensions, thus allowing each dimension to be treated as a separate and discrete statement. Achieving statistical independence between dimensions is particularly difficult with condition-specific preference-based measures, as dimensions are often highly correlated [Citation42]. In refining the MobQoL-7D, significant but acceptable levels of correlation were observed between certain items and the factors, hence the sub-scale structure. Previous research illustrates that dimensional structure can be used to aid item selection, even when there is a lack of independence between items [Citation31,Citation42]. Thus, it was possible to successfully select items despite a lack of independence.
Although the measurement precision results from the Rasch analysis illustrate satisfactory reliability and the Cronbach’s α results show internal consistency, it is of note that the test-retest reliability results were predominantly moderate. As noted in the results, the underwhelming test-retest outcomes may be associated with the COVID-19 outbreak, as the start of lockdown in the UK occurred during the retest follow-up period. For this reason, it is possible that respondents’ outcomes may have naturally changed due to the increased physical, social and emotional pressures experienced during lockdown. Although this analysis was retained, items were not excluded based on test-retest reliability alone. Unfortunately resources were not available to repeat the test-retest analysis at the time of this study. Another limitation of this study is that the same dataset was used to both derive and validate the health state classification system. Further validation work would therefore complement this research.
Regarding the study sample, our initial intention was to establish a broad and varied sample which, among other characteristics, represented all NHS categorisations of mobility need (low, medium, high and specialist). As part of the NHS recruitment phase, we specifically targeted individuals with varying levels of mobility need categorisation. Unfortunately, due to confidentiality and data protection regulations, we were unable to return to the NHS recruitment sites to confirm the mobility need categorisation of recruited participants. Furthermore, due to the COVID-19 pandemic most of the data collection was eventually carried out through charitable organisations who did not collect information about level of mobility need. We are therefore unable to explicitly state whether variation in level of mobility need is appropriately accounted for across the sample. However, the demographic results demonstrate wide variance in diagnoses, primary mobility aids and frequency of mobility aid use, thus we are confident that the sample is sufficiently varied with regards to mobility need and mobility impairment.
A preference elicitation exercise is now planned to develop utility weights for all health states described by the MobQoL-7D; this is scheduled for the next stage of the research. Given the large number of individual health states described by the measure, statistical modelling will be used to extrapolate weights from a smaller number of representative states. This will be carried out with both a general population sample and a sample of individuals with mobility impairments to see how preferences differ. Further research is also needed to evaluate the MobQoL-7D in larger samples and defined respondent groups; for instance, comparing results between different age groups or patient groups (e.g., defined by condition or disability).
Conclusions
The MobQoL-7D offers a valid and reliable approach to measuring the health-related quality of life of individuals with impaired mobility. This novel health state classification system has been developed specifically to generate health state utility values for QALY calculations, which in turn could help to improve the accuracy of cost-effectiveness evidence for interventions to treat and support patients with impaired mobility. The psychometric results provide good evidence of the measurement properties of the MobQoL-7D. The study sample consisted of a diverse population of individuals with a vast array of conditions and experiences of mobility impairment. Achieving satisfactory psychometric results in such a varied sample provides good support for the usefulness of the MobQoL-7D.
Supplementary File 3
Download PDF (210.7 KB)Supplementary File 2
Download MS Word (20 KB)Supplementary File 1
Download PDF (273.6 KB)Acknowledgements
This work was funded by the Welsh Government through Health and Care Research Wales. The funding body had no role in the design, conduct or reporting of this work.
The authors would like to thank Professor Joanna Coast, Professor Katherine Payne, Professor Deborah Fitzsimmons, Dr Hareth Al-Janabi, Dr Lorna Tuersley and Professor Paul Brocklehurst for acting as expert advisors to the project.
The authors would like to thank the PPI advisory board for their feedback and insight.
The authors would like to thank Cerebral Palsy UK, Ehlers-Danlos Support UK, Multiple Sclerosis Trust, HealthWise Wales, the Wrexham Artificial Limb and Appliance Service (Betsi Cadwaladr University Health Board) and the Bristol Centre for Enablement (North Bristol NHS Trust) for aiding with participant recruitment.
Disclosure statement
The authors report no conflicts of interest.
Related Research Data
References
- Department for Work and Pensions. Family resources survey 2018/19. London: Department for Work and Pensions; 2020.
- NHS Improving Quality. Right chair, right time, right now. London: NHS Improving Quality; 2014.
- NHS Digital. Wheelchair services: operational data collection – Quarter 3 2019/20 (October–December 2019); 2020. Available from: https://www.england.nhs.uk/statistics/statistical-work-areas/national-wheelchair/publication-files/
- Bray N, Noyes J, Edwards RT, et al. Wheelchair interventions, services and provision for disabled children: a mixed-method systematic review and conceptual framework. BMC Health Serv Res. 2014;14:309.
- Toro-Hernández ML, Kankipati P, Goldberg M, et al. Appropriate assistive technology for developing countries. Phys Med Rehabil Clin N Am. 2019;30:847–865.
- World Health Organization. The global burden of disease: 2004 update. Geneva: World Health Organization; 2008.
- Tebbutt E, Brodmann R, Borg J, et al. Assistive products and the sustainable development goals (SDGs). Glob Health. 2016;12:79.
- National Institute for Health and Care Excellence. Guide to the methods of technology appraisal. London: National Institute for Health and Care Excellence; 2013.
- Ubel PA, Loewenstein G, Jepson C. Whose quality of life? A commentary exploring discrepancies between health state evaluations of patients and the general public. Qual Life Res. 2003;12:599–607.
- Versteegh MM, Brouwer WB. Patient and general public preferences for health states: a call to reconsider current guidelines. Soc Sci Med. 2016;16:16–74.
- Pettitt DA, Raza S, Naughton B, et al. The limitations of QALY: a literature review. J Stem Cell Res Ther. 2016;6:334.
- Bray N, Spencer LH, Edwards RT. Preference-based measures of health-related quality of life in congenital mobility impairment: a systematic review of validity and responsiveness. Health Econ Rev. 2020;10:9.
- Rosenbaum PL, Livingston MH, Palisano RJ, et al. Quality of life and health-related quality of life of adolescents with cerebral palsy. Dev Med Child Neurol. 2007;49:516–521.
- Young N, Rochon T, McCormick A, et al. The health and quality of life outcomes among youth and Young adults with cerebral palsy. Arch Phys Med Rehabil. 2010;91:143–148.
- Rocque BG, Bishop ER, Scogin MA, et al. Assessing health-related quality of life in children with spina bifida. J Neurosurg Pediatr. 2015;15:144–149.
- Tilford JM, Grosse SD, Robbins JM, et al. Health state preference scores of children with spina bifida and their caregivers. Qual Life Res. 2005;14:1087–1098.
- Livingston MH, Rosenbaum PL. Adolescents with cerebral palsy: stability in measurement of quality of life and health-related quality of life over 1 year. Dev Med Child Neurol. 2008;50:696–701.
- Sims-Williams HJ, Sims-Williams HP, Mbabazi Kabachelor E, et al. Quality of life among children with spina bifida in Uganda. Arch Dis Child. 2017;102:1057–1061.
- Young NL, Sheridan K, Burke TA, et al. Health outcomes among youths and adults with Spina bifida. J Pediatr. 2013;162:993–998.
- Bray N, Noyes J, Harris N, et al. Measuring the health-related quality of life of children with impaired mobility: examining correlation and agreement between children and parent proxies. BMC Res Notes. 2017;10:1–8.
- Usuba K, Oddson B, Gauthier A, et al. Changes in gross motor function and health-related quality of life in adults with cerebral palsy: an 8-year follow-up study. Arch Phys Med Rehabil. 2014;95:2071–2077.
- Anand P, Roope LSJ, Culyer AJ, et al. Disability and multidimensional quality of life: a capability approach to health status assessment. Health Econ. 2020;29:748–765.
- Bray N, Spencer LH, Tuersley L, et al. Development of the MobQoL patient reported outcome measure for mobility-related quality of life. Disabil Rehabil. 2020.
- Bartonek A, Saraste H, Danielsson D. Health-related quality of life and ambulation in children with myelomeningocele in a Swedish population. Acta Paediatr. 2012;101:953–956.
- Bray N, Noyes J, Harris N, et al. Defining health-related quality of life for young wheelchair users: a qualitative health economics study. PLoS One. 2017;12:e0179269.
- Bogart KR. The role of disability self-concept in adaptation to congenital or acquired disability. Rehabil Psychol. 2014;59:107–115.
- Dolan P, Kahneman D. Interpretations of utility and their implications for the valuation of health. Econ J. 2008;118:215–234.
- Sharma R, Stano M, Haas M. Adjusting to changes in health: implicationsfor cost-effectiveness analysis. J. Health Econ. 2004;23:335–351.
- Brazier J, Ratcliffe J, Salomon J, et al. Measuring and valuing health benefits for economic evaluation. 2nd ed. Oxford: Oxford University Press; 2016.
- Goodwin E, Green C. A systematic review of the literature on the development of condition-specific preference-based measures of health. Appl Health Econ Health Policy. 2016;14:161–183.
- Goodwin E, Green C. A quality-adjusted life-year measure for multiple sclerosis: Developing a patient-reported health state classification system for a multiple sclerosis-specific preference-based measure. Value Health. 2015;18:1016–1024.
- Beusterien K, Leigh N, Jackson C, et al. Integrating preferences into health status assessment for amyotrophic lateral sclerosis: the ALS Utility Index. Amyotroph Lateral Scler Other Motor Neuron Disord. 2005;6:169–176.
- Demers L, Weiss-Lambrou R, Ska B. The Quebec User Evaluation of Satisfaction with Assistive Technology (QUEST 2.0): an overview and recent progress. TAD. 2002;14:101–105.
- Mills T, Holm MB, Trefler E, et al. Development and consumer validation of the Functional Evaluation in a Wheelchair (FEW) instrument. Disabil Rehabil. 2002;24:38–46.
- Stanley RK, Stafford DJ, Rasch E, et al. Development of a functional assessment measure for manual wheelchair users. J Rehabil Res Dev. 2003;40:301–307.
- Day H, Jutai J. Measuring the psychosocial impact of assistive devices: the PIADS. Can J Rehabil. 1996;9:159–168.
- Cusick A, McIntyre S, Novak I, et al. A comparison of goal attainment scaling and the Canadian occupational performance measure for paediatric rehabilitation research. Pediatr Rehabil. 2006;9:149–157.
- Mortenson WB, Miller WC, Miller-Pogar J. Measuring wheelchair intervention outcomes: development of the wheelchair outcomes measure. Disabil Rehabil Assist Technol. 2007;2:275–285.
- Tuersley L, Bray N, Edwards RT. Development of the Wheelchair outcomes Assessment Tool for Children (WATCh): a patient-centred outcome measure for young wheelchair users. PLoS One. 2018;13:e0209380.
- Rowen D, Brazier J, Ara R, et al. The role of condition-specific preference-based measures in Health Technology Assessment. Pharmacoeconomics. 2017;35:33–41.
- Feeny D, Furlong W, Torrance GW, et al. Multi-attribute and single-attribute utility functions for the Health Utilities Index Mark 3 system. Medical Care. 2002;40:113–128.
- Mavranezouli I, Brazier J, Young T, et al. Using Rasch analysis to form plausible health states amenable to valuation: The development of CORE-6D from a measure of common mental health problems (CORE-OM). Qual Life Res. 2011;20:321–333.
- National Institute for Health and Care Excellence. Developing NICE guidelines: the manual. London: National Institute for Health and Care Excellence; 2014.
- Mitchell PM, Roberts TE, Barton PM, et al. Assessing sufficient capability; a new approach to economic evaluation. Soc Sci Med. 2015;139:71–79.
- Office for Disability Issues. Equality Act 2010 guidance: guidance on matters to be taken into account in determining questions relating to the definition of disability. London: Office for Disability Issues; 2011.
- Fayers PM, Machin D. Quality of life: the assessment, analysis and reporting of patietn-reported outcomes. 3rd ed. Chichester: John Wiley & Sons; 2016.
- Juniper EF, Guyatt GH, Jaeshke R. How to develop and validate a new health-related quality of life instrument. In Spiker B, editor. Quality of life and pharmacoeconomics in clinical trials. Philadelphia (PA): Lippincott-Raven Publishers; 1996.
- Laerd Statistics. Statistical tutorials and software guides: Mann-Whitney U test using SPSS Statistics. 2015. Available from: https://statistics.laerd.com/premium/spss/mwut/mann-whitney-test-in-spss.php
- Williams B, Brown T, Onsman A. Exploratory factor analysis: a five-step guide for novices. Australas J Paramedicine. 2010;8:1–13.
- Young T, Yang Y, Brazier J, et al. The first stage of developing preference-based measures: constructing a health-state classification using Rasch analysis. Qual Life Res. 2009;18:253–265.
- Linacre JM. Fit diagnosis: infit outfit mean-square standardized. 2020. Available from: https://www.winsteps.com/winman/misfitdiagnosis.htm
- Bond TG, Fox CM. Applying the Rasch model: fundamental measurement in the human sciences. 3rd ed. New York: Routledge; 2015.
- Pallant J, Tennant A. An introduction to the Rasch measurement model: an example using the Hospital Anxiety and Depression Scale (HADS). Br J Clin Psychol. 2007;46:1–18.
- Linacre JM. Reliability and separation of measures. 2020. Available from: https://www.winsteps.com/winman/reliability.htm
- Linacre JM. Winsteps® Rasch measurement computer program User’s Guide. Beaverton (OR): Winsteps.com; 2020.
- Smith AB, Fallowfield LJ, Stark DP, et al. A Rasch and confirmatory factor analysis of the general health questionnaire (GHQ)-12. Health Qual Life Outcomes. 2010;8:45.
- Field A. Discovering statistics using IBM SPSS Statistics. 5th ed. London: SAGE; 2017.
- Brazier J, Rowen D, Mavranezouli I, et al. Developing and testing methods for deriving preference-based measures of health from condition-specific measures (and other patient-based measures of outcome). Health Technol Assess. 2012;16:1–114.