
Abstract
Purpose: To evaluate functional outcomes, care needs and cost-efficiency of specialist rehabilitation for a multi-centre cohort of inpatients with spinal cord injury (SCI)-comparison based on age and aetiology.
Methods and materials: Retrospective analysis of prospectively collected data from the UK Rehabilitation Outcomes Collaborative (UKROC) national clinical database from 2012-2019. Adults with SCI admitted for a rehabilitation programme in levels 1 and 2 specialist rehabilitation Units in England, were included if they had valid UK Functional Assessment Measure (UK FIM + FAM) and Northwick Park Dependency Scale (NPDS) scores recorded on admission and discharge (n = 2506 of 3321 admissions).
Results: Approximately 425 patients were admitted yearly. 1344(56%) patients were under 65. 736(29%) had traumatic aetiology. Older and Traumatic SCI patients were more likely to have cervical cord damage (X2, p < 0.001). There was a significant improvement in all parameters of functional independence (UK FIM + FAM) (p < 0.001), with the reduction in dependency and care costs (NPDS/NPCNA) (p < 0.001). 1817(72.5%) patients were discharged home. Mean care-costs savings were £25 500/year per patient. Year-on-year trends showed admissions with increasing age, higher complexity and dependency with corresponding increasing episode costs (ANOVA p < 0.001). However, the time taken to offset the cost of rehabilitation did not change significantly (ANOVA p = 0.57).
Conclusions: Specialist rehabilitation services provide effective and cost-efficient rehabilitation for patients with spinal cord injury.
Approximately a third of patients who access specialist inpatient rehabilitation following spinal cord injury (SCI) in England are managed in the Specialist Level 1 and 2 neuro-rehabilitation units, rather than in the eight designated national SCI Centres.
Despite admitting progressively more complex and dependent patients over eight years, these specialist rehabilitation units continue to provide highly cost-efficient care.
The mean annual savings amount to £25,500 per patient. With a mean admission rate of 425 patients, this would generate total savings in excess of £10 million per year for the cohort.
Specialist rehabilitation services play an important, but under-recognised, role in the spinal cord injury care pathway.
Implications for Rehabilitation
Introduction
Rehabilitation for patients who have suffered a spinal cord injury (SCI) has been a special area of interest within the UK National Health Service (NHS) since Sir Ludwig Guttman laid its foundations after the second world war [Citation1]. National guidance has continued to evolve over the ensuing decades. The UK National Institute of Health and Care Excellence (NICE) recommends that SCI patients should have life-long personalised care guided by a designated spinal cord injury centre [Citation2]. NHS England (the body that oversees commissioning and provision of specialised healthcare in England) commissions eight such centres across the country, catering for approximately 900 admissions per year between them [Citation3,Citation4]. However, the incidence of SCI continues to increase and is now estimated to be approximately 2400 people per year [Citation4], which begs the question of what happens to the rest? Internationally, there are limited studies evaluating the care and outcomes of patients with spinal cord injury outside of a spinal cord injury centre [Citation5]. Even fewer have addressed cost-efficiency in terms of long-term on-going-care costs for this cohort.
In addition to the designated SCI centres, approximately 75 other units in England provide either tertiary (level 1) or secondary (level 2) specialist rehabilitation services for a wider cohort of patients with complex (mainly neurological) disabilities – of which SCI makes up about 9% of the annual caseload [Citation6]. Within the NHS, there is a perception that patients managed in these centres are mainly older patients with non-traumatic injuries or those with associated head injuries, but evidence for this is lacking.
The UK Rehabilitation Outcomes Collaborative (UKROC) national clinical registry collects systematic data from routine clinical practice on needs, inputs, outcomes and cost efficiency of rehabilitation for every patient admitted to levels 1 and 2 specialist rehabilitation services in England. (This does not include the national SCI centres, which submit data to a separate national SCI database and registry). An analysis of UKROC data published in 2016 [Citation6] included 506 SCI patients and showed rehabilitation to be both effective and cost-efficient in this group. The numbers at that time were too small for subgroup analysis, but the dataset has since grown to over 2500 SCI cases.
This study presents a further analysis of this expanded dataset. The aims were to describe the SCI patient cohort admitted to the levels 1 and 2 specialist rehabilitation services; to examine any year-on-year trends in the caseload and outcomes, and to explore any differences in presentation, outcomes and cost-efficiency between groups of patients based on age and aetiology of the SCI (i.e., traumatic or non-traumatic).
Methods
Design
An 8-year multi-centre national cohort retrospective analysis of prospectively collected clinical data from the UK Rehabilitation Outcomes Collaborative (UKROC) national clinical database 2012–2019. This was a non-interventional observational study.
Inclusion criteria
Participants were adults (aged 16 and over) diagnosed with SCI, treated at levels 1 and 2 specialist in-patient rehabilitation units throughout England.
Setting and data source
In England, tertiary specialist rehabilitation units have been set up to provide care for patients with highly complex needs. Level 1 units provide care for patients with complex rehabilitation needs that are beyond the scope of their local and district specialist services, providing care for a regional population of 1 to 5 million through specialised commissioning arrangements. Level 2 specialist rehabilitation services (local and district) units generally provide care to a population of 300–750 000 people with complex to moderate rehabilitation needs.
Data for this analysis was extracted from the UKROC national database. Originally established in 2009 through funding from the National Institute for Health Research (NIHR) [Citation7], the database is now commissioned directly by NHS England to provide data for commissioning and quality benchmarking for specialist in-patient rehabilitation in England. The dataset comprises socio-demographic and process data (waiting times, discharge destination, etc.) as well as clinical information on the complexity of rehabilitation needs; inputs provided to meet those needs; and outcomes in terms of both functional gain and cost-efficiency. Data are collected locally and uploaded at monthly intervals to a centre secured NHS server. Full details may be found on the UKROC website (https://www.kcl.ac.uk/cicelysaunders/research/studies/uk-roc/index).
Ethics permission
Collection and reporting of the UKROC dataset are commissioning requirements according to the NHS England service specification for levels 1 and 2 Rehabilitation Services. According to the UK Health Research Authority, the publication of research findings from de-identified data gathered in the course of routine clinical practice does not require research ethics permission.
Principal measurements
The Rehabilitation Complexity Scale (RCS-E): The RCS-E is a simple scale of the complexity of rehabilitation needs in terms of medical nursing and therapy inputs [Citation8]. It has evolved through several versions during the last decade, but the version used here is v12 (score range 0–20).
The UK FIM + FAM: The UK Functional Assessment Measure is a global measure of disability [Citation9,Citation10]. It includes the 18-item FIM (version 4) and adds a further 12 items, mainly addressing psychosocial function giving a total of 30 items (16 motor and 14 cognitive items). Each item is scored on a seven-point ordinal scale from 1 (total dependence) to 7 (complete independence). The Total FIM + FAM score ranges from 30–210: (motor sub-score range 16–112 and cognitive sub-score 14–98.)
The Northwick Park Dependency Score (NPDS) is an ordinal scale of dependency of nursing staff time (number of helpers and time taken to assist with each task) designed to assess needs for care and nursing in clinical rehabilitation settings [Citation11]. It comprises a 16-item scale of Basic Care Needs (range 0–65) and a 7-item scale of Special Nursing Needs (range 0–35) – total range 0–100. It is shown to be a valid and reliable measure of needs for care and nursing in rehabilitation settings [Citation12].
The Northwick Park Care Needs Assessment (NPCNA) is derived from the Northwick Park Nursing Dependency tool (NPDS tool) which is an assessment of patients’ care needs for activities of daily living, safety awareness, behavioural management and communication. Based on the information provided from the NPDS tool, a computerised algorithm built into the database provides an automated estimation of total care hours per week and the approximate weekly cost of care (£/week) in the community, based on the UK care agency costs [Citation13].
Cost Efficiency of rehabilitation: UKROC provides the official patient-level costing data for specialist rehabilitation to NHS England. It reports episode costs based on the weighted bed-day costs calculated at fortnightly intervals, banded by rehabilitation complexity according to the published NHS weighted bed-day tariff prices. The episode cost was calculated per patient as “weighted bed-day cost × length of stay” [Citation14]. Within the UKROC dataset, cost efficiency is calculated as the time taken to offset the cost of rehabilitation by the resulting savings in the cost of ongoing care in the community. Once again, this is calculated at the patient level, from the “episode cost of rehabilitation” divided by “reduction in the weekly cost of care” from admission to discharge, as estimated by the NPCNA [Citation15].
Data extraction
De-identified data were extracted for all recorded in-patient episodes for adults (≥16 years) admitted to a level 1 or 2 specialist rehabilitation service and discharged during the 7-year period between 2012 and 2019, if they had:
Spinal cord injury recorded in the diagnostic category
A length of stay 8-400 days (i.e., plausible admissions for rehabilitation, excluding cases admitted for brief in-patient assessment or long-term care).
Valid UK FIM + FAM and NPDS ratings were completed both within 10 days of admission and within the last week before discharge.
Data were collated in MS Excel and transferred to SPSS v26 for analysis.
Data handling and analysis
In this analysis, given the large size of the dataset and the long-ordinal nature of the measures (i.e., many possible data points), we have chosen to describe and analyse the data using parametric statistics. 95% confidence intervals were calculated and multiple comparisons made using bootstrapping with samples of n = 1000, to minimise the effect of any skewed data.
Paired T-tests were used to compare significant differences between admission and discharge.
One-way ANOVAs with bootstrapped post-hoc analysis and Bonferroni correction to correct for multiple tests were used to compare differences for diagnostic groups and different levels of dependency. Key results from post hoc analyses are summarised in the text, but not given in tables.
The population size of this observational study was based on the number of participants that met the inclusion criteria. The overall dataset was further analysed by the following subcategories:
Aetiology: traumatic versus non-traumatic spinal cord injury.
Age on admission: <65 years and ≥65 years.
Because data reporting was initially voluntary, some missing data were expected. No data were imputed for missing values.
Results
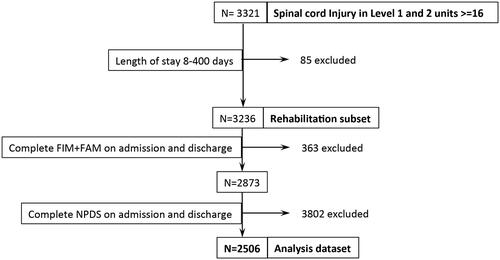
Approximately 400–450 SCI patients were registered each year between 2012 and 2019, with no significant year-on-year trend (see Electronic supplement). illustrates the data extraction process. From a total of 3321 adults (≥16 years) with SCI admitted for rehabilitation in levels 1 and 2 units, 3236 had a length of stay between 8 and 400 d. Of these, 2506 had both a complete FIM + FAM and NPDS on admission and discharge.
Figure 1. Illustrates the data extraction process to derive the dataset used for analysis.
shows the demographics for the whole sample, as well as for patients categorised by age and by aetiology (traumatic vs non-traumatic). The overall study sample comprised approximately 3:2 males: females, with a mean age at the admission of 61.3 (sd = 16.6) years.
Table 1. Demographics.
The median time between onset and admission (“time since onset”) was 41 (IQR = 22–82) days. The mean rehabilitation length of stay was 71.8 (sd = 52) days. The vast majority of patients (85%) were admitted to level 2 specialist rehabilitation units, with only 15% being admitted to level 1 units. The median time from referral to admission was 12 (IQR = 5–25) days.
Just over half of the patients (54%) were under 65 years, and 29% had traumatic aetiology. In the group with non-traumatic SCI, the commonest aetiologies were inflammation or tumour, but over one-third (39%) were simply listed as “other.”
Of 2506 patients, 1817 were discharged home (72.5%), with only 92 patients (3.7%) being transferred to a different inpatient rehabilitation facility (including Spinal Cord Injury Centres) and 125 (5%) being discharged to a nursing home. Of those discharged to Nursing Homes, more patients were over the age of 65 (7.7% vs. 2.6% under 65).
Dependency and functional outcomes
summarises the overall dependency and functional outcome scores for the sample, along with cost-efficiency. Between admission and discharge, there was a highly significant increase in all parameters of functional independence (UK FIM + FAM) (p < 0.001), with a corresponding reduction in all parameters of dependency and care costs (NPDS/NPCNA) (p < 0.001). The mean total FIM + FAM gain was 27.9 (95% CI 27.1, 28.7) and the mean individually-calculated FIM + FAM efficiency/week was 0.56 (95% CIs 0.54, 0.59). As well as the significant expected increase in the FIM + FAM motor scores (22.9), the increase in FIM + FAM “cognitive score” (which encompasses cognitive, psychosocial and communication elements) of 5.0 (95% CIs 4.6, 5.4) was also significant (see below).
Table 2. Overall dependency and functional outcome scores on admission and discharge (n = 2506).
The mean total episode cost of the rehabilitation programme was £31059 (see ) and the mean savings in the on-going cost of care in the community was £490/week (£25 500/year) per patient treated. The mean time taken to offset the initial costs of rehabilitation was 30.7 months (95% CI 27.0, 34.3).
At the individual item level, the UKROC software generates “FAM-splats” in the form of radar charts, which provide an “at-a-glance” view of the disability profile and patterns of change during rehabilitation for the 30 FIM + FAM items. and show the composite FAM splats based on median item scores at admission and discharge for the total sample. It can be seen that the principal changes within the “cognitive” sub-score reflected improvements in psychosocial function (i.e., emotional status, adjustment to limitations and use of leisure time), rather than actual cognitive function per se (i.e., memory, orientation, concentration). Median scores for these three cognitive items were 7 both on admission and discharge, so there was no clear evidence to suggest that these patients had significant associated brain injuries. The changes in problem-solving and maintaining safety are more likely to reflect their adjustment and finding new ways to cope with their disability.
Figure 2. The radar chart (or “FAM splat”) provides a graphic representation of the disability profile from the FIM + FAM data. The 30 scale items are arranged like spokes of a wheel. Scoring levels from 1 (total dependence) to 7 (total independence) run from the centre outwards. Thus, a perfect score would be demonstrated as a large circle. This composite radar chart illustrates the median scores on admission and discharge. The yellow-shaded (or pale grey) portion represents the median scores on admission for each item. The blue-shaded (or dark grey) area represents the change in median score from admission to discharge. Clear differences in the pattern of disability can be seen between the four groups.
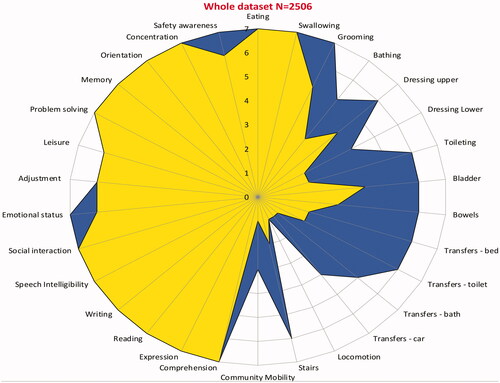
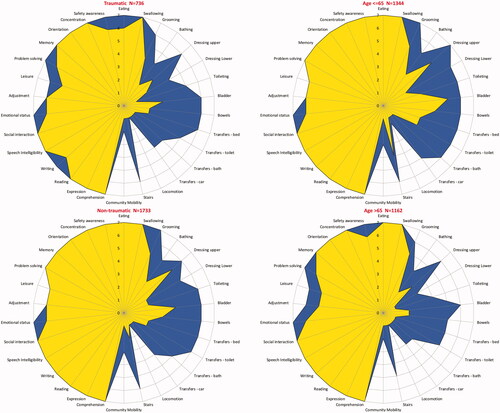
Figure 3. FAM splats provide an “at a glance” comparison of item level changes for different groups of patients. Here, traumatic vs. non-traumatic SCI and patients <65 vs. ≥65 years of age.
Differences between age groups
The differences in functional outcome and dependency scores between the age groups are summarised in . The older patients were more likely to have cervical cord damage (41% vs. 33%: X2 =25.4, df = 2, p < 0.0001) (see ). They were significantly more dependent on admission with lower FIM + FAM Motor scores, and higher NPDS scores and estimated weekly care costs. Although both groups made a significant change in dependency and care costs from admission to discharge, the change scores were not significantly different. The mean individually calculated time to offset the cost of rehabilitation was actually slightly lower in the >65 age group (27.5 months compared with 33.3 months in the younger group) but this did not reach statistical significance.
Table 3. Comparison of functional and dependency scores between age groups.
Differences between groups based on aetiology
Comparing the patients with traumatic vs non-traumatic SCI, a greater proportion of the patients with trauma-related injury had cervical cord damage (53.8% vs 30.1%; X2=123.0, df = 2, p < 0.0001) (see ). As a result, they were more dependent (both in terms of motor and cognitive function), on admission and on discharge, with significantly higher care costs. The differences in functional outcome across the aetiological groups are summarised in .
Table 4. Comparison of functional and dependency scores between aetiology groups.
There was no significant difference between the two groups in the change of either dependency and care costs demonstrating that they were equally cost-efficient to treat. illustrates the item level comparison for groups based on both age and aetiology.
Year on year trends
The years on year trends are illustrated in the Electronic supplement. Between 2012 and 2019 there was a significant trend towards increasing age (ANOVA p = 0.03), complexity (RCS-E) (ANOVA p < 0.001), dependency (NPDS) (ANOVA p < 0.001) and lower UK FIM + FAM scores (ANOVA p < 0.001) – the latter being mainly reflected in the FIM + FAM motor scores. Despite the corresponding trend towards increased episode costs (rising by a mean of £12 000 per episode, (ANOVA p < 0.001) the cost-efficiency (time taken to offset the costs of rehabilitation through savings in on-going care costs) did not change significantly (ANOVA p = 0.57).
Discussion
This multi-centre national cohort analysis of prospectively collected data from the UK demonstrates that, between them, the specialist levels 1 and 2 units provide rehabilitation for approximately half as many SCI patients as do the Spinal Cord Injury Centres. The overall results confirm the findings of the earlier analysis of the UKROC dataset [Citation6], demonstrating that patients make significant functional gains and that the initial costs of rehabilitation (approximately £31 000 on average), were offset within about 2½ years by savings in the ongoing cost of care. The mean annual savings amounted to £25 500 per patient. With a mean admission rate of 425 patients, this would generate total savings in excess of £10 m per year for the cohort.
Contrary to common perceptions, over half of the patient cohort in this study were younger patients (<65 years old), and nearly a third of them have had traumatic spinal cord injuries. There was no evidence for significant associated brain injury. This larger study has provided further insight into the comparative outcomes for patients of different ages and aetiology.
Unsurprisingly, the patients >65 years were more disabled on both admission and discharge compared to the younger group, but they still made significant functional gains during rehabilitation. In fact, the change in function and dependency was not significantly different from their younger peers, and, if anything they were more cost-efficient to treat with the costs of treatment being offset in just 27.5 months compared to 33.3 months for the younger group.
A greater proportion of the patients with traumatic SCI had cervical cord damage compared with the non-traumatic group, which may at least partially explain the fact that they were more dependent, both on admission and discharge – and also their slightly increased problems with psychosocial adjustment and writing on admission. Despite this, both groups showed improvement in all UK FIM + FAM domains from admission to discharge with no significant difference in a functional change of cost-efficiency. These improvements in functional outcomes resonate with those of a National SCIC study by Kennedy et al. (2013) [Citation16].
Almost three-quarters of patients were discharged home and only a minimal proportion (4%) of patients were transferred to other inpatient rehabilitation centres. This demonstrates that levels 1 and 2 specialist units are providing the full inpatient rehabilitation pathway for the large majority of patients, and not just functioning as interim care facilities within the SCI care pathway while patients wait for a bed in one of the national centres.
The year-on-year trends demonstrate that levels 1 and 2 specialist rehabilitation units have progressively admitted SCI patients who are older and more dependent, with the increasing complexity of their rehabilitation needs and a corresponding increase in episode costs. Despite this, cost-efficiency remains unchanged, demonstrating the importance of providing rehabilitation for these older, more complex patients.
Strengths and limitations
Comparative strength of this study is a large number of patients and wide geographical coverage, encompassing all levels 1 and 2 rehabilitation units in England. This, together with the fact that data were collected during real-life clinical practice, means that the results are highly likely to be generalisable.
Incomplete data are expected in studies conducted in the course of routine clinical practice. In this study, more than three-quarters (77%) of the population of interest had complete data which compares favourably with the completion rates in many such studies.
Unfortunately, data to describe the level and severity of spinal cord injury (such as the Frankel Grade or American Spinal Injury Association (ASIA) Impairment Scale) is not currently mandated within the UKROC dataset so we do not currently have these data to compare with other series.
Similarly, it is not possible to compare our outcomes with those of the national SCI centres, which report to a different national database that uses a different set of measures, such as the Spinal Cord Independence Measure (SCIM) [Citation17]. And sadly, as demonstrated by other recent studies [Citation18], the UK NHS data systems do not collect any useful data on rehabilitation and outcomes outside of these specialist databases, so we do not have any information about what happens to SCI patients who are unable to access either a national SCI centre or a levels 1 and 2 rehabilitation service. Future data linkage studies would be helpful to track patients through the pathway to determine the longer-term outcomes for all three groups of patients.
Finally, the argument for cost-efficiency is reliant on patients both maintaining the gains in independence that they make during rehabilitation and living long enough for the savings in care costs to be released. Given the relatively young age of the population (62 years on average), who were largely discharged to their home setting, it is highly likely that the savings will lead to significant long-term gains. However, patients with SCI remain at risk of complications such as urinary tract infections, spasticity and pressure sores which may alter their functioning and care needs over time and so impact negatively on the longer-term cost savings. In addition, they have a shorter than normal life expectancy. Further research is therefore warranted to explore the estimated lifetime saving in care costs, taking these factors into account – along similar lines to those previously published for patients with acquired brain injury [Citation19,Citation20].
Conclusion and future implications
Despite the above limitations, this study shows that specialist rehabilitation services provide effective and cost-efficient rehabilitation for patients with spinal cord injury outside of the national SCI centres and should be considered an integral part of the spinal cord injury care pathway and networks. While these findings pertain to the organisation and provision of services within the UK, we believe that the principles are likely to have application in healthcare systems in other parts of the world. We hope that this article will encourage other groups to examine the cost-efficiency of rehabilitation as part of their routine.
Going forward, it is critical to have a clear understanding of where different SCI patients are managed and why. Data linkage and closer alignment between the UKROC and national SCI databases (as well as with datasets from acute care services) is necessary to facilitate comparison – for example, to provide more detailed analyses of the rehabilitation needs of patients with SCI, how these are met within different types of service and the outcomes that ensue. This information will provide a stronger evidence base to help determine what approaches work best for which patients so that services can be planned according to patient needs. Within the major trauma networks, the use of the Rehabilitation Prescription has proven to be an effective tool to identify and manage unmet needs for rehabilitation [Citation18]. It is possible that its wider use would also benefit patients with SCI.
Author contributions
Professor Lynne Turner-Stokes was the principal investigator for the larger programme of which formed a part and leads the development of the UKROC register and dataset. She took the lead role in the planning, design, execution, and governance of the study. She performed the analyses presented within this article and had overall responsibility for the drafting of the manuscript.
Dr. Gisele Lafeuillee shared the writing of the initial draft. She was responsible for the presentation and submission of the manuscript and for coordinating the review and editing process.
Dr. Richard Francis assisted with the writing of the initial draft and assembling and tabulating the results.
Dr. Meenakshi Nayar contributed to writing, reviewing, and commenting on the script.
Dr. Ajoy Nair initiated the request for this analysis and assisted with framing the questions for analysis. He contributed to reviewing and commenting on the script.
Electronic_supplement_graphs_2.pdf
Download PDF (165.7 KB)Acknowledgements
The authors would like to thank the hard work of all the clinical teams and patients who have contributed to the UKROC database. Special thanks are due to the UKROC team including Keith Sephton, Heather Williams, Margaret Kaminska, Lynette George, and Alan Bill for their work in maintaining and validating the database.
Disclosure statement
Outcome measurement is a specific research interest of our centre. Lynne Turner-Stokes is Director of UKROC and was the lead developer of the NPDS, NPCNA and the UK FIM + FAM, but neither she nor her employing institution has any financial interest in the tools which are disseminated free of charge. None of the authors has any personal financial interests in the work undertaken or the findings reported.
Data availability statement
The authors confirm that the data supporting the findings of this study are available within the article and its supplementary materials. Raw datasets are not available for reasons of patient confidentiality. UKROC has a mechanism for considering applications for data-sharing and data linkage for analyses that will benefit patients and the NHS.
Copies of the tools used in this study are available free of charge from the authors. Please visit our website for more details and contact information. https://www.kcl.ac.uk/cicelysaunders/research/studies/uk-roc/tools
Correction Statement
This article has been corrected with minor changes. These changes do not impact the academic content of the article.
Additional information
Funding
Related Research Data
References
- Osman A, Kumar N, Chowdhury J. The evolution of national care pathways in spinal cord injury management. Trauma. 2017;19(1_suppl):4–9.
- National Institute of Health and Care Excellence (UK). Spinal injury: assessment and initial management. NICE guideline NG41. London: National Clinical Guideline Centre (UK); 2016.
- Spinal cord injury service specification (adults & children). NHS England, London, 2019. Available from: https://www.england.nhs.uk/wp-content/uploads/2019/04/service-spec-spinal-cord-injury-services-all-ages.pdf
- National Spinal Cord Injury Strategy Board (NSCASB). Specialised spinal cord injury services annual statement 2018/2019. London. 2019 [cited 2021 Jun 3]; p. 4. Available from: http://www.nscisb.nhs.uk/docs.aspx?section=Annual%20Reports
- The Spinal Cord Injury Research Evidence (SCIRE) Project. Spinal cord injury rehabilitation practices – version 7.0. Canada: University of British Columbia; 2020.
- Turner-Stokes L, Williams H, Bill A, et al. Cost-efficiency of specialist inpatient rehabilitation for working-aged adults with complex neurological disabilities: a multi-centre cohort analysis of a national clinical data set. BMJ Open. 2016;6(2):e010238.
- Turner-Stokes L. Cost-efficient service provision in neurorehabilitation: defining needs, costs and outcomes for people with Long term neurological conditions. London: Northwick Park Hospital, National Institute for Health Research Programme Grant for Applied Research; 2008 [cited 2021 Jun 3]. Available from: https://www.kcl.ac.uk/cicelysaunders/research/studies/uk-roc/final-submitted-programme-grant-report-29.07.15-draft.pdf.
- Turner-Stokes L, Scott H, Williams H, et al. The rehabilitation complexity scale-extended version: detection of patients with highly complex needs. Disabil Rehabil. 2012;34(9):715–720.
- Turner-Stokes L, Nyein K, Turner-Stokes T, et al. The UK FIM + FAM: development and evaluation. Clin Rehabil. 1999;13(4):277–287.
- Turner-Stokes L, Siegert RJ. A comprehensive psychometric evaluation of the UK FIM + FAM. Disabil Rehabil. 2013;35(22):1885–1895.
- Turner-Stokes L, Tonge P, Nyein K, et al. The Northwick Park Dependency Score (NPDS): a measure of nursing dependency in rehabilitation. Clin Rehabil. 1998;12(4):304–318.
- Siegert RJ, Turner-Stokes L. Psychometric evaluation of the Northwick Park Dependency Scale. J Rehabil Med. 2010;42(10):936–943.
- Turner-Stokes L, Nyein K, Halliwell D. The Northwick Park Care Needs Assessment (NPCNA): a directly costable outcome measure in rehabilitation. Clin Rehabil. 1999;13(3):253–267.
- Turner-Stokes L, Sutch S, Dredge R. Healthcare tariffs for specialist inpatient neurorehabilitation services: Rationale and development of a UK casemix and costing methodology. Clin Rehabil. 2012;26(3):264–279.
- Turner-Stokes L, Paul S, Williams H. Efficiency of specialist rehabilitation in reducing dependency and costs of continuing care for adults with complex acquired brain injuries. J Neuro Neurosurg Psychiatr. 2006;77(5):634–639.
- Kennedy P, Chessell Z. Traumatic versus non-traumatic spinal cord injuries: are there differential rehabilitation outcomes? Spinal Cord. 2013;51(7):579–583.
- Catz A, Itzkovich M, Agranov E, et al. SCIM – spinal cord independence measure: a new disability scale for patients with spinal cord lesions. Spinal Cord. 1997;35(12):850–856.
- National Clinical Audit for Specialist rehabilitation following major Injury (NCASRI). Final audit report. London North West University Healthcare NHS Trust (UK) and Health Quality Improvement Partnership; 2019 [cited 2021 Jun 3]. Available from: https://www.kcl.ac.uk/cicelysaunders/about/rehabilitation/nhs-audit-report-v9-rgb.pdf
- Turner-Stokes L, Dzingina M, Shavelle R, et al. Estimated life-time savings in the cost of ongoing care following specialist rehabilitation for severe traumatic brain injury in the United Kingdom. J Head Trauma Rehabil. 2019;34(4):205–214.
- Oddy M, da Silva Ramos S. The clinical and cost-benefits of investing in neurobehavioural rehabilitation: a multi-centre study. Brain Inj. 2013;27(13–14):1500–1507.