
Abstract
Purpose
1: To determine whether Total UK FIM + FAM scores can identify patients in VS/MCS. 2: Using the identified cut-off points, to examine outcomes from specialist rehabilitation.
Methods
Part 1: Retrospective analysis of a consecutive clinical cohort (n = 388) presenting to a single specialist PDOC evaluation programme 2007–2021. FIM + FAM scores were analysed by PDOC diagnosis to define cut-off points for vegetative (VS) and minimally conscious states (MCS). Part 2: Multicentre cohort analysis of prospectively-collected clinical outcomes data from the UK Rehabilitation Outcomes Collaborative database of adults in PDOC registered 2011–2020 (n = 2384 in 68 centres).
Results
Cut-off points of ≤31 and 32–35 in FIM + FAM total scores respectively identified patients in VS/MCS-Minus and MCS-Plus. Approximately 365 PDOC patients are admitted to specialist rehabilitation units in England each year. By discharge, 43% have emerged into consciousness and demonstrate a wide range of disability. A few reached full independence, but the majority remained severely dependent. Nevertheless, those who emerged generated mean net life-time savings of over £436,000 (£400 million for this cohort).
Conclusion
In absence of a dedicated PDOC registry, FIM + FAM scores can identify patients in VS/MCS at population level. Identifying those who emerge and providing timely rehabilitation generates cost-savings well-exceeding the cost of the evaluation/rehabilitation programme.
The UK National Health Service currently collects no systematic data to identify patients in PDOC, so we have no accurate information on how many patients there are, where they are managed or what their outcomes are.
In the absence of more direct data, total FIM + FAM scores of < =31 and 32–35 respectively can be used to identify patients in vegetative and minimally conscious states.
Of the 365 or so patients admitted to specialist rehabilitation units per year, 43% emerge into consciousness leaving about 150 patients per year in PDOC states that are likely to be permanent.
Identifying those who emerge and providing timely rehabilitation generates cost-savings that pay for the entire PDOC evaluation/rehabilitation programme many times over.
Implications for rehabilitation
Introduction
As acute services get ever better at saving lives, more patients are surviving with catastrophic brain injury and present to rehabilitation services still in a prolonged disorder of consciousness (PDOC). Some of these individuals will remain in a vegetative or minimally conscious states (VS/MCS) while others emerge into full consciousness.
Although it has been estimated that there may be between 4,000 and 16,000 in VS, and approximately three times that in MCS [Citation1], the UK NHS currently collects no systematic data to identify patients in PDOC, so we have no accurate information on how many patients there are, where they are managed or what their outcomes are. The national clinical guidelines for PDOC [Citation2] have recommended the establishment of a clinical registry to provide more accurate data on incidence, and to monitor the progress of individual patients. In the meantime, however, it is pertinent to explore whether any information on prevalence and outcomes could be gained from existing data.
In England, while the majority of patients with mild-moderate brain injuries receive rehabilitation within their local non-specialist (Level 3) services, those with more complex rehabilitation needs may be referred to specialist Level 1 (tertiary regional) or Level 2 (local secondary) rehabilitation services. The national clinical guidelines recommend that all patients who remain in PDOC for >4 weeks should undergo specialist inpatient evaluation in centres with staff who are experienced in the assessment and management of PDOC. Specialist PDOC evaluation falls within the NHS England standard contract for specialist Level 1 rehabilitation services in England [Citation3], and there are a small number of designated Level 1 PDOC specialist services around the country. However, there is insufficient capacity to meet the demand and some patients are assessed in their local Level 2 services, while an unknown number of patients fail to access specialist rehabilitation of any sort and are transferred directly to nursing home care. No information is available for the latter group, but we do at least have data for the Level 1 and 2 services.
The UK Rehabilitation Outcomes Collaborative (UKROC) [Citation4] provides the national clinical database, systematically collating episode data on needs, inputs (interventions provided) and outcomes for specialist inpatient rehabilitation in England. Since 2013, registration with UKROC and reporting of the UKROC dataset is now mandated by NHS England under its standard contract for all Level 1 and 2 specialist inpatient rehabilitation units. In the US, the Traumatic Brain Injury Model Systems (TBIMS) national database [Citation5] provides the largest longitudinal dataset in the world for monitoring outcomes following traumatic brain injury. Analyses of this dataset have used the lowest possible total score on the Functional Independence Measure [Citation6] (FIM = 18) as a proxy for identifying patients in VS [Citation7]. The UKROC dataset routinely collects the UK FIM + FAM [Citation8] (an extended version of the FIM) as its primary outcome measure. This provides an opportunity to take a similar approach with the UK national dataset.
Aims and objectives
In this analysis, we firstly explore whether total UK FIM + FAM scores can be used as a proxy measure to identify patients in VS/MCS and, if so, with what cut-off points. We then use this information to examine the number of PDOC patients admitted to specialist rehabilitation Level 1 and 2 rehabilitation units nationally and to examine their outcomes, including costs and potential cost-savings.
Methods
Design and setting
The design of this study is split into two parts.
Part 1 was a retrospective analysis of a prospectively-collected consecutive clinical cohort presenting to a single UK specialist PDOC evaluation programme between 2007–2021. In this centre, records of detailed evaluation of the level of consciousness are routinely collected alongside the UKROC dataset.
Part 2 was a multicentre national cohort analysis of prospectively-collected clinical data from the national UKROC database. Participants were adults (aged 16 and over) in PDOC (as defined by FIM + FAM scores) who were admitted to a Level 1 or 2 specialist rehabilitation unit between 2011–2020.
Data source
Established in 2009 through funding from the UK National Institute for Health Research (NIHR) [Citation9], the UKROC database now provides the national commissioning dataset for NHS England as well as the national clinical registry for specialist rehabilitation in England. Episode data are collected by each provider and uploaded at monthly intervals to a secured NHS server held at Northwick Park Hospital, London. There are now >50,000 registered episodes. The dataset comprises socio-demographic and process data (waiting times, discharge destination etc) as well as clinical information on rehabilitation needs, inputs, outcomes and cost-efficiency. Full details may be found on the UKROC website https://www.kcl.ac.uk/cicelysaunders/research/studies/uk-roc.
Measures
The following measures are routinely collected as part of the mandated UKROC dataset. To maximise the consistency of application in clinical practice, staff from the Level 1 and 2 centres receive training in use of the UKROC tools as part of their induction to the UKROC registry. Training and update courses are run by accredited trainers at Northwick Park, where Part 1 of this study was conducted.
The UK Functional Assessment measure (UK FIM + FAM) is a global scale of motor, cognitive, communicative and psychosocial function, which forms the principal outcome measure within the UKROC dataset. It includes the 18-item FIM (version 4) and adds a further 12 items, mainly addressing psychosocial function, giving a total of 30 items (16 motor and 14 cognitive items). Each item is scored on a seven-point ordinal scale from 1 (total dependence) to 7 (complete independence), giving a total score range of 30–210. Further details are published elsewhere [Citation8,Citation10].
The Northwick Park Dependency Score (NPDS) is an ordinal scale of dependency on nursing staff time (number of helpers and time taken to assist with each task) designed to assess needs for care and nursing in clinical rehabilitation settings [Citation11]. It is shown to be a valid and reliable measure of needs for care and nursing in rehabilitation settings [Citation12]. It also translates via a computerised algorithm to Northwick Park Care Needs Assessment (NPCNA) [Citation13] which provides a generic assessment of care needs and their associated costs. A primary goal for rehabilitation is to improve independence, thereby reducing the cost of ongoing care in the community and demonstrating value for money. Cost efficiency of rehabilitation is routinely reported by UKROC as the time taken for savings in care costs to off-set the cost of the rehabilitation episode [Citation14,Citation15] and extrapolated to estimate the savings that may accrue during their lifetime.
Estimated life-time savings are calculated based on life-expectancy data published by the US Life-Expectancy project [Citation16,Citation17] adjusted for UK mortality figures [Citation18]. In brief, impaired swallow and mobility are the strongest predictors of mortality in patients with acquired brain injury. The Life Expectancy group calculates the remaining years of life for patients with traumatic and other acquired brain injuries by adjusting the life expectancy of the normal population in 4 groups based on their FIM scores for “Eating” and “Walking”. For example, a male who has reached the age of 40 who “is unable to walk and is fed by others” (FIM Walking score 1–5 and FIM Eating score 1–3), has an average life expectancy that is 37% of the normal population according to data from the US TBIMS database. Allowing for projected changes in mortality according to the Office of National Statistics [Citation19], a 45-year-old man in the UK in 2020 has a mean further cohort life expectancy of 44.8 years, of which 37% would be 16.6 years. Even if it takes 6 years for savings in the cost of care to offset the initial cost of an episode of rehabilitation, there are still 10 years or more in which to recoup net lifetime savings. Estimated net life-time savings are computed individually case-by-case within the UKROC dataset using this methodology.
Diagnosis of level of consciousness
The National Clinical Guidelines for PDOC [Citation2] define three levels of consciousness.
Patients in vegetative states (VS) are awake but unaware of themselves or their surroundings, showing spontaneous and reflex responses only.
Patients in a minimally conscious state (MCS) have inconsistent (but reproducible) localising or discriminative responses, indicating some awareness of their surroundings.
Patients who have emerged into consciousness demonstrate consistent functional use of objects or communication, although they may still have profound physical, cognitive and communicative disability.
MCS represents a broad range of responsiveness and more recently it has been subdivided into categories of MCS-minus (showing localising visual pursuit responses only, e.g., eye-tracking) and MCS-plus (showing higher-level functional responses, but still inconsistently) [Citation20]. In accordance with the national guidelines, these different levels of consciousness are diagnosed through detailed clinical evaluation by staff who are familiar with PDOC and by serial application of at least one validated tool: the Coma Recovery Scale – Revised (CRS-R) [Citation21], the Wessex Head Injury Matrix (WHIM) or the Sensory Modality Assessment and Rehabilitation Technique (SMART) [Citation22].
Data handling and analysis
Part 1 comprised an analysis of routinely-collected clinical data from within the single-centre specialist PDOC evaluation programme. The UK FIM + FAM is recorded by the clinical team on admission and discharge from the programme as part of the mandated UKROC dataset. A combination of detailed clinical evaluation and serial CRS-R and/or WHIM data are used to determine the definitive level of consciousness (VS, MCS or emerged into consciousness) at the end of the programme, diagnosed according to the criteria set out in the National PDOC Guidelines [Citation2]. The data are collated in a dedicated electronic database built on Microsoft Excel.
Data were extracted for all patients admitted to the unit’s PDOC evaluation programme between 1.1.2007 and 1.6.2021 and collated with their data from the UKROC database. Patients were included in the analysis dataset if they had both a definitive diagnosis of their PDOC status at the end of the programme and a discharge UK FIM + FAM score. We analysed the discharge UK Total FIM + FAM scores recorded for patients, grouped by their definitive PDOC diagnosis at the end of the programme, to determine the FIM + FAM score ranges that were compatible with the three different levels of consciousness. Between-group differences were examined using non-parametric statistics (Mann Whitney) due to the small numbers in some groups. The area under a receiver operating characteristic (ROC) curve and sensitivity analyses were used to define optimal cut-off points in total UK FIM + FAM for “remaining in MCS” versus “emerged into consciousness”.
In Part 2, we then used these cut-off points as a proxy to identify patients admitted in “PDOC” within the national multi-centre cohort and their PDOC status at discharge from the programme. Data were extracted from the UKROC dataset for adults (16+ years) admitted to a Level 1 or 2 service between April 2011 and July 2020 with a Total FIM + FAM score ≤35. The cohort analysis describes the yearly rates of admission, mean time since injury, length of stay and outcomes – including where they are discharged to, and their level of dependency and care needs on discharge. We also examine functional gain and cost-efficiency, using the methods described above.
Study size
In this non-interventional observational study, size was not pre-determined, but dictated by the accruals to the national dataset that met the inclusion criteria over the 7-year period.
Missing data
Because data reporting was voluntary during the early years of data collection, missing data were expected. No data were imputed.
In this analysis, descriptive analyses included means with 95% confidence intervals (bootstrapped in samples of 1000 to allow for skewed data and/or small numbers) for interval or “long ordinal” data (i.e., scales with many possible datapoints, such as the Total FIM + FAM (score range from 30–210)). Change scores were tested with paired T tests. Median and interquartile ranges (25–75th percentiles) are given for “short ordinal” (scales with few data points, such as FIM + FAM item scores (score range 1–7)). All analyses were conducted using the IBM Statistical Package for Social Sciences (SPSS) version 26.
Results
Part 1
A total of 388 patients were admitted to the single centre PDOC evaluation programme of which 312 (80%) had both a definitive diagnosis of their PDOC status at the end of the programme and a discharge UK FIM + FAM score. Demographics are shown in for the overall group and split by their PDOC status at discharge for those who survived (14 patients died). There were approximately 3:2 males to females and their mean age was 45 years. On average they were admitted 4–5 months after the onset of brain injury and the length of stay on the unit was 3–4 months (so that the large majority were over 6 months post injury by the time the PDOC diagnosis was made). There was little difference between the groups apart from aetiology – as expected, hypoxic brain injury was predominant in the group who remained in VS. Those who emerged stayed longer in specialist rehabilitation, as they transitioned to an active restorative rehabilitation programme.
Table 1. Demographics for the overall group and split by PDOC status at the end of the programme (Part 1).
On admission, based on initial clinical assessment, 86 (28%) were thought to be in VS, 132 (42%) in MCS and 94 (30%) were not specified (recorded as in “PDOC” or “low-awareness state”). Patients remained in the programme for a mean of 102 days, during which they underwent formal evaluation according to the national guidelines as described above in combination with an individualised sensory stimulation programme and rehabilitation as appropriate. In addition to detailed clinical assessment, all patients were assessed with at least one validated tool. All patients had at least one WHIM score, 201 (65%) had at least one CRS-R and 44 (14%) had a SMART. By discharge, 86 (27%) had emerged, 124 (40%) were in MCS, and 88 (28%) were still in VS/Coma. Of those in MCS, 38 (12%) were designated MCS- Minus, 24 (8%) MCS-Plus and 63 were not sub-categorised, as MCS-Plus and MCS-Minus had not yet been defined at the start of the study and so were only recorded routinely during the latter phase of this cohort.
shows the Total FIM + FAM scores by PDOC status at discharge. Median (IQR) FIM + FAM scores were 30 (30–31) for patients remaining in PDOC and 56 (44–77) for those who emerged (p < 0.001). shows the ROC curve illustrating the trade-off between sensitivity and specificity for the various cut-off points of the Total FIM + FAM on discharge for identifying patients who emerged into consciousness versus those in continued MCS. The area under a ROC curve (AUC) was 0.910. The optimum threshold score was 35/36, which identified patients who emerged with 87% sensitivity and 88% specificity.
Figure 1. Shows the receiver operating characteristic (ROC) curve illustrating the trade-off between sensitivity and specificity to define the optimal cut-off point in Total UK FIM + FAM score for “remaining in MCS” versus “emerged into consciousness”. The area under the curve was 0.910, and the optimum cut-off value was 35/36, which identified those who emerged with 87% sensitivity and 88% specificity.
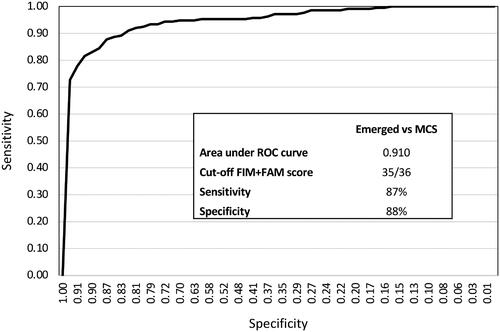
Table 2. Total FIM + FAM scores by PDOC status at discharge (Part 1).
also shows the average FIM + FAM score ranges for the different subgroups of VS/MCS, where these were recorded. Patient numbers were too small to construct a ROC curve to identify a cut off between MCS-plus and MCS-Minus. However, the distribution of scores within each sub-group provides some indication of the FIM + FAM scores compatible with each level (see ). Overall, patients in MCS had significantly higher FIM + FAM scores than those in VS (Mann Whitney z-5.3 p < 0001). There was no significant difference between FIM + FAM scores for patients in MCS-Minus and VS (Median 30 (IQR 30–30) for both groups: Mann Whitney z −0.7, p = 0.477), but patients in MCS-Plus had significantly higher scores (Median 31 (IQR 30–36), than those in MCS-Minus (Mann Whitney z −3.3, p = 0.001). Within the VS/MCS-Minus group, 99% had Total FIM + FAM scores ≤31, while within the MCS-Plus group, 71% had scores ≤31 and 29% had scores between 32–35.
Taken together, these findings suggested that UK FIM + FAM can provide an acceptable proxy for identifying patients in PDOC. Total UK FIM + FAM scores of ≤31 may be taken to represent patients in lower levels of consciousness (VS and MCS-Minus), while scores of 32–35 may be compatible with MCS-Plus. A cut-off score of 35/36 was considered to provide a reasonably robust separation of PDOC versus emerged into consciousness for the purpose of further evaluations.
Part 2
The second part of the study analysed outcomes for the patients presenting in PDOC to the Level 1 and 2 units in England. For the purpose of this analysis, patents with Total FIM + FAM scores of ≤31 were categorised as “VS/MCS-Minus” and those with scores of 32–35, were categorised as MCS-Plus. There were 25,790 registered episodes for adults (age 16-Plus) admitted to Level 1 and 2 specialist rehabilitation units following acquired brain injury between April 2011 and July 2020. A total of 2384 had an admission Total FIM + FAM score of ≤35, of which 2278 (96%) had a complete FIM + FAM score recorded (by which to estimate their PDOC status) at discharge.
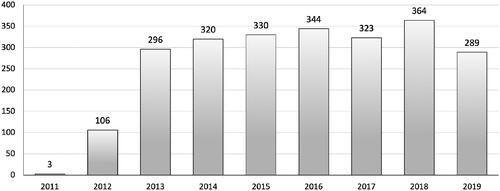
illustrates the number of these admissions by completed financial year. There was a marked increase in admissions following publication of the first edition of the national PDOC guidelines in 2013, which also coincided with the start of the NHS England standard contract and mandated data reporting. The number of admissions has slowly increased (but dropped off in 2019/20 as a result of the COVID-19 pandemic which affected elective admissions in the last quarter of the year). The number of centres taking more than 10 patients per year rose from 7 in 2013 to 11 by 2017. Between them, 17 Level 1 services admitted nearly three-quarters of the patients (1734 (73%) while the remaining 650 patients (27%) were admitted to the 51 Level 2 units. Over half the patients (58%) were managed in just seven tertiary services in London (2 centres), Warwick, Manchester, Newcastle, Birmingham and Leicester.
Figure 2. Shows a breakdown by year of the number of patients to specialist Level 1 and 2 rehabilitation units in England: Patients with FAM + FAM scores ≤35 on admission (meeting the criteria for PDOC).
On admission nearly three-quarters of the patients (1759 (74%)) were in VS/MCS-minus, while 625 (26%) were in MCS-Plus, according to their admission FIM + FAM scores. By discharge, 988 (41%) remained in VS/MCS-minus; 258 (11%) were in MCS-Plus, while 1032 (43%) had emerged into consciousness. The demographics for this population are shown in . Once again they are split by PDOC status at discharge. The average age of this population was around 50 years. The mean time since onset was about 6 months and the average length of stay was 4–5 months, so that by discharge they were approaching 1 year since onset. The large majority were admitted from acute hospital wards. Approximately 80% of them went on to further residential or inpatient care. About 20% of those who emerged were discharged home, but 30% of them still required nursing home/residential care. As may be expected, home discharge rates were lower for those who remained in PDOC.
Table 3. Demographics for the overall group and split by PDOC status at the end of the programme (Part 2 – National Cohort).
shows the mean dependency and care costs on admission and discharge for the overall cohort and groups split by PDOC status at discharge. Although patients who remained in VS/MCS-Minus or MCS-Plus showed some changes that reached statistical significance, these were too small to be significant clinically. The only clinically-significant changes were in the group that emerged.
Table 4. Dependency and care costs on admission and discharge split by PDOC status at the end of the programme (Part 2 – National Cohort).
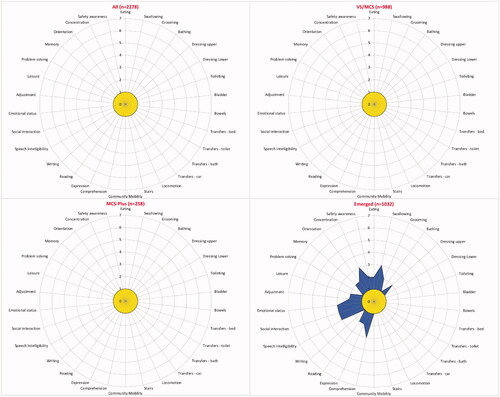
shows box and whiskers plots of the median FIM + FAM motor and cognitive subscales. Although a small handful of those who emerged achieved full or near-full independence, the large majority remained in the lower third of the scale. shows “FAM-splats” (radar charts) for the median item-level FIM + FAM scores overall, and for the three groups of patients. (Data available on request). Median scores for all items remained at 1 (total dependence) for all the groups who remained in PDOC. The patients who emerged made clinically significant changes in most areas, except for continence and mobility. However, the maximum median item score for any item was 3/7, indicating that the majority continued to have very severe global (physical, cognitive and communicative) disability.
Figure 3. Shows box and whiskers plot of the Total FIM + FAM scores on discharge for the three groups of patients: MS/MCS-minus, MCS-Plus and Emerged. (X marks the mean). Patients who remain in PDOC showed little variation in the Total FIM + FAM score. Those who emerged showed a wide range of scores (some even achieving full or near-full independence), but the majority of patients still had scores in the lower range of the scale indicating severe physical cognitive and communicative disability.
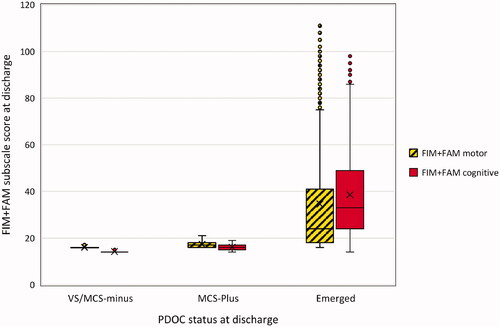
Figure 4. The radar chart (or “FAM-splat”) provides a graphic representation of the disability profile from the FIM + FAM data. The 30-scale items are arranged as spokes of a wheel. Scoring levels from 1 (total dependence) to 7 (total independence) run from the centre outwards. Thus a perfect score would be demonstrated as a large circle. This composite radar chart illustrates the median scores on admission and discharge. The yellow-shaded (lighter) portion represents the median score on admission for each item. The blue-shaded (darker) area represents the change in median score from admission to discharge.
summarises the cost-efficiency of admission in terms of the time take for the cost of the episode to be offset by savings in the ongoing care costs. This amounted to approximately 6–7 years for all groups. As may be expected, patients who remained in PDOC generated only small savings in the cost of care, which did not offset the costs of rehabilitation during their lifetime. However, those who emerged generated mean net life-time savings of over £436,609 (95%CI 339,267, 536,512) per patient. This effectively compensated for the net losses, to place the overall sample in a mean net positive balance of £167,774 per patient (amounting to £399,973,216 for this cohort of 2384 patients).
Table 5. Cost efficiency of admission, overall and by PDOC status at discharge (Part 2 – National Cohort).
Discussion
The findings from this study demonstrate that UK FIM + FAM total scores can reasonably be used as a proxy for identifying patients in prolonged disorders of consciousness (PDOC) at a population level. Scores ≤31 broadly identified patients in VS or MCS-Minus, while scores of 32–35 were compatible with MCS-Plus. A threshold score of 35/36 identified patients who emerged into consciousness with 87% sensitivity an 88% specificity. These cut-off points were then used to explore the national clinical dataset to examine the outcomes for those patients admitted to specialist Level 1 and 2 rehabilitation centres across England.
This study gives us, for the first time, some insight into the number of patients coming through the specialist rehabilitation services in PDOC. There has been a slow trend towards increasing numbers (a 23% rise since 2013 when systematic data collection started). This may partly reflect the fact that more patients are surviving with catastrophic injuries, but also that more centres are managing PDOC as part of their NHS England contracted service. Unfortunately, this probably still represents only a small proportion of the total number of PDOC patients in the country (see below).
However, 68 Level 1 and 2 services in England now admit approximately 365 PDOC patients per year between them (except during the COVID-19 pandemic). Three-quarters of the patients started in the lower levels of consciousness (VS/MCS-minus). By discharge, 43% had emerged into consciousness, but over half remained in PDOC (79% of whom were in VS/MCS-minus). As the average time from onset to discharge was approximately 11 months, it is likely that this latter group (comprising 41% of the cohort or about 150 patients per year) would remain permanently in PDOC.
Patients who emerged into consciousness demonstrated a wide range of disability. Although a few reached full independence, the majority still remained severely dependent (on average requiring two carers for most of their care needs) so that only 20% were able to be discharged home − 30% were discharged to long-term care in a nursing home.
All groups generated a small saving in annual care costs, but in the case of those remaining in PDOC this would not have offset the cost of the episode within their life-time. However, despite their continued severe disability as described above, those who emerged still generated mean net life-time savings of over £436 K per patients which effectively compensated for the net losses in other groups, to place the overall sample in a mean net positive balance of £167,774 per patient, amounting to just under £400 million for this cohort alone.
The authors acknowledge a number of strengths and weakness of this analysis. Strengths are that the systematic prospective collection of data in the course of routine care is reflective of real-life clinical practice. Importantly, the cohort (n = 2384) from which this sample was drawn comprises the entire national population of patients with severe acquired brain injury who were admitted to specialist Level 1 and 2 rehabilitation units in England during the data collection period. This supports the generalisabilty of our findings across this patient group and the estimation of life-time savings on a UK population basis, which also resonate with those from other studies [Citation15,Citation18,Citation23].
Weaknesses include the following:
Firstly and most obviously, the FIM + FAM was not designed to identify patients in PDOC. Although the threshold score of 35/36 identified patients who remained in PDOC versus those who emerged with acceptable accuracy in our preliminary analysis, this means that some 12–13% of the patients who were in PDOC may not have been included, and a similar proportion of patients may have been included who were not in PDOC (despite having similarly profound physical, cognitive and communicative disability – such as, for example, patients who are conscious but “locked in”). This overlap is not surprising as, in practice, vegetative and minimally conscious states represent a spectrum of consciousness rather than discrete groups. Therefore, while the FIM + FAM may be used as a proxy to identify patients in PDOC at population level, it does not replace the need for detailed evaluation of consciousness for diagnosis of PDOC status in individual patients, especially to distinguish the different levels of VS, MCS-Minus and MCS-Plus.
As this is a cohort study, there is no control group, but outcomes for the whole ABI group have already been reported elsewhere for comparison [Citation15].
This study evaluated outcomes only for those patients admitted to the Level 1 and 2 units and may not be generalisable to PDOC patients managed outside of these services, for example in Level 3 services or in nursing homes.
The calculations relating to estimated life-time savings in the cost of care rely in on two assumptions. Firstly that, if patients had not been admitted, their level of care needs would remain the same as on admission, and the second that they remain stable or continue to improve after discharge. The justification for this assumption has been discussed elsewhere [Citation18]. In addition, the computation does not include any discounting rates to account for what future cost savings might be worth in the present. The life-time savings should therefore be considered only as a broad estimate.
Demonstrating the cost-efficiency of rehabilitation provides a strong case to support investment in services. However, the strength of that case has, until now, been diluted by the fact that rehabilitation in the UK is paid for by the NHS Health Budget, whereas savings in the cost of care accrue to Social Care Services. However, imminent changes outlined in the NHS Long Term plan, 2019 [Citation24] are creating integrated care systems (ICSs) with joined up service provision and shared budgets for health and social care. This should make it easier to realise the cost-benefits of investing in appropriate rehabilitation services for this profoundly disabled group of patients.
The national clinical guidelines recommend the establishment of a national clinical registry linked to UKROC to identify and follow patients in PDOC. Until this is in place and reporting is mandated, we will not have any accurate data on the number of patients or their longer-term outcomes. Notwithstanding the above weaknesses, this paper provides the best information we currently have available on the numbers of patients admitted to Level 1 and 2 rehabilitation centres in England for specialist evaluation and managed for a prolonged disorder of consciousness. In reality, this is likely to represent only a small proportion of the total number of patients who present in this condition, as many times more are thought to be discharged direct to long term nursing home care without proper assessment or rehabilitation. From the findings presented here, it is likely that this represents an important missed opportunity, not only to maximise the recovery of those patients who have the potential to gain from rehabilitation, but also so to reap the financial benefits to society of investment in timely intervention.
This study from the UK demonstrates the potential for a global measure of disability to be used as a proxy at population level to identify patients who are likely to be in PDOC; and to interrogate large datasets to explore outcomes for this group, for whom outcomes are generally poorly understood. The same approach could have international applicability in other countries and health systems that collect large databases incorporating measures of disability for patients with acquired brain injuries. It also highlights the value of routinely collecting economic data (for example costs and cost savings) alongside standard functional outcome measures such as the FIM and/or FAM.
Ethics approval
Collection and reporting of the UKROC dataset is a commissioning requirement according to the NHSE service specification for Level 1 and 2 Rehabilitation Services. According to the UK Health Research Authority, the publication of research findings from de-identified data gathered in the course of routine clinical practice does not require research ethics permission.
Registration: The original UKROC development programme 2008–2015 was registered with the NIHR Comprehensive Local Research Network: ID number 6352
Author contributions
Lynne Turner-Stokes leads the development of the UKROC register and dataset. She took the lead role in planning, design, execution and governance of the study. She undertook the analysis and had overall responsibility for study reporting and drafting of the manuscript. Hilary Rose and Alison Knight oversee the clinical PDOC evaluation programme on the Regional Rehabilitation Unit at Northwick Park Hospital, and are responsible for accurate recording and collating of clinical findings within the programme. Heather Williams is responsible for maintenance and analysis of the clinical database on the Regional Rehabilitation Unit at Northwick Park Hospital and for the validation and extraction of data. Stephen Ashford and Richard Siegert contributed to the design of the study and interpretation of data. All authors contributed to writing the article, and to reviewing and commenting on the manuscript. All authors approved the final submitted version.
STROBE checklist for part 2 (national cohort analysis)
Please see attached as Supplementary File.
Acknowledgements
The authors are grateful to the patients and clinical teams who submit data to UKROC from all the Level 1 and 2 services. Special thanks are due to the dedicated staff at the Regional Hyperacute Rehabilitation Unit at Northwick Park Hospital who provide the PDOC evaluation programme. The authors thank the UKROC research team (Margaret Kaminska, Keith Sephton and Alan Bill) for their support with managing the database, data extraction and preparation for analysis.
Disclosure statement
There are no significant conflicts of interest. Outcome measurement is a specific research interest of our centre. Lynne Turner-Stokes is Director of UKROC and was the lead developer of the NPDS, NPCNA and the UK FIM + FAM, but neither she nor her employing institution has any financial interest in the tools which are disseminated free of charge. None of the authors has any personal financial interests in the work undertaken or the findings reported. All authors are employed by Northwick Park Hospital, King’s College London or Auckland University of Technology, which may cite this article as part of their research evaluation processes (e.g., the UK Research Excellence Framework). Professor Turner-Stokes has received financial support from the NIHR to attend conferences to disseminate the findings from the UK programme. We do not consider that any of these relationships or activities have influenced the submitted work.
Data availability statement
As the UKROC dataset is a live clinical dataset, for reasons of confidentiality and data protection data sharing is not available at the current time.
Additional information
Funding
References
- Bunn S, Fritz Z. Vegetative and Minimally Conscious States. POSTnote [serial on the internet]. 2015. Available from: https://post.parliament.uk/research-briefings/post-pn-489/
- Prolonged disorders of consciousness: national clinical guidelines (Updated 2020). London: Royal College of Physicians; 2020. Available from: https://www.rcplondon.ac.uk/guidelines-policy/prolonged-disorders-consciousness-following-sudden-onset-brain-injury-national-clinical-guidelines
- NHS standard contract for specialist rehabilitation for patients with highly complex needs (all ages): D02. NHS England National Programmes of Care 2013; 2014. Available from: http://www.england.nhs.uk/wp-content/uploads/2014/04/d02-rehab-pat-high-needs-0414.pdf
- UKROC: UK rehabilitation outcomes collaborative. 2010. Available from: https://www.kcl.ac.uk/cicelysaunders/research/studies/uk-roc
- Hammond FM, Malec JF. The traumatic brain injury model systems: a longitudinal database, research, collaboration and knowledge translation. Eur J Phys Rehabil Med. 2010;46(4):545–548.
- Heinemann AW, Linacre JM, Wright BD, et al. Relationships between impairment and physical disability as measured by the functional independence measure. Arch Phys Med Rehabil. 1993;74(6):566–573.
- Stineman MG, Shea JA, Jette A, et al. The functional independence measure: tests of scaling assumptions, structure, and reliability across 20 diverse impairment categories. Arch Phys Med Rehabil. 1996;77(11):1101–1108.
- Turner-Stokes L, Nyein K, Turner-Stokes T, et al. The UK FIM + FAM: development and evaluation. Clin Rehabil. 1999;13(4):277–287.
- Cost-efficient service provision in neurorehabilitation: defining needs, costs and outcomes for people with Long term neurological conditions (RP-PG-0407-10185). Lead applicant: Professor lynne Turner-Stokes. Northwick park hospital. London: National Institute for Health Research Programme Grant for Applied Research; 2008. Available from: https://www.kcl.ac.uk/cicelysaunders/research/studies/uk-roc/index
- Turner-Stokes L, Siegert RJ. A comprehensive psychometric evaluation of the UK FIM + FAM. Disabil Rehabil. 2013;35(22):1885–1895.
- Turner-Stokes L, Tonge P, Nyein K, et al. The northwick park dependency score (NPDS): a measure of nursing dependency in rehabilitation. Clin Rehabil. 1998;12(4):304–318.
- Siegert RJ, Turner-Stokes L. Psychometric evaluation of the northwick park dependency scale. J Rehabil Med. 2010;42(10):936–943.
- Turner-Stokes L, Nyein K, Halliwell D. The northwick park care needs assessment (NPCNA): a directly costable outcome measure in rehabilitation. Clin Rehabil. 1999;13(3):253–267.
- Turner-Stokes L, Paul S, Williams H. Efficiency of specialist rehabilitation in reducing dependency and costs of continuing care for adults with complex acquired brain injuries. J Neurol Neurosurg Psychiatr. 2006;77(5):634–639.
- Turner-Stokes L, Williams H, Bill A, et al. Cost-efficiency of specialist inpatient rehabilitation for working-aged adults with complex neurological disabilities: a multicentre cohort analysis of a national clinical data set. BMJ Open. 2016;6(2):e010238.
- Brooks JC, Shavelle RM, Strauss DJ, et al. Long-Term survival after traumatic brain injury part II: Life expectancy. Arch Phys Med Rehabil. 2015;96(6):1000–1005.
- Shavelle RM, Strauss DJ, Day SM, et al. Life expectancy. In: Zasler D Katz ND, Zafonte R, editors. Brain injury medicine: Principles and practice. New York: Demos Medical Publishing; 2007.
- Turner-Stokes L, Dzingina M, Shavelle R, et al. Estimated Life-Time savings in the cost of ongoing care following specialist rehabilitation for severe traumatic brain injury in the United Kingdom. J Head Trauma Rehabil. 2019;34(4):205–214.
- 2018-based period and cohort life expectancy tables. Office of National Statistics. 2019. Available from: https://www.ons.gov.uk/peoplepopulationandcommunity/birthsdeathsandmarriages/lifeexpectancies/datasets/lifetablesprincipalprojectionunitedkingdom
- Bruno MA, Majerus S, Boly M, et al. Functional neuroanatomy underlying the clinical subcategorization of minimally conscious state patients. J Neurol. 2012;259(6):1087–1098.
- Giacino JT, Kalmar K, Whyte J. The JFK coma recovery Scale-Revised: measurement characteristics and diagnostic utility. Arch Phys Med Rehabil. 2004;85(12):2020–2029.
- Gill-Thwaites H, Munday R. The sensory modality assessment and rehabilitation technique (SMART): a valid and reliable assessment for vegetative state and minimally conscious state patients. Brain Inj. 2004;18(12):1255–1269.
- Turner-Stokes L, Bavikatte G, Williams H, et al. Cost-efficiency of specialist hyperacute in-patient rehabilitation services for medically unstable patients with complex rehabilitation needs: a prospective cohort analysis. BMJ Open. 2016;6(9):e012112.
- The NHS long term plan. 2019. Available from: https://www.longtermplan.nhs.uk/publication/nhs-long-term-plan/