
ABSTRACT
In this paper, we examine whether early warning signals from accounting courses (such as early engagement and early formative performance) are predictive of first-year progression outcomes, and whether this data is more predictive than personal data (such as gender and prior achievement). Using a machine learning approach, results from a sample of 609 first-year students from a continental European university show that early warnings from accounting courses are strongly predictive of first-year progression, and more so than data available at the start of the first year. In addition, the further the student is along their journey of the first undergraduate year, the more predictive the accounting engagement and performance data becomes for the prediction of programme progression outcomes. Our study contributes to the study of early warning signals for dropout through machine learning in accounting education, suggests implications for accounting educators, and provides useful pointers for further research in this area.
Introduction
First-year university progression is in some countries, notably those in continental Europe, an acute concern as up to 50–60% of students can drop out in the first year (Arias Ortiz & Dehon, Citation2013). This high dropout rate is partly a consequence of the institutional and regulatory setting in which European universities operate. In particular, many continental European universities do not require entrance exams to be admitted to university programmes such as (business) economics (Broos et al. Citation2020), as they operate a government-mandated ‘open gate’ admission policy. Therefore, the prediction of first-year university progression, in order to assess the possible dropout-rate, is important for several reasons. First, the earlier the university knows which students are at risk of dropping out, the longer the window of opportunity to remedy the situation (Wakelam et al., Citation2020). Instructors may use a range of remedial or corrective strategies to interact with at-risk students and provide them assistance to enhance their learning process (Chen et al. Citation2021). Second, high dropout rates may have financial consequences as some universities are funded by their governments on the basis of number of students graduating. Such ‘no graduation, no pay’ funding regimes promote selection ‘after’ the gate, with policies such as compulsory academic dismissal after non-performance in the first year (Sneyers & De Witte, Citation2017). Third, information about dropout is perhaps of most value for the students themselves. It is a profoundly negative experience when students drop out, they may suffer personal stress and trauma as a result, and face financial consequences and potential impact on families (Wakelam et al., Citation2020). Consequently, dropout is an important topic on the agenda of many universities.
Students entering the university embark on a journey in their first undergraduate year, with several possible destinations at the end. Broadly defined, we can identify three types of first-year university progression outcomes: students may (a) drop-out and leave the university at the end of the first year, (b) fail for some courses and decide to stay to repeat these courses, and (c) pass all courses and proceed to the next year. Several data points become available during their journey, including midterm test scores, exam scores on first semester courses, exam scores on second semester courses, and retake exam scores.
An area of longstanding interest is the role of accounting courses in the first-year business economics curriculum (e.g. Bence & Lucas, Citation1996). The desired contents and structure of these introductory accounting courses have been subject of study for some time (Geiger & Ogilby, Citation2000; Saudagaran, Citation1996). Financial accounting is considered to be a challenging course by students (Jaijairam, Citation2012, Stewart & Dougherty, Citation1993) and some programmes have two consecutive accounting courses. Apart from providing students their first exposure to accounting, these accounting courses may have another valuable role: they may foreshadow the overall outcome of the student in their first year of university study. Accounting educators often pick-up valuable signals of early engagement and early performance in these introductory accounting courses. We call these signals of early engagement and early performance the early warning signals. We would intuitively expect that early signals in accounting education are a predictor of first-year outcomes (dropout, repeat, pass), and the extent to which this is the case is the focus of the current study. Therefore, the first research question of our study is to explore whether the early warning signals of a financial accounting course can predict the progression of first-year university students.
The literature on dropout at universities is extensive and mainly focuses on a set of variables that students ‘bring with them’ when entering the university. We call these sets of variables backpack data. They include demographic variables, such as gender and age (Araque et al., Citation2009; Murtaugh et al., Citation1999; Paver & Gammie, Citation2005) and variables capturing their intelligence or prior academic achievement (Duff, Citation2004). This data may or may not be shared by the students with the university, based on privacy regulations. Furthermore, if the open-gate admission system does not set restrictions in terms of the majors attended in secondary education, heterogeneity among the students is large. Therefore, the second research question of this study is to examine whether ‘early warning’ signals in accounting education can be more successful in predicting the progression for students in their first year of university study than the ‘backpack’ variables.
Predicting student outcomes remains understudied (Namoun & Alshanqiti, Citation2020), and recent technological advances such as learning analytics or artificial intelligence are increasingly being used to predict academic performance. Namoun & Alshanqiti (Citation2020) showed that models that predict student learning outcomes have been on the rise since 2017, with a significant proportion of articles published in computer science and information systems journals. In line with these recent advances, this paper uses machine learning to predict dropout in the first year. Recent literature shows that machine learning is a suitable approach to predict student dropout (Tomasevic et al., Citation2020). An advantage of machine learning is that some algorithms have the ability to show the relative predictive strength of each variable. This is an advantage because it allows university policy makers to focus on the most predictive variables. Machine learning has also been used to detect both at-risk and excellent students in the early stages of a course (Riestra-Gonzales et al., Citation2021).
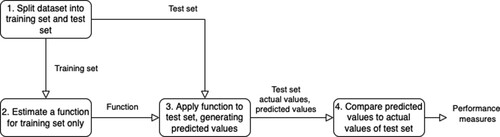
A supervised machine learning approach splits the sample in two parts: one is used for training the algorithm (the training set) and the other part is used to test the predictive power of the algorithm (the test set). In this paper, we apply the random forest algorithm to the training set to generate the predictive classification function. We then apply this function to the test set to evaluate its performance. The third research question of this paper is to explore whether a machine learning approach can be used effectively to predict student progression in the first year.
In summary, to explore the predictive value of early warning signals in accounting education on first-year university outcome, we study three research questions:
To what extent can ‘early warning’ signals in accounting education help to predict progression of first-year university students?
Are ‘early warning’ signals in accounting education better able to predict progression than more general ‘backpack’ data?
Can a machine learning approach be used effectively to classify outcomes using both backpack and ‘early warning’ signals in accounting education?
Contributions
The current study predicts student journeys throughout their first year, based on so-called backpack variables and early warning signals from accounting courses (tests and accounting exams). This study has three important contributions. First, this paper is one of the first papers in accounting education that employs machine learning to predict dropout. Second, unlike other studies that used machine learning to predict learning outcomes (e.g. Tsiakmaki et al., Citation2020), the current study focuses on the outcome of the entire first year in a business economics programme, as opposed to one single course. We also includes the three categories that are important from the students’ perspective, i.e. dropout (leave the university), repeat year (repeat one or more courses) or pass (credit for all courses), instead of using a dichotomous (pass/fail) outcome variable. Third, this study combines several variables to predict outcome, i.e. backpack variables (characteristics of the student entering the university) and early warnings from accounting education (which includes academic performance on tests and exams). By combining these variables, we are able to compare the predictive value of each group of predictors, an analysis that has not previously been done in the context of accounting education. We show how it is possible to provide information about the strength of the predictors at different ‘calling stations’ along the journey. The sooner faculty recognise at-risk students, the sooner the university will know which students are at risk of dropping out, and the more likely it is that the situation can be remedied.
‘Supervised machine learning and prediction of dependent variables’ section will provide information about machine learning. ‘Prior literature on predicting student performance’ section will review prior literature. ‘Methodology’ section describes the methodology, followed by a presentation of the results in ‘Results’ section. A discussion is provided in ‘Discussion and conclusion’ section. Finally, ‘Limitations and future research’ section gives an overview of the limitations, avenues for further research, and conclusions.
Supervised machine learning and prediction of dependent variables
Machine learning, an application of artificial intelligence, is widely used in a variety of application domains (Kucak et al., Citation2018). Relevant domains include university dropout (Lykourentzou et al., Citation2009) and student performance (Hämäläinen & Vinni, Citation2010). The number of published articles in the field of machine learning has surged since the last decade (Kolachalama & Garg, Citation2018), and it would be impossible to review them all here. The branch of machine learning relevant to our study is supervised learning, which enables algorithms to learn without explicitly programming functions (Samuel, Citation1959). In supervised learning, algorithmic models learn through a systematic study of training data, and they improve their performance on tasks through experience, as more training data becomes available (Mitchell, Citation1997).
Applying this approach to our domain of interest, a model learns and predict the outcomes of a first group of students (training set). At the end of the training process, a classification function is ready to use. This classification function is then used on a second group of students (the test set) to test the predictions produced by the function. visualises the steps of the machine learning approach.
Figure 1. Flowchart of the machine learning approach.
The out-of-sample prediction approach should be distinguished from a within-sample analysis (Bao et al., Citation2020). A within-sample approach does not focus on prediction of out-of-sample cases, but instead is primarily occupied with the relationship between independent and dependent variables. A technique such as regression analysis can be used in both approaches, either as the algorithm to connect independent and dependent variables in the within-sample approach, or to generate the prediction function in the out-of-sample approach (van der Heijden, Citation2023).
In this study, we use the random forest classification method (Breiman, Citation2001; Ho, Citation1995) to generate the classification function. This method iteratively constructs a number of decision trees (or ‘if–then statements’) to predict the output variable from a set of input variables. The parameters of the decision trees are iteratively fine-tuned using the training set of data, such that the final function contains a set of decision trees that best predict the outcomes from the sample.
To evaluate the efficacy of the out-of-sample prediction approach, different metrics are used, such as accuracy, precision and recall. A measure called precision is used to measure the percentage of false positives, and a measure called recall is used to measure the percentage of false negatives. F1 is the harmonic mean of precision and recall, and gives equal weighting to false positives and false negatives. A summary performance metric used to assess whether the function accurately classified the outcome is the F1 statistic (Geron, Citation2019). The F1 balances precision and recall, and takes into account two types of errors: false positives and false negatives.
Prior literature on predicting student performance
The study of dropout at universities is extensive, and dates back to the early 70s when lack of social and academic integration were identified as early causes of dropout (Tinto, Citation1975). The set of variables used to predict dropout are often those that are available at the start of academic study. They include demographic variables (such as gender and age), psychological variables (such as perceived confidence) and variables related to prior academic achievement. We will refer to these variables collectively as ‘backpack’ variables, in the sense that students carry these variables with them on the first day of the academic year. This group is in contrast to the ‘early warning’ variables in accounting education, which become available over time as the students progress through their first-year journey.
Before discussing these backpack variables in more detail, it is worth mentioning that dropout is just one of several types of student departure. Students can leave university education altogether, switch to another degree at the same university, or transfer to another university. Studies show that what sometimes is considered dropout is actually transfer to another university (Hovdhaugen, Citation2009). This is relevant in our study too, as there are several options for dropout at the end of the first year.
Backpack data
Gender
In terms of demographic variables, the study of gender has had mixed results. It has been found that male and female students leave university in the US for different reasons, with female students placing more emphasis on student dissatisfaction than male students (Bean, Citation1980). A UK study found that gender influenced the reasons for dropping out (Johnes, Citation1990), and a similar gender effect was found at a recent study in a Belgian university, with men more likely to dropout than women (Arias Ortiz & Dehon, Citation2013). Others suggest that a gender effect is hard to tease out and may be dependent on the stage in the student’s career (DesJardins et al., Citation1999).
The impact of gender on accounting education performance has been similarly mixed. Some studies did not generally find a significant relationship of gender with first-year academic performance (Byrne & Flood, Citation2008). Other studies show an influence of gender on surface versus deep learning, which in turn affects performance (Everaert et al. Citation2017).
Age
Age is another well-known and well-studied demographic variable. Students that are more mature have a higher chance of dropping out (DesJardins et al., Citation1999). Non-traditional students such as older and/or working students also have a higher chance of dropping out than traditional students (Carreira & Lopes, Citation2019).
Prior academic achievement
Another backpack variable is high school performance. As a proxy for ability, studies have consistently shown this to be a factor. Lower ability students dropout earlier than higher ability students (Bean, Citation1980; DesJardins et al., Citation1999). Prior studies have shown that high school performance is also a strong predictor of accounting performance (Byrne & Flood, Citation2008; Eskew & Faley, Citation1988). Similar to overall high school performance, having a strong mathematical profile during high school also reduces the probability of dropping out in the early years (Arias Ortiz & Dehon, Citation2013). This may be of special relevance to accounting, where the requirements for maths may not be complex, but are not trivial either. Studies show mixed results for actually studying accounting in high school (Baldwin & Howe, Citation1982).
Self confidence
Related to these variables are student’s expectations of university study and their perceived probability of success and graduation. Studies show that students with a lack of confidence in their skills and abilities have poorer academic performance in the first year (Byrne & Flood, Citation2008). Studies also show that students without clear educational goals may be more likely to depart (Tinto, Citation1988).
Early engagement
We now move on from backpack variables to variables that are collected in the early stages of university study, specifically in courses such as accounting. We will call these variables the ‘early engagement’ variables. The literature in this area is more fragmented than the backpack literature as the authors of these studies did not necessarily consolidate their contributions under the ‘early engagement’ umbrella term. We provide a number of examples of early engagement studies that we believe are relevant to our study.
One study looked at the role of frequency of Virtual Learning Environment logins and frequency of exercise completion in an IT course. The authors were able to predict pass rates of a course with an accuracy of 60.8% (Jokhan et al., Citation2019). This study is of interest because it looks both at early engagement (logging in) and early performance (exercise completion).
Class attendance in more general terms has also been studied and has been identified as a dropout factor, alongside general problems, such as low identification with being a ‘student’, and low achievement motivation (Georg, Citation2009). In an accounting setting more specifically, studies also looked at the impact of learning style (surface versus deep learning) and time spent by the student on academic performance (Everaert et al., Citation2017). Time spent during the course, and attendance of classes are all examples of early engagement with the course and wider university context. Furthermore, some instructors introduce intermediate test into their course, to provide early feedback on how the student is engaged with the course, especially in the early and middle stage of a course (Day et al., Citation2018).
Of note is one study which looked, among other things, at attendance of a freshmen orientation course (Murtaugh et al., Citation1999). This study found that those who attended the freshmen orientation course had a reduced risk of dropping out.
Early performance: exam scores of accounting courses
The final set of variables of relevance to this study are first-year examinations. These exams are taken in the early stages of the university career, and are often the students’ first ever accounting exams. Studies have shown that first-year examinations at university give much higher predictive value for non-graduation than high school performance (Johnes, Citation1990). As these scores are markedly different from other, ‘softer’ early engagement variables, we will treat these early exam scores separately in this paper.
We arrive then at a set of three groups of variables: backpack data (known at the start of the academic year), early engagement and performance (known in the early months), and early exam scores (known in the later months of the first year). We hypothesise variables in each of these groups to contribute to the prediction of the final outcome at the end of the year.
We have a number of expectations regarding the relative predictive value of each of the variable groups. First, intuition would suggest that the early warning variables in accounting education have incremental predictive value, over and above the backpack variables. Second, we would expect the highest predictive value to be generated by all three groups together, as by definition, it contains the most variance in the set. Third, we would expect the variables that are the latest in the year to be the most predictive, as they have the shortest window of opportunity to change the university progression.
The next section will discuss the details of our methodology and the setting in which our study took place.
Methodology
In this section, we will review the educational setting used in this study. We will also provide more information about the timeline of events that were included in the study. Next, we will offer information about the sample studied in this article. A description of the variables and the classification method concludes the section.
Setting
Many studies in accounting education are conducted in selective Anglo-Saxon institutions, where freshman students pass rigorous selection procedures based on academic and non-academic criteria (e.g. prior scores on national standardised exams, personal statements or selection interviews). In contrast, the current study was conducted at a large university in Belgium. The transition to higher education in Belgium does not require formal screening and, (apart from a high school diploma), it does not have admission criteria (Pinxten et al., Citation2019).Footnote1 In Belgium, higher education is completely publicly financed with negligible tuition fees (i.e. under 1000 euro per year at the time of writing) (Broos et al. Citation2020). Access to higher education is open, and there is no ‘selection at the gate’ procedure. As a consequence, there is a large degree of heterogeneity of incoming students in terms of prior knowledge, attitudes and skills (Pinxten et al., Citation2019). A substantial number of students enrol with a weak mathematical background. This issue is particularly challenging for business economics programmes given that mathematics and statistics are among the main courses of the first-year programme, alongside economics and accounting.
Our study was conducted with data from the freshman undergraduate year during the academic year 2018–2019. This is the last full pre-Covid-19 year. Students were enrolled for the first year in economics, business economics or commercial engineering. In the first year, no distinction is made between these programmes.Footnote2 In both the first and second semester, two financial accounting courses are scheduled, called Accounting A and Accounting B respectively.
Timeline of events in the first year
summarises all educational activities in accounting during the first year. Every year in September, a week before the start of the academic year, a pre-session for accounting is organised. For four days, voluntarily participating students follow an introductory accounting week. At the end of the pre-sessional accounting week, the academic year starts with a Welcome day and then the first semester starts with 12 weeks of classes. At the end of the semester, there is a study period of four weeks and then, the written exams (including Accounting A) take place over four weeks. Immediately following the exams, there is a one-week spring break, after which the second semester begins. During spring break, students receive their grades from the first semester. In February, the second semester begins. The second semester includes 12 weeks of classes and 4 weeks of study. There are final exams (including Accounting B) at the end of the second semester. For students who fail, there is a retake opportunity in August for both courses of the first (e.g. Accounting A) and second semester (e.g. Accounting B).
Figure 2. Timeline of the research design.
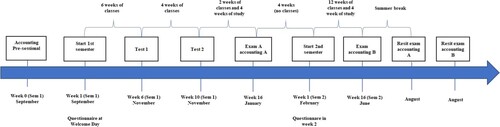
In this study, we take into account five measurement-moments during the academic year: (1) participation in the pre-sessional, (2) intermediate Test 1 for the course Accounting A after five weeks in the first semester, (3) intermediate Test 2 after nine weeks Accounting A in the first semester, (4) exam for the course Accounting A in January 2019, (5) exam for the course Accounting B in June 2019. Of course, student who pass do not attend the resit exams. Resit data is not included in this study because of endogeneity concerns, and because this data becomes available too late in the journey to be meaningful.
A pre-sessional on accounting is organised during the week prior to the academic year. Data on attendance at this pre-sessional was collected by the administration. Attendance at this pre-sessional is an indicator of early engagement and may predict students dropout, even at this early stage. The intermediate tests are taken respectively in the first and the last week of November. The tests are addressing the material covered in the preceding weeks. The tests are online and consist of both open and multiple-choice questions. Participation is voluntary, but rewarded with partial course credit, regardless of the accuracy of the answers. Specifically, students can earn 1 point out of the 20 on their exam upfront by completing the two tests. Students get four days per test to complete them at home and after each test feedback is given in a plenary session with the possibility of asking questions afterwards.
As summative assessments, all accounting exams consists of four extended exercises (2.5 hour of exam time) and 20 multiple-choice questions (1.25 hour of exam time). Both parts of the exam are organised back-to-back.
At the Welcome day, in the beginning of the first semester, a short survey was administered. We asked students about the number of hours in mathematics in the last year of high school. In addition, we also asked students about their perceived probability of success (How high do you estimate your own success rate for the first year at university?). Students had to choose one of the alternatives to this question: 0–30%; 31–50%; 51–70%; 71–85; 86–100; no idea. In the beginning of the second semester another survey was administered during official class time, providing data on the backpack variables. In this second survey, we asked students about their high school graduation percentage (What was your graduation percentage in your senior year of high school?). Students had the option to fill in their percentage or to check the box that they had forgotten or did not want to share. The questionnaires were administered during official class hours at the university. One of the authors was present during the collection process.
Data from different surveys, test results, and exam results were aggregated and combined using unique university student identifiers. All respondents gave their informed consent and their permission to link their results and data. Students were anonymous throughout, and data was processed confidentially and for research purposes only.
Sample
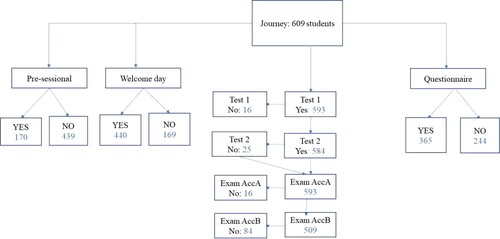
Our sample consists of 609 students who all commenced a study of business economics at a large Belgian university in the academic year 2018/2019 (see ). Students who had to retake the course and consequently were also enrolled in the previous year were removed from the source data, as this study aims to predict dropout of new first-year students. As a consequence only ‘new’ first-year students were included in the data. All students had two accounting courses in their first year of study (accounting A and B) for which a different number of students participated.
Figure 3. Flowchart of the sample.
Measurement of the variables: dependent variable
Our dependent variable in this study is first-year university progression. The first-year university progression is coded into three discrete values: dropout, repeat year, and pass. Dropout means that the student left the university. Repeat year means that the student did not quality for pass, but decided to take a repeat year, attending the courses with a mark less than 10 out of 20. Finally, pass means that the student qualified for progression (since they earned a credit for all courses). Of the 609 students, 192 students dropped out, 166 took up a repeat year, and 251 students progressed through to the second year.
Measurement of the variables: independent variables
To predict the first-year university outcome for every student, we use three groups of independent variables. The first group is a set of background variables, or ‘backpack’ variables. The second group is a set of early warning variables to do with early engagement and performance in accounting education. The third group contains the exam scores of the first two accounting exams in the first year.
The backpack variables that we were able to obtain in this study were gender, high school performance, hours of maths per week in high school, and perceived likelihood of graduation.
Gender was collected from the administration, coded as 0 for male and 1 for female.
High school final performance is measured as a percentage. This performance was self-reported by the students in the February survey. As this survey was voluntary, we were only able to record 365 datapoints.
Contact hours of maths per week in high school was a self-reported measure captured at the Welcome Day. The number of datapoints for this measure is 440 as not all students attended the Welcome Day.
Probability of success describes the perceived probability of success, administered as a 5-point categorical variable (0–30%, 31–50%, 51–70%, 71–85%, 86–100%), collected at the Welcome Day. This measure is included as a ‘backpack’ variable because conceptually it is also a data point that is inherent to the student before university education starts.
Age: The dataset only includes students who just finished secondary education (at 18 years of age). Older and/or working students are not present in the current dataset. Therefore this variable was excluded from the analysis.
The early engagement variables included in this study were attendance to the pre-sessional and the scores on the two intermediate tests.
Pre-sessional attendance is one of the earliest signals of engagement that can be captured. The pre-sessional was voluntary and open to all students, took part in the Summer of 2018, lasted four days, and dealt specifically with concepts also covered in the first accounting courses.
Test 1 and Test 2. Both tests took place in the middle of the first term. They were formative assessments, and were scored on a scale of 0–1.
The third group contains the exam scores of the financial accounting courses.
Exam scores were collected for both Accounting A (1st semester) and Accounting B (2nd semester) courses. We included here the earliest accounting exam scores (i.e. of January and of June) and leave out the resit exam data. The exam scores were scored on a scale of 0–20.
Classification methods
The next section will also cover the results of our classifications. As mentioned in the introductory section, we used a machine learning approach to classify the results. This approach follows procedures as described in Geron (Citation2019). The steps in this procedure first involve splitting the sample into a training and a test set. The training and test sets are stratified meaning that the percentages of the different outcomes are approximately the same in the training, the test and the total set. Given the relatively low sample size of our initial set, we used a split of 60/40 of the data. The more typically used 80/20 split (Geron, Citation2019) would generate a test set that would be too small to be credible. We then trained the classification algorithm on the training set (60% of the total set). This training leads to a classification function based on the independent variables. This function is then applied to the test set (40% of the data), and a measure is calculated on the basis of how many times the algorithm correctly classified an outcome in the test set.
The random forest algorithm (Breiman, Citation2001; Ho, Citation1995) was implemented using the SciKitLearn libraryFootnote3 (Pedregosa et al., Citation2011). The algorithm was used in this study with its default parameters. Experimenting with these default parameters (a process also known as hyper tuning), would potentially have led to better results, but would also have required another test set, as we would be optimising on the test set.
Results
We will start the results sections with an overview of the descriptive results. Next, we will discuss the three research questions, namely: (1) To what extent can early warning signals in accounting education help to predict progression of first-year university students? (2) Are early warning signals in accounting education better able to predict progression than more general ‘backpack’ data? (3) Can a machine learning approach be used effectively to classify outcomes using both backpack and early signals in accounting education?
Descriptives
In total 609 students are included in this study, 66% male and 34% female. As shown in , in total 41% passed all courses, 32% left the university (dropout) and 27% started a repeat year with one or more courses to repeat.
Table 1. Frequency table: outcome split by gender, probability of success and pre-sessional attendance.
Panel B of shows the perceived probability of success by outcome and offers some insights in the students’ ability to accurately assess their probability of success: 113 students who dropped out prematurely thought they were more likely to succeed than not (i.e. estimated their probability of success higher than 51%).
The descriptives of the continuous variables are shown in . It shows the mean, the variance and the number of students in each of the groups (A = Drop-out, B = Repeat Year and C = Pass). The high school performance is highest for the pass group (75%, rounded). The high school performance of the Repeat Year and Drop-out group is almost the same (70% rounded). Also, the contact hours of maths per week in high school shows the highest average number for the pass group (6.4), compared to 6.0 hours for the repeat year group and 5.7 hours for the drop-out group.
Table 2. Descriptives and group means depending on outcome (A = Drop-out, B = Repeat Year, C = Pass).
The second group of independent variables are all indicators of early engagement in accounting education specifically. They are pre-sessional attendance and two early test scores. Panel C of crosstabulates pre-sessional attendance by outcome. For students who attended the pre-sessional 47% passed, while for students who did not attend the pre-sessional only 39% passed. describes the mean scores, and their variance for Test 1 and Test 2. Both tests took place in the middle of the first term. They were formative assessments, and were scored on a scale of 0–1. Students who passed scored higher on both Test 1 and Test 2.
The third group of independent variables involve exam scores of the financial accounting courses. Exam A score is as the end of the first semester, Exam B score is at the end of the second semester. These exams were scored on a scale of 0–20 and show that the mean score for Exam A is higher for the students in the pass group (mean = 14.19), compared to students in the repeat year group (mean = 10.81). In addition, this last group scored higher than students in the drop-out group (mean = 8.72). A similar pattern is found for the mean score for Exam B (mean = 14.10 for pass, mean = 9.15 for repeat year, mean = 6.76 for drop-out). Of interest is the very low mean for the drop-out group for the Exam B score.
The next section will cover the results of the statistical tests that we performed on each individual variable, to examine if the independent variables are significantly different among the three groups with different university progression.
Univariate statistics
We first examine if any of the individual independent variables produces statistically significant different values for each of the three first-year university outcomes (drop-out, repeat year, pass). For the nominal independent variables we use a χ2 test (showing whether there is equal distribution of the values in the different groups), and for the metric variables we use an ANOVA test. presents the results of each test.
Table 3. Testing with χ2 and ANOVA if the three outcome groups have statistically different proportions (χ2) or levels (ANOVA) in the respective variables.
These tests provide a number of useful insights. The gender balance is not statistically significant in each of the groups. Also, the pre-sessional ratio is not statistically significant in each of the groups. As these variables are not statistically significant in the groups, it is not likely that they will have much value in predicting the group as a backpack or early warning sign, as will be discovered later on.
In contrast, all other values show promising significance across the outcome groups. Combining these results with the descriptive tables, we may start to picture the groups as follows. Those that dropout (Group A) have lower high school performance, have had fewer contact hours of maths in high school and perceive success to be less probable. In terms of accounting education, they also score lower on both tests and score lower for the two exams than the other groups. Contrary, students that pass (Group C) have higher high school performance, have had more contact hours of maths in high school and perceive success to be more probable. In terms of accounting education, they score higher on the tests and exams than the other groups. Group B falls between these two groups.
Machine learning results
We now report the classification results. summarises the results of six models. Each model is a different combination of the three type of variables that are collected along the journey (backpack, early engagement and exam scores). To provide a clear indication to which period the variables refer, the week numbers are indicated in the first column. For instance, model 0 only includes the backpack data, i.e. using the student characteristics in week 0. Model 1 only includes the early engagement data when the student entered the university, i.e. including information of the student, gather from weeks 1–6. Similarly, model 2 includes the early engagement data from weeks 1–9 (i.e. also including the scores on the second test, which means that the student is 4 weeks later along the journey than model 1). Model 3 includes the early engagement data, as well as the early accounting exam scores (i.e. collecting information from week 1 till week 20). The student is now at the end of the first semester (January). Model 4 adds the exam scores at the end of the second semester (June), including information from week 1 till week 40. Finally, model 5 includes all variables from week 0 to week 40, i.e. the backpack data, the early engagement variables and exam scores on both accounting classes.
Table 4. Machine learning using the classification method random forest.
We report, for each model, the total sample size for which we have data and how many of the students were put in the training and test sample. For both samples, we excluded any student with a missing value. As some of this data was captured later in the academic year (for instance the backpack data), sample sizes vary for each model.
We then report two F1 scores. The first one is a naïve baseline, and calculates how many false positives and false negatives we would have if we used the mode (i.e. most common) value for each student. As the mode value is always ‘pass’, this would effectively be the same as predicting that each student would pass. The naïve F1 does not have much value in and of its own, but is useful as a basis for comparison against other classifiers. For instance, in model 1, using the prediction that ‘all students will pass’, only one in four students is correctly classified. Any classifier that we discuss next should at least improve on this baseline performance.
The next F1 score is calculated when we apply the random forest algorithm on the training set, and use the resulting classification function on the remaining test data. For instance, for model 0, the random forest classifier can classify about 1 in 2 students correctly. For model 1 and 2, the random forest classifier can classify 33% and 38% (rounded) correctly to one of the three outcome groups. This is substantially higher than the so-called benchmark (naïve baseline) of 25% for each of the two models. In model 3, where the exam score of the first accounting exam is included, the random forest classifier classifies 55% of the students correct (based on only four variables), compared to the benchmark of 26%. When including also the exam score of the second accounting exam, 61% of the students are correctly classified (model 4), which cannot be improved by adding the backpack variables back in (the final model 5).
Finally, the last column of shows the predictive power for each of the individual variables, provided by the random forest classifier. The random forest function is able to provide a weighting of variables, with the highest weightings having the most predictive value (this is called feature importance). For instance for model 0, the last column show that for the backpack variables, the percentage of high school is having the highest distinguishing power (i.e. 58%) to predict the correct outcome groups, whereas the number of mathematics hours in high school only has 19% of predictive power. It is interesting to note that the predictive power is a relative measure and is changing, depending on the number and type of variables that are included in the model. For instance, the percentage of high school only has a predictive power of 14% in model 5, because many other variables are included.
Summary of results
The first research question posed to what extent early warning signals in accounting education can help to predict progression of first-year students. As mentioned before, the early warning signals include both early engagement in the course, as well as early exam performance. Given that backpack data may not be readily available, data collected in the first accounting course is more readily available. To answer this research question, we look at models 1, 2 and 3, using data from the pre-sessional and Test 1 in model 1, which is expanded with Test 2 in model 2 and with the exam scores for the first semester course Accounting A in model 3. For model 1, we arrive at a classification result of approximately 33% (including data from weeks 1–6), which is better than the naïve estimation of 25% (bench mark, where we assumed that all students would pass). For model 2, the results show a classification result of 38% (including data from weeks 1–9), again better than the benchmark of 25%. For model 3, the results are improved, with 55% of the students classified correctly, and this model includes the exam scores of the first-semester course Accounting A. Thus, early engagement and early performance data can correctly classify 55% of all students. Knowing that model 3 can be constructed at an early ‘calling station’ in the student journey (i.e. before the end of the first semester), this result is promising. By looking only at data collected during the financial accounting course, more than half of the students can be classified in the correct outcome group – bearing in mind that these outcomes become reality more than eight months later.
Looking at the type of signals, the data show that the attendance to the pre-sessional are doing less well in predictive power, compared to the test and exam results. This is not surprising given that the frequency distribution of pre-sessional attendance was not significantly different among the outcome groups. In model 3, both test results as well as the exam performance have almost equal predictive power (Test 1: 31%, Test 2: 31%, Exam Accounting A: 34%). This shows that none of the three early warning signals in accounting have dominant predictive power, but all contribute equally in predicting progression of the student for the programme as a whole.
The second research question asked whether the early warning signals in accounting education are better able to predict progression than the more general ‘backpack’ data. The data show that the early warning signals in accounting education are just as effective at predicting the outcome variable than the backpack variables, but not substantially better. As shown in , model 3 (including early engagement and early exam performance) leads to a 55% accuracy, and model 0 leads to a 52% accuracy.
Looking at the predictive power of the individual variables in model 0, the high school scores, maths hours, and probability of success all contribute to this result, with high school performance as the predictor with the highest feature importance (58%), followed by hours of mathematics (19%) and self-confidence (14%).
To answer research question 2, we elaborate on two additional insights. What happens with the comparison of the backpack model, (1) if we are including only the very early signals and (2) if we are including also the exam performance of the second semester accounting course? When we compare model 0 (backpack data) with the early engagement variables, without considering the exam score, the superiority of the early warning model above the backpack model does not hold any longer. Here we can conclude that data from the pre-sessional attendance and the two tests (model 1 and 2) are not yet sufficient to match the backpack model (model 0). Going the other direction, when we compare model 0 (backpack data) with the early engagement and all accounting exam scores (model 4) the superiority of the accounting data above the backpack model holds and the difference in explaining power even increases (model 4: 61% versus model 0: 52%). Even before students have the opportunity to do a resit exam, the accounting engagement and performance data collected in week 1 till week 40 can classify 61% of the students in the correct group of dropout, repeat year or pass for the whole programme.
Looking at the predictive feature importance of model 4 reveals interesting results. At this point in time, we are at the end of the second semester. Many students (who failed for a few courses) need to take now an important decision whether or not to participate for the resit exams. The random forest machine learning algorithm highlights that the latest signal (exam score of Accounting B in June) provides 33% of the predictive value, and Accounting A (exam score in January) provides 19%, while the test score 1 and 2 provide a relative predictive power of 20% and 22%.
The third research question addressed whether a machine learning approach can be used effectively to classify outcomes using both backpack and early signals in accounting education. As shown in , we have the best fit with the final two models. The last model (model 5) is a combination of the backpack variables, early engagement variables and exam scores, providing 61% accuracy. The backpack variables do not add very much over just early engagement and exam scores alone (see model 4), resulting in a similar accuracy of 61%. It is worth noting that the number of students drops in this model, because not all backpack data were available. Combining all available variables (model 5) shows that the only backpack variable that holds its ground is high school performance (with a predictive power of 14%), whereas the hours of maths drops to 3%. This is a remarkable result since the number of hours maths per week is considered to be the best predictor for success in this institution. Also in model 0, with the backpack data only, number of hours maths per week in high school was contributing far less than performance in high school. Hence, the machine learning approach provided new insights into the different models and independent variables.
To further illustrate the machine learning approach, presents, by way of illustration, the classification tables for the Test Set in Model 4 and 5. The diagonal presents all actual outcomes that were correctly predicted. The numbers off the diagonal all represent predictions that were different to actual outcomes.
Table 5. Classification Table with actual and predicted outcome.
Ordered logistic regression
To show the differences between machine learning and a regression, an ordered logistic regression was run for each of the six models, as shown in . The dependent variable is the outcome variable (ordered from dropout, repeat year to pass) and the independent variables are the predictors as used before in the different models. This logistic regression is applied to the whole dataset. The results show which variables are statistically significant in each of the models. The Pseudo R² shows how much of the variance in the progression variable is explained by the independent variables. The results show that model 1 and 2 have rather low R². In model 3 and 4, the explanatory power of the model as a whole, measured by the Pseudo R², is much higher (47.8% and 54.5%). These models also include exam scores and this seems to increase the explanatory power of the model as a whole. Model 5, which is a combination of all backpack, early warnings and exam scores show the highest R² (56.6%).
Table 6. Ordered Logistic regression on total sample.
When looking at the independent variables, the results show that in model 1 (and in model 2), the Test 1 is significant in explaining the outcome variable (p = .000). Interesting is that in model 2, the Test 2 scores is not significant (p = .281). When adding exam scores for Accounting A in Model 3, Test 1 is no longer significant, while the exam score is significant (p = .000). Similarly in model 4, the two independent variables of exam score for Accounting A and Accounting B are significantly related to progression (p = .000 each time), while the test scores are both insignificant. In model 5, high school percentage, hours of mathematics and the two exam scores are significant (p = .004, p = .016, p = .024 and p = .000 respectively). In sum, the different ordered logits provide insight into the significance of independent variables separately. However this analysis does not show the relative importance of the predictors. For instance, in model 5, high school performance and hours of maths per week are both significantly related to the outcome variable, however it is not clear from this analysis which of the two variables is having higher predictive power. Contrary, in the machine learning approach, the Random Forest classifier provides the predictive power for each of the independent variables, as discussed above and as shown earlier in the last column of .
Concluding the result section, we can summarise that machine learning is helpful and effective in predicting dropout. The accuracy is higher than for a simple baseline approach and the predictive feature importance provides information that can not be collected by a logit regression.
Discussion and conclusion
In this study, a machine learning approach is used to predict first-year university outcomes of business economics students, using backpack data, engagement data and accounting exam scores for two consecutive semesters. Outcome is considered as a three-level variable, with the levels dropout (i.e. the student leave the programme), repeat the year (i.e. the student has at least one course for which he/she has no credit received) and pass (i.e. the student has passed all 15 courses in the programme). The backpack data is available at the point where students embark on their journey of the first undergraduate year at the university (here gender, hours of maths, high school performance and perceived probability of success). The engagement data and the exam scores are coming from the financial accounting courses and become available along the journey of the first year. The main question is whether these accounting data can predict the outcome for the student of the whole programme. Early engagement data include participation in a pre-sessional in accounting and two midterm test scores. Early performance data include the exam score for the first semester course in financial accounting. At the end of the second semester, the exam score for the second semester course in financial accounting become available. Then the resit period start, for which no data is collected to avoid endogeneity concerns. The objective of this paper is to evaluate whether these early warning signals (engagement and performance) can predict progression (RQ 1), whether the early warning signals are better or worse than the backpack data in predicting the outcome (RQ2) and whether machine learning can be used to classify outcomes (RQ3). In the next paragraphs the eight key results are summarised.
First, the descriptive statistics show that 41% of the students included in the current sample succeed in their first year. This is in line with previous results in similar university settings (e.g. Broos et al. Citation2020, Arias Ortiz & Dehon, Citation2013). Furthermore, 27% of the students do a repeat year and 32% of the students drop out. This high dropout rate highlights that student progression should remain high on the agenda of universities. This study found that dropouts have lower high school performance, have had fewer contact hours of maths in high school, and perceive their success to be less likely. In terms of accounting education, they also score lower on the tests (in week 5 and week 9) and on the exams (in week 20 and week 40) than the other groups. In contrast, students who succeed perform better in high school, have had more contact hours of mathematics in high school, and consider themselves more likely to succeed. In terms of accounting education, they score higher on both tests during the semester and on both exams than the other groups. This is in line with expectations.
Second, in answering research question 1, the different models of the machine learning analysis show that the early warning signals (i.e. early engagement and early exam scores) on accounting can predict outcome of first-year university students. Compared to the benchmark of 25% correctly classifying, the random forest classifier was able to classify 33% of the students correct, based on data that becomes available in week 5 of the first semester (i.e. Test score 1 and attendance to pre-sessional). The accuracy of the classifier improves to 38% when including the Test score 2 (week 9) and further improves to 55% at the end of the first semester when including the exam score for the first semester accounting course.
Third, in answering research question 2, the models also show that the use of only early warning signals has more or less the same predictive value compared to using only backpack variables. This information is useful for both the teachers and for the students themselves. Based on this information, teachers can use a variety of remedial or corrective strategies to deal with at-risk students and provide them with assistance to improve their learning (Chen et al. Citation2021). Targeted encouragement and advice can contribute to study success, and encouraging exploration of alternative study paths may also be beneficial. Students may not lose an entire academic year when faster reorientation is possible. However, since only one in two are affected, accounting educators will still need to invest in obtaining learning data and analytics to take full advantage.
Fourth, it is worth exploring whether the prediction information can be provided to the students themselves in a manageable format, subject to appropriate caveats. As suggested by Broos et al. (Citation2020), information about students’ journeys could be placed in an online learning analytics dashboard, as it could alert students and help guide the learning process (Verbert et al., Citation2013). This would be especially interesting given the limited resources available to collect backpack data and the scarcity of available indicators early in the first year of study. Student advisors and faculty members could use this information to identify at-risk students who they should reach out to (Broos et al., Citation2020).
Fifth, the different models show that the prediction increases when more accounting data becomes available along the journey. Our findings of the machine learning technique indicate that the accuracy of the models improves when newly collected information is added. For instance, adding data on test 2 increases prediction accuracy. Adding the results of the early exam scores for the first semester course further increases the accuracy of the prediction. Finally, adding the results of the exam scores for the second semester course, increases the accuracy of the prediction to 61%. These findings suggest that early warning signals from accounting education specifically are valuable additions to solving the challenge of predicting first-year university outcomes.
As a sixth point, it is of interest to see that the closer the recording of the variable is to the end of the year, the more predictive it becomes. In other words, and perhaps unsurprisingly, the ‘later’ the early warning, the more predictive the variable. These ‘late warning’ variables are more predictive, but, equally, they are less useful given that any remedial window of opportunity will be smaller at the time these values become available. In addition, adding the backpack data at the final data collection point is not increasing the accuracy of the models.
When answering research question 3 (point seven), our findings indicate that machine learning can be used to classify outcomes using both backpack and data from accounting education. Each of the five models result in higher accuracy than the benchmark of the naïve baseline. In addition and as mentioned, the accuracy of the models improves when newly collected information is added. For instance, adding data on test 2 increases prediction accuracy of 33% (model 1) to 38% (model 2). Adding the results of the early exam scores for the first semester course, increases the accuracy of the prediction to 55% (model 3). Adding the results of the exam scores for the second semester course, increases the accuracy of the prediction to 61% (model 4).
Eight, the classification performance of random forest suggests that in the current study about 60% of the students’ journey can be correctly predicted by the set of independent variables. This is supported by the ordered logistic regression analyses. However, machine learning with random forest also provides information about the relative importance of each of the variables. Consequently, this study can provide guidance as to which parameters have the best predictive value and which parameters should be surveyed or collected during the first semester at the university. When considering the predictive strength of the predictors in each of the models, the predictive value of the predictor changes along the journey. For instance, when including backpack data with the data from the two accounting courses, only the accuracy of high school performance is holding its predictive ground, and all other backpack data, including gender, probability of success and hours of maths in high school, recedes to the background. Similarly, when exam data become available on Accounting B, the predictive value of the exam score for Accounting A drops.
In summary, this leads to the following conclusions:
Early warning variables and early exam scores in accounting education have similar predictive value compared to the backpack variables gender, high school performance and self-confidence to predict among fail, repeat and pass (Model 3 compared to model 0).
Variables in the latest part of the year (i.e. including exam scores for accounting) have more predictive power than the early warning variables to predict among fail, repeat and pass (model 3 and 4 compared to model 1 and 2).
The combination of early warning variables in accounting and all exam scores for accounting have the highest predictive power to predict among fail, repeat and pass. Adding backpack data at that point in time does not increase accuracy (model 4 compared to model 5).
Limitations and future research
There are some limitations to the generalisability of this study. First, a limitation is that we did not take into account all potentially relevant backpack variables in this study. Age was not included as a backpack variable because the dataset only includes similarly aged students who just finished secondary education. Older and/or working students are also not present in the current dataset. Furthermore, previous studies found that dropout rises depending on peer group availability (Johnes & McNabb, Citation2004) and ethnical background (DesJardins et al., Citation1999). Students who were the first in the family to go to university are also more likely to dropout than those with parents who did go to university (Ishitani, Citation2003). Other studies have also pointed to university-specific variables such as the advice offered, the transparency of exam regulations, and the quality of teaching (Georg, Citation2009). There has been less research on these university-specific variables, possibly because most empirical studies use students from a single university, where these factors would be invariant. Second, the context in which the research took place should be recognised: the study covered student data from Belgium, and some relevant aspects specific to this setting may not translate to other contexts. These include the student demographics (mostly local students with few outliers) and the national university entry approach (admission without selection, and comparatively high first-year dropout). The validity of the conclusions may not hold in settings that are substantially different from this context. In particular, universities with gated admissions are likely to find the level of dropout much less severe than in our study.
There are some interesting avenues for future research in the study. Given the success of some early warning variables, we encourage further researchers to seek out more indicators of engagement and performance. With virtual learning environments now pervasive in university education, perhaps more evidence of digital engagement can be collected from these environments and used. Another line of further research might be in the direction of courses other than accounting in the first year. Given the success of accounting-specific performance variables, perhaps other mid-term performance in other courses will be equally informative. Furthermore, other variables might be included. The arrival of first-year students at university is often accompanied by several challenges to adjust and integrate, such as leaving home, making new friends, handling academic expectations and developing new learning styles (Conley et al., Citation2014; Vinson et al., Citation2010). These struggles with academic, social, and personal-emotional adaptation relate closely to students’ learning experiences and academic satisfaction (Baik et al., Citation2019), and eventually their academic performance (Petersen et al., Citation2009) and university degree completion (Holliman et al., Citation2018).
This study is an extension of previous research in accounting education on the use of machine learning on dropout rates. This research also contributes to the further study of appropriate prediction methods for predicting student academic performance in the first year. It would be interesting to use second year data to examine the effects of multi-year data on prediction accuracy, using the same machine learning techniques. This could provide instructors with even more information to guide and teach students. Moreover, in addition to first-year students, it would also be interesting to see if we have the same results from more mature students, such as those in the continued professional education programmes of professional bodies. We invite colleagues to extend our study in a broader context.
In conclusion, this study has highlighted the value of early warning signals in accounting education to predict the type of student journey in the first year of university study. In doing so, this study is one of the first to focus specifically on accounting performance as a type of early warning. We hope that these promising results will encourage other researchers to look in closer detail at early warning signals and the type of outcome that they may predict.
Disclosure statement
No potential conflict of interest was reported by the author(s).
Notes
1 Except for the study programmes Medicine, Dentistry and Arts Education, for more information see Pinxten et al. (Citation2014).
2 Full programme of the first year consists of: Economics A and B (9 ECTS), Accounting A and B (8 ECTS), Business administration (4 ECTS), Mathematics A and B (8 ECTS), Statistics A and B (7 ECTS), Informatics (5 ECTS), Production Technology (5 ECTS), Human Sciences (4 ECTS), Law (4 ECTS), Economic English (3 ECTS) and Economic French (3 ECTS).
3 SciKitLearn is a free machine learning library for Python. It includes several algorithms such as support vector machine, random forest, and k-neighbours, and it also supports Python numerical and scientific libraries such as NumPy and SciPy. See: https://scikit-learn.org
References
- Araque, F., Roldan, C., & Salquero, A. (2009). Factors influencing university dropout rates. Computers & Education, 53(3), 563–574. https://doi.org/10.1016/j.compedu.2009.03.013
- Arias Ortiz, E., & Dehon, C. (2013). Roads to success in the Belgian French Community’s higher education system: Predictors of dropout and degree completion at the Université Libre de Bruxelles. Research in Higher Education, 54(6), 693–723. https://doi.org/10.1007/s11162-013-9290-y
- Baik, C., Larcombe, W., & Brooker, A. (2019). How universities can enhance student mental wellbeing: The student perspective. Higher Education Research & Development, 38(4), 674–687. https://doi.org/10.1080/07294360.2019.1576596
- Baldwin, B. A., & Howe, K. R. (1982). Secondary-level study of accounting and subsequent performance in the first college course. The Accounting Review, 57(3), 619–626.
- Bao, Y., Ke, B., Li, B., Yu, Y. J., & Zhang, J. (2020). Detecting accounting fraud in publicly traded U.S. firms using a machine learning approach. Journal of Accounting Research, 58(1), 199–235. https://doi.org/10.1111/1475-679X.12292
- Bean, J. P. (1980). Dropouts and turnover: The synthesis and test of a causal model of student attrition. Research in Higher Education, 12(2), 155–187. https://doi.org/10.1007/BF00976194
- Bence, D., & Lucas, U. (1996). The use of objective testing in first-year undergraduate accounting courses. Accounting Education, 5(2), 121–130. https://doi.org/10.1080/09639289600000014
- Breiman, L. (2001). Random forests. Machine Learning, 45(1), 5–32. https://doi.org/10.1023/A:1010933404324
- Broos, T., Pinxten, M., Delporte, M., Verbert, K., & De Laet, T. (2020). Learning dashboards at scale: Early warning and overall first year experience. Assessment & Evaluation in Higher Education, 45(6), 855–874. https://doi.org/10.1080/02602938.2019.1689546
- Byrne, M., & Flood, B. (2008). Examining the relationships among background variables and academic performance of first-year accounting students at an Irish university. Journal of Accounting Education, 26(4), 202–212. https://doi.org/10.1016/j.jaccedu.2009.02.001
- Carreira, P., & Lopes, A. S. (2019). Drivers of academic pathways in higher education: Traditional vs. non-traditional students. Studies in Higher Education, 46(7), 1340–1355. https://doi.org/10.1080/03075079.2019.1675621
- Chen, C. H., Yang, S. J., Weng, J. X., Ogata, H., & Su, C. Y. (2021). Predicting at-risk university students based on their e-book Reading behaviours by using machine learning classifiers. Australasian Journal of Educational Technology, 37(4), 130–144. https://doi.org/10.14742/ajet.6116
- Conley, C. S., Kirsch, A. C., Dickson, D. A., & Bryant, F. B. (2014). Negotiating the transition to college: Developmental trajectories and gender differences in psychological functioning, cognitive-affective strategies, and social well-being. Emerging Adulthood, 2(3), 195–210. https://doi.org/10.1177/2167696814521808
- Day, I. N. Z., van Blankenstein, F. M., Westenberg, P. M., & Admiraal, W. F. (2018). Teacher and student perceptions of intermediate assessment in higher education. Educational Studies, 44(4), 449–467. https://doi.org/10.1080/03055698.2017.1382324
- DesJardins, S. L., Ahlburg, D. A., & McCall, B. P. (1999). An event history model of student departure. Economics of Education Review, 18(3), 375–390. https://doi.org/10.1016/S0272-7757(98)00049-1
- Duff, A. (2004). Understanding academic performance and progression of first year accounting and business economics undergraduates: The role of approaches to learning and prior academic achievement. Accounting Education, 13(4), 409–430. https://doi.org/10.1080/0963928042000306800
- Eskew, R. K., & Faley, R. H. (1988). Some determinants of student performance in the first college-level financial accounting course. The Accounting Review, 63(1), 137–147.
- Everaert, P., Opdecam, E., & Maussen, S. (2017). The relationship between motivation, learning approaches, academic performance and time spent. Accounting Education, 26(1), 78–107. https://doi.org/10.1080/09639284.2016.1274911
- Geiger, M. A., & Ogilby, S. M. (2000). The first course in accounting: Students’ perceptions and their effect on the decision to major in accounting. Journal of Accounting Education, 18(2), 63–78. https://doi.org/10.1016/S0748-5751(00)00011-7
- Georg, W. (2009). Individual and institutional factors in the tendency to dropout of higher education: A multilevel analysis using data from the Konstanz Student Survey. Studies in Higher Education, 34(6), 647–661. https://doi.org/10.1080/03075070802592730
- Geron, A. (2019). Hands-on Machine Learning with SciKit-Learn, Keras & Tensorflow (2nd Editio). O’Reilly.
- Hämäläinen, W., & Vinni, M. (2010). Classifiers for educational technology . In C. Romero, S. Ventura, M. Pechenizkiy, & R. S. J. D. Baker (Eds.), Handbook on educational data mining. Chapman & Hall/CRC Data Mining and Knowledge Discovery Series, (pp. 54–74). CRC press .
- Ho, T. K.. (1995). Random decision forests. In Proceedings of 3rd international conference on document analysis and recognition (Vol. 1, pp. 278–282). IEEE.
- Holliman, A. J., Martin, A. J., & Collie, R. J. (2018). Adaptability, engagement, and degree completion: A longitudinal investigation of university students. Educational Psychology, 38(6), 785–799. https://doi.org/10.1080/01443410.2018.1426835
- Hovdhaugen, E. (2009). Transfer and dropout: Different forms of student departure in Norway. Studies in Higher Education, 34(1), 1–17. https://doi.org/10.1080/03075070802457009
- Ishitani, T. T. (2003). A longitudinal approach to assessing attrition behavior among first-generation students: Time-varying effects of pre-college characteristics. Research in Higher Education, 44(4), 433–449. https://doi.org/10.1023/A:1024284932709
- Jaijairam, P. (2012). Engaging accounting students: How to teach principles of accounting in creative and exciting ways. American Journal of Business Education (AJBE), 5(1), 75–78.
- Johnes, G., & McNabb, R. (2004). Never give up on the good times: Student attrition in the UK. Oxford Bulletin of Economics and Statistics, 66(1), 23–47. https://doi.org/10.1111/j.1468-0084.2004.00068.x
- Johnes, J. (1990). Determinants of student wastage in higher education. Studies in Higher Education, 15(1), 87–99. https://doi.org/10.1080/03075079012331377611
- Jokhan, A., Sharma, B., & Singh, S. (2019). Early warning system as a predictor for student performance in higher education blended courses. Studies in Higher Education, 44(11), 1900–1911. https://doi.org/10.1080/03075079.2018.1466872
- Kolachalama, V. B., & Garg, P. S. (2018). Machine learning and medical education. NPJ Digital Medicine, 1(1), 1–3.
- Kučak, D., Juričić, V., & Đambić, G. (2018). MACHINE LEARNING IN EDUCATION-A SURVEY OF CURRENT RESEARCH TRENDS. Annals of DAAAM & Proceedings, 29.
- Lykourentzou, I., Giannoukos, I., Nikolopoulos, V., Mpardis, G., & Loumos, V. (2009). Dropout prediction in e-learning courses through the combination of machine learning techniques. Computers & Education, 53(3), 950–965. https://doi.org/10.1016/j.compedu.2009.05.010
- Mitchell, T. M. (1997). Machine learning (Vol. 1, No. 9). McGraw-Hill.
- Murtaugh, P. A., Burns, L. D., & Schuster, J. (1999). Predicting the retention of university students. Research in Higher Education, 40(3), 355–371. https://doi.org/10.1023/A:1018755201899
- Namoun, A., & Alshanqiti, A. (2020). Predicting student performance using data mining and learning analytics techniques: A systematic literature review. Applied Sciences, 11(1), 237. https://doi.org/10.3390/app11010237
- Paver, B., & Gammie, E. (2005). Constructed gender, approach to learning and academic performance. Accounting Education, 14(4), 427–444. https://doi.org/10.1080/06939280500347142
- Pedregosa, F., Varoquaux, G., Gramfort, A., Michel, V., Thirion, B., Grisel, O., & Duchesnay, E. (2011). Scikit-learn: Machine learning in Python. Journal of Machine Learning Research, 12, 2825–2830.
- Petersen, I., Louw, J., & Dumont, K. (2009). Adjustment to university and academic performance among disadvantaged students in South Africa. Educational Psychology, 29(1), 99–115. https://doi.org/10.1080/01443410802521066
- Pinxten, M., Marsh, H. W., De Fraine, B., van den Noortgate, W., & Van Damme, J. (2014). Enjoying mathematics or feeling competent in mathematics? Reciprocal effects on mathematics achievement and perceived math effort expenditure. British Journal of Educational Psychology, 84(1), 152–174. https://doi.org/10.1111/bjep.12028
- Pinxten, M., van Soom, C., Peeters, C., & Al, E. (2019). At-risk at the gate: Prediction of study success of first year science and engineering students in an open-admission university in Flanders—Any incremental validity of study strategies? European Journal of Psychology of Education, 34(1), 45–66. https://doi.org/10.1007/s10212-017-0361-x
- Riestra-González, M., del Puerto Paule-Ruíz, M., & Ortin, F. (2021). Massive LMS log data analysis for the early prediction of course-agnostic student performance. Computers & Education, 163, 104108. https://doi.org/10.1016/j.compedu.2020.104108
- Samuel, A. L. (1959). Machine learning. The Technology Review, 62(1), 42–45.
- Saudagaran, S. M. (1996). The first course in accounting: An innovative approach. Issues in Accounting Education, 11(1), 83–94. https://www.proquest.com/scholarly-journals/first-course-accounting-innovative-approach/docview/210924673/se-2
- Sneyers, E., & De Witte, K. (2017). The effect of an academic dismissal policy on dropout, graduation rates and student satisfaction. Evidence from The Netherlands. Studies in Higher Education, 42(2), 354–389. https://doi.org/10.1080/03075079.2015.1049143
- Stewart, J. P., & Dougherty, T. W. (1993). Using case studies in teaching accounting: A quasi-experimental study. Accounting Education, 2(1), 1–10. https://doi.org/10.1080/09639289300000001
- Tinto, V. (1975). Dropout from higher education: A theoretical synthesis of recent research. Review of Educational Research, 5(1), 8–9. https://doi.org/10.3102/00346543045001089
- Tinto, V. (1988). Stages of student departure: Reflections on the longitudinal character of student leaving. The Journal of Higher Education, 59(4), 438–455. https://doi.org/10.2307/1981920
- Tomasevic, N., Gvozdenovic, N., & Vranes, S. (2020). An overview and comparison of supervised data mining techniques for student exam performance prediction. Computers & Education, 143, 103676. https://doi.org/10.1016/j.compedu.2019.103676
- Tsiakmaki, M., Kostopoulos, G., Kotsiantis, S., & Ragos, O. (2020). Transfer learning from deep neural networks for predicting student performance. Applied Sciences, 10(6), 2145. https://doi.org/10.3390/app10062145
- Van der Heijden, H. (2023). Predicting industry sectors from financial statements: An illustration of machine learning in accounting research. The British Accounting Review, 54(5), 101096. https://doi.org/10.1016/j.bar.2022.101096
- Verbert, K., Duval, E., Klerkx, J., Govaerts, S., & Santos, J. L. (2013). Learning analytics dashboard applications. American Behavioral Scientist, 57(10), 1500–1509. https://doi.org/10.1177/0002764213479363
- Vinson, D., Nixon, S., Walsh, B., Walker, C., Mitchell, E., & Zaitseva, E. (2010). Investigating the relationship between student engagement and transition. Active Learning in Higher Education, 11(2), 131–143. https://doi.org/10.1177/1469787410365658
- Wakelam, E., Jefferies, A., Davey, N., & Sun, Y. (2020). The potential for student performance prediction in small cohorts with minimal available attributes. British Journal of Educational Technology, 51(2), 347–370. https://doi.org/10.1111/bjet.12836