
 ?Mathematical formulae have been encoded as MathML and are displayed in this HTML version using MathJax in order to improve their display. Uncheck the box to turn MathJax off. This feature requires Javascript. Click on a formula to zoom.
Abstract
The urban–rural fringe is a dynamic environment where urban expansion limits the provision of landscape services. Economic valuation of these services is proposed to quantify the impact of urbanisation and inform planners of the potential losses that attribute to these land-use changes. However, most evaluation methods remain controversial regarding shortcomings in providing reliable results. This study applies market price, contingent valuation and value transfer methods and compares their performance in assessing the economic impact of land-use changes on the urban–rural fringe of the Amstelland (the Netherlands). Results with these applied methods differ greatly due to their respective advantages in revealing use values or non-use values of landscape services and dependence on land-use change. Thus, results are sensitive to value types, the scarcity of landscape services, scale of the study area, and involved stakeholders. This paper reflects on the strengths and weaknesses of these methods in different planning contexts.
1. Introduction
The urban–rural fringe is comprised of the land along the boundaries of a city that transition to urban use (Hushak Citation1975). This area is characterised by the expansion of commercial, industrial and housing areas, as well as the loss of green open areas and agricultural land (Burkhard et al. Citation2009; Nilsson et al. Citation2013). These land-use changes increase the pressure on the environment by, for example, influencing landscape components, functions, processes, and patterns, resulting in a loss of valuable agricultural soil and destruction or fragmentation of natural habitats (Nilsson et al. Citation2013). As a consequence, the landscape transforms and biodiversity is threatened (de Groot et al. Citation2010; Lambin and Ehrlich Citation1997; Lawler et al. Citation2014; Polasky et al. Citation2011; Verhagen, van Teeffelen, and Verburg Citation2018).
Since the early 1990s, the concept of ecosystem services has been applied as a tool for developing conservation and sustainable development agendas. The provision of ecosystem services has been evaluated to understand the environmental effect of land-use change (Daily Citation1997; de Groot, Wilson, and Boumans Citation2002; Guerry et al. Citation2015). Lawler et al. (Citation2014) has projected land-use change from 2001 to 2051 for the contiguous US under two scenarios: a) continuation of the trends from the 1990s, and b) high crop demand. The large differences in land use between these two scenarios led to a measured increase in carbon storage, timber production, food production (from increased yields), and a more than 10% decrease in habitat for one-quarter of modelled species. More specifically, in the peri-urban region, Song et al. (Citation2015) have calculated that land-use change has resulted in a net loss of 0.08 billion USD in the rapidly urbanised North China Plain, which produces over 35% of the total grain in China. Recently, “landscape services” has been proposed as a new, more specific concept, which differs from “ecosystem services” in that it links more closely to the man-made character of landscapes. “Landscape services” has been argued to more closely link to the practice of integrated landscape planning and may, thus, be better understood by local practitioners (de Groot et al. Citation2010; Termorshuizen and Opdam Citation2009). This study therefore refers to “landscape services” rather than “ecosystem services” hereafter.
Numerous approaches have been developed to identify, characterise, and value landscape services affected by land-use change (Metzger et al. Citation2006; Nahuelhual et al. Citation2014). Two major strands of evaluation techniques exist: direct valuation, in which the actual resource values can be directly inferred from actual observable choices and, indirect valuation in which the value is not directly observable and relies on stated preferences (Tietenberg and Lewis Citation2009). Accordingly, these techniques are classified into the revealed preference and stated preference approaches (Tietenberg and Lewis Citation2009) (). The revealed preference methods analyse actual consumer choices made in real markets in relation to specific landscape services. Two prominent applications of the revealed preference approach are the travel cost method (van Berkel and Verburg Citation2014; Knoche and Lupi Citation2007; Shrestha, Seidl, and Moraes Citation2002) and the hedonic pricing method (Bastian et al. Citation2002; Czembrowski and Kronenberg Citation2016; Swinton et al. Citation2007). The stated preference approach is a valuation technique using questionnaires to directly elicit individuals’ preferences for non-market goods (DEFRA Citation2007). The most widely used examples of this approach are choice experiments and contingent valuation methods (Bateman et al. 2002; Rolfe and Bennett Citation2006). In addition, value transfer is a method that estimates the economic benefits of a location (policy site) based on another location (study site) with similar characteristics.
Table 1. Economic valuation methods for landscape services.
Although these evaluation methods have been evolving during decades of application, most of them remain controversial due to shortcomings in providing results that are quantifiable, accurate, valid, replicable, flexible, and affordable (Bagstad et al. Citation2013). This relates foremost to the poor understanding of the complex interactions between landscape services and the cascading effects of landscape service provision (Farley Citation2008; Koschke et al. Citation2012; MEA (Millennium Ecosystem Assessment) Citation2005). Another barrier is the difficulty in quantifying non-use and indirect values - that is, a gain in an individual’s utility without the individual actually using the good directly (Laurans et al. Citation2013). Different methods can also result in contradictory estimates. Each method has its advantages and disadvantages in evaluating the impact of land-use change. Therefore, one needs to understand how the applied evaluation approach works to effectively apply the estimation to policymaking.
In this paper, three widely used evaluation approaches are applied to study the impact of land-use change between 1960 and 2000 on the provision of ecosystem services in Amstelland, a typical urban–rural transitional region in the Netherlands. The selected approaches belong to direct evaluation methods that cover both revealed preference and stated preference approaches (). This comparative assessment makes it possible to evaluate the strengths and weaknesses of the different methods and provides guidance for the selection of an appropriate method in a planning context.
2. Study area
Amstelland lies south of the city of Amsterdam and consists of five municipalities along the Amstel River (). This area covers 13,459 hectares, and there were 108,201 residents in 2012 (CBS.nl 2013). As a traditionally agricultural region, some parts of the region that were originally used for the production of crops are being used for pastures currently, due to problems with ground subsidence and flooding (Haartsen and Brand Citation2005).
Figure 1. Study area of Amstelland.
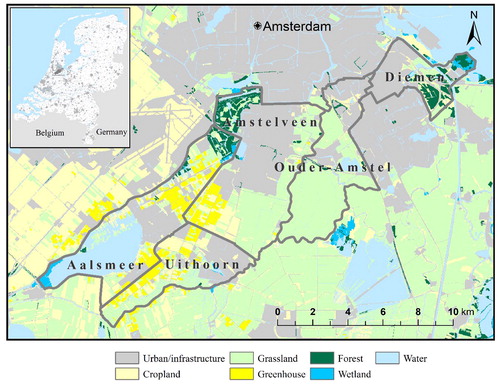
The population of Amstelland has been growing extensively with the expansion of the metropolitan region of Amsterdam and Amstelveen between 1960 and 2000. This urban pressure threatens not only agricultural use, but also the conservation of historical landscape patterns that were developed in the Middle Ages and predate the city of Amsterdam.
Various spatial policies and zoning regulations were implemented over past decades to prevent this region from becoming urbanised under market pressures (Koomen, Dekkers, and van Dijk Citation2008). Parts of Amstelland have been designated under two spatial planning zones with restrictive policies to preserve the landscape values of the region: the national buffer zone Amstelland-Vechtstreek and the Green Heart. Additionally, some of Amstelland belongs to the national ecological network (Overbeek, de Graaff, and Selnes Citation2011). Moreover, societal groups such as Groengebied Amstelland and the Beschermers Amstelland work to preserve the open rural nature of the landscape by investing in recreation, stimulating the agricultural economy, and trying to influence policymaking decisions.
3. Methods
3.1. Land-use change analysis
Before applying the three valuation methods in Amstelland, land-use conversion during the study period was analysed using ArcGIS, as this provided input for the evaluation of landscape services. For the market price approach, typical proxies were selected for valuing the landscape services. These proxies are associated with specific land-use categories (Supplementary material Appendix 1, Table 10). Accordingly, the values of each landscape service estimated were reassigned to each land-use category in accordance with the value transfer method. In this way, the results of the different approaches can be compared by total value, as well as by individual land-use category, for each of the three applied evaluation methods. For the survey-based contingent valuation approach, the land-use types that were most threatened by urbanisation are selected for survey. In addition, the land-use maps provide respondents with a visual understanding of how much and where landscapes have changed. For the value transfer method, the total area of each land-use category is required to estimate the total value.
To compare the changes per land-use category between 1960 and 2000 in Amstelland, raster data from HGN1960 (Historisch Grondgebruik Nederland) and the LGN2000 (Thunnissen and De Wit Citation2000) (Landelijk Grondgebruiksbestand Nederland) with a 25-m resolution were used. The 40 different land-use classes in LGN2000 (Thunnissen and De Wit Citation2000) were reclassified into the 8 land-use classes corresponding to the HGN1960: water, sand, wetland, greenhouse, grassland, forest, urban/infrastructure, and cropland. The LGN2000 (Thunnissen and De Wit Citation2000) categories are straightforward to reclassify, with two exceptions: grass in built-up areas and forest in built-up areas. The intuitive way to classify these is as grass and forest, but this choice leads to the unlikely result of some of the urban area being classified as transitioning to grass and forest. This classification was selected in the end, as the alternative of classifying these as urban was less logical: large parts of the Amsterdamse Bos would be shown as transitioning to urban. Using raster math to compare the two rasters, a land-use change matrix was created showing the results in terms of the total area of each land-use class in 1960 transitioning to every other land-use class in 2000.
3.2. Evaluation methods
3.2.1. Revealed preference approach
The revealed preference approach assumes the preferences of consumers can be understood by their purchasing habits incurred on landscape-related activities. The theory was pioneered by the American economist Paul Samuelson and has resulted in a variety of methods over the past three decades, including travel cost (Shrestha, Seidl, and Moraes Citation2002), hedonic pricing (Bastian et al. Citation2002), random utility modelling, replacement costs, and avoided costs (DEFRA Citation2007). The revealed preference method is widely applied because the result tends to be more objective by using actual data regarding individuals’ preferences for a marketable good (DEFRA Citation2007). However, this approach is constrained by capturing only the use value rather than the non-use value of landscape services (e.g. the intrinsic value of nature). Moreover, obtaining local and first-hand data can be a time-consuming process.
The market price method is a direct and easy-to-apply revealed preference approach, and it involves determining the value of each provided service by the price in the market. This method uses observed market prices, either as direct measures of economic value of a landscape service, or as a proxy for the value. In this study, 10 landscape services were selected that cover provisioning, regulating, and cultural categories established by Common International Classification of Ecosystem Goods and Services (CICES; Haines-Young and Potschin Citation2010; ) by following (Vallés-Planells et al. Citation2014). In this study, values resulting from direct human economic activities taking place on the land are not included. For example, a hectare of forest that people visit to enjoy nature is counted, whereas a hectare of playground built specifically for the sole purpose of the value of recreation is not.
Table 2. Selected landscape service and data sources.
Raw materials/energy is valued by the reeds gathered from wetlands, with nature management based on average annual bundles produced per hectare and the value per bundle. Food production is based on the income from agricultural products from cropland, dairy products from grassland, as well as proxied by fishing from water. The income from agricultural products and dairy products is calculated based on the average net revenues for arable farming and dairy farming following Diogo, Koomen, and Kuhlman (Citation2015). The value of fishing is calculated by the average cost per fishing permit and the percentage of residents who own fishing passes in each municipality of Amstelland. Primary production is proxied by the amount of grass, which is calculated based on the average feed or grass a cow consumes per day and the grazing days per year, as well as the total number of cows in the study area. The final value of grass production is estimated according to the replacement costs per tonne of alternative feed.
Carbon sequestration is calculated by its market price per tonne and the tonnes per hectare per land use in 2014. Air purification is based on the removal rates of pollutants (sulphur dioxide and nitrogen dioxide) by different land-use classes and the avoided health costs per kg of pollutant. Water purification is based on the nitrogen removal by vegetation for the area found within five metres of surface water (derived from the Top10NL map of surface water). Pollination is estimated by the costs of renting beehives for outdoor pollination, the number of beehives necessary to pollinate different crop types and the corresponding area of pollination-dependent crops. Soil formation is evaluated by the value of newly formed soil per tonne per hectare of agricultural land.
Flood regulation is estimated by the value changes in flood protection and storm water, which are typically calculated by estimating the total risk of an area before and after a proposed land-use change (LNV Citation2006). The risk was first calculated by a hypothetical probability of 1:10,000 occurrence of flooding to 1-m NAP using the damage scanner model (Normaal Amsterdams Peil, a vertical datum used in Western Europe). The damage costs were then adjusted for potential infiltration of unpaved soil, using the porosity of underlying soil as a proxy for the effect of damage reduction. The height model used was the Algemeen Hoogtebestand Nederland (AHN) with a 100-m resolution.
Finally, recreation is estimated by frequencies of day recreation and overnight stays with their costs. The value of day recreation is based on the lowest value of recreation type with walking visitors and the number of visitors in Groengebied Amstelland and the Amsterdamse Bos. The value of overnight stays is estimated by the average number of overnight stays per hectare nature and average profit per stay for the region of the Utrecht/North Holland lake area.
3.2.2. Stated preference
The stated preference approach is a survey-based methodology that identifies the population benefit from landscape services and elicits people’s preference for trade-offs in a hypothetical market scenario (DEFRA Citation2007). The stated preference approach is often applied because it is the only method that can estimate the non-use value of landscape services (Carson, Flores, and Meade Citation2001; Swanwick, Hanley, and Termansen Citation2007). For the past half century, the stated preference approach has been successfully used in assessing policy effects concerning biological resources, habitats, and landscapes with mostly contingent valuation and choice experiment methods; examples can be found in Bateman et al. (2002), Rambonilaza and Dachary-Bernard (Citation2007) and Rolfe and Bennett (Citation2006). However, the stated preference approach is complex in application because it is highly dependent on experts knowledgeable in different disciplines, including economic theory, experimental design, data collection, and econometric analysis (Adamowicz and Deshazo Citation2006; Hoyos Citation2010).
The contingent valuation method is attributed to Ciriacy-Wantrup (Citation1947) and is now widely used in valuing non-market resources for environmental preservation (Carson, Flores, and Meade Citation2001). This method requires that individuals express their preferences concerning environmental resources or change in resource status by answering questions about hypothetical choices. This study applies the contingent valuation method to investigate inhabitants’ willingness to pay (WTP) to preserve 30 ha of cropland and grassland, respectively, in the study region. Both cropland and grassland are considered for estimation because their losses to urbanisation reflect the most important land-use changes in Amstelland over past decades.
In the week of 19–23 May 2014, contingent valuation surveys were conducted with 120 respondents in the five municipalities of Amstelland. Respondents were shown a map of the relevant land-use transitions in the study area and told how much the land use in question had decreased since 1960. With the scenario of preserving these lands through a hypothetical financial contribution, respondents were offered a payment card with a list of possible values to choose from. In addition, either an annual tax or donation was supplied to control for the potential bias that may arise from different payment vehicles following Johnston et al. (Citation2015). This resulted in four different versions of the survey (Supplementary material Appendix 2) generated to investigate the WTP for each of the two land-use types, combined with either of the payment vehicles (means of hypothetical payment). Additionally, demographic data and recreation expenditure estimations were collected to test the representativeness of the sample and to look for correlating factors.
3.2.3. Value transfer
Value transfer, also known as benefit transfer, originates from Freeman (Citation1984), while widespread application started with the estimation of Costanza et al. (Citation1997). Costanza’s work extrapolated the economic value of 17 landscape services for 16 biomes, which were derived from published studies and original calculations. Costanza et al. (Citation2014) updated the estimation of unit values for ecosystem service between 1997 and 2011. Moreover, their study emphasised the difference in ecosystem service evaluation and commodification or privatisation, suggesting the need to consider a new institutional framework to better include public goods or common pool resources. Value transfer can be applied in three ways: unit value transfer (value of each of the land-use categories is referenced by other studies), value function transfer (value of each of the landscape functions is referenced by other studies), and meta-analytic function transfer (value of each of the land-use categories or the landscape functions is acquired by synthesising the results of multiple empirical studies with similar topics) (Brander Citation2013). This study applies the unit value transfer approach, which is relevant to land-use categories, because aggregating land-use categories is part of the analysis in each of the three evaluation methods.
The biggest weakness of this method results from the lack of correspondence between study site and policy site with respect to site characteristics, affected population and potential influence from policy (Plummer Citation2009). In the past decades, the value transfer method has been improved and produces a more context-dependent result than it once did. For example, considering the more specific context of three regions in California, Troy and Wilson (Citation2006) estimated the landscape flow values based on local unique typologies of land cover and aquatic resources. Plummer (Citation2009) attempted to enhance the correspondence between study site and policy site by carefully comparing their characteristics to select suitable existing studies.
In this research, values from the widely cited studies by Costanza et al. (Citation1997, Citation2014) and Troy and Wilson (Citation2006) were selected to apply to the land-use areas of 1960 and 2000 in Amstelland to compare the value changes in landscape services. To standardise for inflation and currency, the unit values for the two value transfer studies applied were converted to 2014 euros, using the consumer price index to adjust for inflation (www.bls.gov) and a conversion rate of $1 = €0.73 (from 12 May 2014).
As the applied land-use categories do not completely match those of Costanza et al. (Citation1997, Citation2014) nor Troy and Wilson (Citation2006), a sensitivity analysis was conducted to reveal how robust the estimations of value transfer method are. By following Hu, Liu, and Cao (Citation2008) and Tolessa, Senbeta, and Kidane (Citation2017), the coefficient of sensitivity (CS) is applied based on the standard economic concept of elasticity (Stigler Citation1952):
(1)
(1)
where LSV is the estimated landscape service value, VC is the value coefficient, i and j represent the initial and adjusted values, respectively, and k represents corresponding land-use category. If the ratio (CS) of percentage change in the estimated total landscape service value (LSV) and the percentage change in the adjusted valuation coefficient (VC) is greater than 1, then the estimated landscape service value is elastic with respect to that coefficient. As the value of the market price approach will be reassigned to each land-use category, a sensitivity analysis was applied to the result of that approach.
This study assumes that the different methods will result in different value estimates that each highlight specific types of values. The market price approach will most likely reveal use values, while the stated preference approach is better equipped to value non-use and indirect values. The value transfer method is expected to be more dependent on land-use categories, regardless of the use value or non-use values that the landscape supplies.
4. Results
4.1. Land use change
The areas per land-use class are calculated for both the years 1960 and 2000 (). A spatially explicitly analysis of land-use change in each municipality during this period and the land-use transition matrix are shown in Supplementary material Appendix 3, Fig. 2 and Supplementary material Appendix 4, Table 11. The results show that the two land-use classes with the greatest net decrease are cropland and grassland, although as a percentage change the decrease in grassland is less significant. In contrast, the area of urban/infrastructure increases rapidly in this period, while the percentage increases in forests and greenhouses are very large. The loss of cropland occurs mostly in the southwest (in and near Uithoorn), while grassland is urbanised mainly in the central and eastern part of the study area (near Amstelveen, Ouder-Amstel and the east of Diemen). Amstelveen is the municipality where the urban area expands the most.
Table 3. Area and percentage of land-use changes in Amstelland.
4.2 Evaluation results
4.2.1. Market price approach
The overall result of the market price approach shows a total value of €11,718,528, with current grassland and cropland accounting for 70.3% and 2.4% respectively (). The highest values are from air purification, food production and recreation, whose value accounts for 84.8% of the total value.
Table 4. Total value per landscape service (€).
4.2.2. Contingent valuation
The statistical analysis shows the contingent valuation survey samples are fairly representative by comparing the demographic information between respondents and local census data (Supplementary material Appendix 5, Table 12). The sample has a relatively high proportion of married and elderly people, which can be expected, as children under the age of 15 were excluded.
The result of the contingent valuation is shown in . An average WTP by means of tax or donation to preserve 30 ha cropland and grassland are €6.21 and €5.31 respectively. Respondents’ WTP varied across different payment vehicles, land-use types, municipalities, and personal characteristics. More respondents preferred tax to donation for preserving both cropland and grassland. In addition, they were willing to pay a higher average amount with tax than with donation. Moreover, two-thirds of the respondents who received a survey with the tax payment vehicle supported payment for preservation, while only one third with the donation payment card supported it. Comparatively, for preserving grassland, the share of respondents who were willing to pay was more similar between the two payment vehicles. Furthermore, the overall WTP with tax was twice as much as that with donation for cropland, while this difference was small for grasslands.
Table 5. Percentage and WTP per payment vehicle.
The WTP varied considerably between municipalities, with the highest in Amstelveen and lowest in Ouder-Amstel (). In addition, except for Amstelveen and Diemen, there were large differences in WTP between cropland and grassland. For example, respondents from Uithoorn were willing to pay about €10 for cropland, which is the highest among the five municipalities and twice as much as the lowest one in Ouder-Amstel. Interestingly, although residents in Ouder-Amstel were willing to pay the lowest for cropland, they offered the highest price for grassland.
Table 6. Average WTP per municipality and total WTP values per hectare of cropland and grassland.
The heterogeneity in WTP was also found when taking personal characteristics into account. Specifically, respondents aged 45–65 offered the highest price of €7.43, while the group aged 20–25 was not willing to pay at all. Males were willing to pay more than females. In addition, single respondents were willing to pay less than the married group, and those with partners tended to pay highest. Unsurprisingly, respondents with children were willing to pay more compared to those without children. Interestingly, it was not found that people were willing to pay more if they had a higher income or higher expenditure on outdoor recreation (Supplementary material Appendix 6, Table 13).
The average WTP was then extrapolated to the entire population and area of the land-use class using two different approaches. The first approach was by taking the average WTP for all the municipalities for each land-use type and then multiplying it by the whole population in Amstelland (named “Amstelland average” in the above table). The second approach was by multiplying the WTP for each land-use type per municipality with the population of the corresponding municipality and then totalling those results (“Amstelland total”).
4.2.3. Value transfer
While all three of the value transfer outcomes showed a significant decrease in the value of landscape services in Amstelland from 1960 to 2000 (), the change in total value while using the values of Costanza et al. (Citation1997) was the lowest. The value of each land-use category with the market price approach is shown in .
Table 7. Value per land-use category and the change in total value with value transfer and market price approach.
The sensitivity analysis results for the estimated landscape service values are regarded as inelastic (robust) because all the analyses are lower than 1 (). Moreover, the majority of the coefficients of sensitivity are lower than 0.1, with only some exceptions of higher values in wetlands. The relatively high value estimate for wetlands is because of its much higher value per unit when applying the value transfer method, as well as the amount for proxies and their prices when applying the market price approach.
Table 8. Sensitivity analysis for the results of value transfer and market price approach. Values denote coefficients of sensitivity as described in Equation (1).
4.2.4. Results comparison
The estimations based on the three evaluation methods in Amstelland in 2014 differ significantly from each other (). The value of landscape services estimated by contingent valuation is much higher than that from the other two methods, contrasting with the much lower value for the value transfer method based on Costanza et al. (Citation1997). Specifically, the value of cropland with contingent valuation almost reaches the total value of all the land-use categories with Costanza et al. (Citation2014). In addition, the three estimations using value transfer, range from almost twofold to fourfold as the value with the market price approach. Furthermore, the results of value transfer also vary considerably among the three cited studies. This can be explained by the fact that the most recent estimates for the values are likely to be higher, since landscape services generally tend to become scarcer due to the continuous over-exploitation of ecosystems (Costanza et al. Citation1997, Citation2014; de Groot et al. Citation2012). Urban land was valued as 0 in 1997 based on Costanza et al. (Citation1997) while updated to €4,863 per ha in 2011 according to Costanza et al. (Citation2014). This partly explains that the estimate with Troy and Wilson (Citation2006) is 35.8% higher than that with Costanza et al. (Citation1997), while it accounts for only 56.6% of that with Costanza et al. (Citation2014). Moreover, the variance between estimates is also associated with the different scales of study area between Troy and Wilson (Citation2006) (at a county scale) and Costanza et al. (Citation1997, Citation2014) (at a global scale).
Table 9. Value of landscape services per land-use type with different methods in Amstelland in 2014 (105€).
Although the market price approach covers the value estimated by both residents and tourists, it reveals a much lower value for cropland and grassland, which only accounts for 0.8% and 3.7%, respectively, of that found with the contingent valuation approach. It is also clear that the market price approach results in a higher value for cropland and grassland compared to that of Costanza et al. (Citation1997).
5. Discussion
5.1. Market price
Many studies have documented that the market price approach tends to result in underestimation due to exclusion of non-use values that are difficult to define, quantify, or evaluate (e.g. amenity aesthetic, artistic, and spiritual inspiration; DEFRA Citation2007; Mavsar et al. Citation2013; Pascual et al. Citation2010). This case also reveals such constraints, because it is impossible to include all of the categories of landscape services for evaluation when applying the market price approach (DEFRA Citation2007). The landscape in Amstelland provides many other services (such as biodiversity and tranquillity) beyond the 10 services considered.
The proxy selected for the estimation of non-use values greatly influences the estimated result (e.g. Kienast et al. Citation2009). For example, if the cost of hypothetical entrance tickets were used to quantify recreation, rather than using game and fishing permits, the evaluated result would change. Moreover, it is difficult to define the rational price for the proxy (e.g. fish permits) because prices can be different in different regions (in the present case, the five municipalities). In this study, most landscape services are valued at a lower bound for the proxy, for example taking the lowest price for the fishing pass for calculating wild fish and game as the proxy for food production in Amstelland waters. Another approach would be to give a range for the estimated value.
The market price approach allows the incorporation of small-scale elements such as raw material and soil formation into the estimation, which enables the analysis of complex or large-scale changes. Moreover, it is also possible to modify the estimation when more specific information is available to price the selected proxy for each landscape service when time permits. This makes the market price approach less likely to contend with uncertainty due to subjective estimation and tends to reveal more objective results compared to other approaches.
5.2. Contingent valuation
Contingent valuation has been subject to criticism concerning factors such as contextual effects, reliability of respondents, income, and payment vehicle (DEFRA Citation2007; Moran Citation2005). Despite this, targeted contingent valuation surveys might provide a better estimation, assuming hypothetical bias is adequately considered through careful study design and implementation (Carson, Flores, and Meade Citation2001). This study’s scenario allowed respondents to be aware of the potential impact of land-use change in providing benefits in Amstelland in recent decades, among which are the non-use values that are difficult to monetise with other methods. This explains why the contingent valuation method estimates much higher values for cropland and grassland. Our estimate comes close to the average cost of purchasing agricultural land in the Netherlands at €46,700/ha in 2008 (Kuhlman et al. Citation2010).
The contingent valuation method performs better in considering the effect of scarcity of landscape services compared to the other two methods, as is found in this study. Cropland is valued higher than grassland, indicating that scarce landscapes are more appreciated by people. There is a positive relationship between the loss of specific land use in a municipality and the willingness to pay to preserve that land use, as is the case for cropland in Uithoorn and Aalsmeer, for example, or for grassland in Ouder-Amstel (; although this relationship is not significant in Amstelveen or Diemen). This may be related to the fact that both regions are residential growth areas and newcomers may not be familiar with changes that have taken place in the municipality. This has been documented in Bateman and Turner (Citation1992), who suggest ensuring that the respondents are familiar with the study area and with experience of changes in land use. However, this indicates a limitation when applying the contingent valuation method to large-scale changes, as respondents can only be familiar with areas within a limited distance. Valuations directly derived from the area in question are only practical for areas on the temporal and spatial scale considered by the respondents and cannot be credibly extrapolated outside this range.
Results show that the WTP differs with respondent characteristics including age, gender, marital status, and number of children at home. However, no linear dependence was found between increasing income or money spent on outdoor recreation and the valuation (Supplementary material Appendix 6, Table 13), as was found in other studies such as Farber, Costanza, and Wilson (Citation2002). This may be because the number of respondents per category was small. We may expect such dependencies with a larger sample size. On the other hand, our results show that different payment vehicles influence estimations. Due to these complexities, the contingent valuation approach is resource consuming, and requires knowledge of study design (Moran Citation2005).
An additional issue with the contingent value method is the discrepancy between stated and actual WTP values, called hypothetical bias. Veisten and Navrud (Citation2006) compared the outcomes of a hypothetical payment question about preserving biodiversity with the subsequent payments made, and confirmed the consistency of only 32%–43.7% of the respondents. To minimise such hypothetical bias, one can consider developing a more realistic scenario to ensure respondents are aware of the bias. A pledge method can be also implemented, according to which respondents are asked to sign a pledge as a commitment and to make them feel compelled to make the payment of the amount stated to minimise the bias, such as invoicing respondents after the fact (Mohammed Citation2012).
Finally, when applying contingent valuation, it was found that results can differ when choosing different ways to aggregate into a total value. This can be affected by variation in population and area of the estimated landscape in different sections of the study regions. Specifically, the significant difference in estimates for grassland between “Amstelland average” and “Amstelland total” was mainly affected by the lower WTP in most municipalities (except Ouder-Amstel) and their larger population.
5.3. Value transfer
“Borrowing” values from study sites regardless of context is the most common criticism when applying the value transfer method (Rosenberger and Phipps Citation2007). Estimated errors can be large when applying value per unit at a large scale to a small region, as it treats landscapes as homogeneous and ignores spatial heterogeneity (Eigenbrod et al. Citation2010; Martínez-Harms and Balvanera Citation2012). Specifically, by applying the global scale of Costanza et al. (Citation1997) at a municipal scale in Amstelland, it is difficult to account for values derived from landscape characteristics appreciated locally, such as the commonly seen open grassy fields in the Netherlands.
Landscape services provided at a more local scale are normally associated with a higher value for marginal change, because locally scarce or threatened services are typically valued more by those living in the region. This perhaps partly explains why the values of landscape services estimated by Troy and Wilson (Citation2006) (at county scale) were higher than those in Costanza et al. (Citation1997) (at global scale). However, the effect of scarcity is difficult to incorporate in the estimation of the value transfer method and thus results in uncertainty when applying the unit values of one study site to a policy site at different scales.
This study shows that the total value of landscape services in Amstelland differs significantly among the three studies used for value transfer, in line with our hypotheses. Estimates based on Costanza et al. (Citation2014) were 2.4 times those with Costanza et al. (Citation1997) and 1.8 times of those with Troy and Wilson (Citation2006). This is mainly attributed to the fact that this study applied the highest unit value for cropland and grassland among all the land-use categories, and changes in these types of use were considerable in the study area.
Compared to the stated preferences and market price approaches, the value transfer approach is the easiest to apply. To improve the accuracy of the valuation, enhancing the correspondence between policy site and study site is recommended. For example, this can be done by testing the relationship between land cover and landscape services, addressing the trade-offs between diverse landscape services (Bennett, Peterson, and Gordon Citation2009), investigating thresholds of the system, and incorporating different stakeholders and research fields (Kareiva et al. Citation2007). However, fully understanding the complex relationships is not only time-consuming but also impractical (Brouwer Citation2000), so a balance must be found between accuracy and practical constraints.
5.4. Application in planning practice
By valuing landscape services according to three different approaches, their advantages and disadvantages can be shown. Value transfer is recommended for its easy application and works well in studies where land-use changes are considerable, such as in rapidly urbanising regions. This was exemplified in studies in, for example, China and Ethiopia (Song et al. Citation2015; Tolessa, Senbeta, and Kidane Citation2017). This is because the obtained value is dependent on the area of each land-use category. For regions with a more moderate urbanisation rate and smaller but conspicuous developments (such as new infrastructure) where impacts are foremost related to landscape morphology (e.g. fragmentation, contiguity, and shape), the market price and contingent valuation approaches are better suited to value changes.
When considering the services targeted for protection, contingent valuation is recommended for valuing those services whose indirect uses are more appreciated. This relates, for example, to the increasing demands for regulating services and cultural services by residents who live in the urban centre and urban–rural fringe. While the market price approach can be selected to reveal the direct use values that mainly matter for provisioning services.
With respect to the requested resources, the market price approach is time-consuming on the specification of the main landscape services that are supplied locally and especially the collection of data that can be used to quantify service values. Similarly, contingent valuation is time-consuming in the processes of survey design, pre-test, interview and data analysis. Moreover, both contingent valuation and the market price approach are costly for data collection and interview. Value transfer obviously demands the least effort since it only requires the land-use area for the relevant types of land-use.
6. Conclusion
This study has applied the market price, contingent valuation and value transfer approaches to value the changes in landscape services associated with land-use change on the urban–rural fringe of Amstelland. We showed how the results differed across the various valuation approaches by assessing in detail the factors that influenced the value estimation. The market price approach performed the best when changes affected small elements rather than land cover in general. This method is recommended when only part of the landscape services needs to be taken into account rather than all of the services. This is especially true when direct or indirect values are more important than non-use values. Comparatively, the contingent valuation method better captures indirect values and non-use values for incorporating people’s appreciation of landscape services. An additional benefit of this method is that it makes it possible to reveal the impact of the scarcity of landscape services on the results. The value transfer is a “second best” valuation method, because it is easy to apply and cost-efficient, especially at a large scale and for areas with significant land-cover change. The results of value transfer can be sufficient to provide some insights in certain situations, particularly to meet the requirements of time and financial constraints, with an understanding of the limitations of the uncertainties of this approach (Johnston and Rosenberger Citation2010; Nelson and Kennedy Citation2009; Richardson et al. Citation2015). Whichever method is chosen, the choice for a meaningful metric needs to be in accordance with the characteristics of the evaluated landscape services, policy context and purpose of the valuation (Gómez-Baggethun et al. Citation2014).
Supplemental data
Supplemental data for this article can be accessed here.
Supplemental Material
Download MS Word (185.6 KB)Disclosure statement
The authors declare that they have no conflict of interest.
Additional information
Funding
References
- Adamowicz, W., and J. R. Deshazo. 2006. “Frontiers in Stated Preferences Methods: An Introduction.” Environmental and Resource Economics 34 (1): 1–6. doi:10.1007/s10640-005-4818-z.
- Bagstad, K. J., D. J. Semmens, S. Waage, and R. Winthrop. 2013. “A Comparative Assessment of Decision-Support Tools for Ecosystem Services Quantification and Valuation.” Ecosystem Services 5: 27–39. doi:10.1016/j.ecoser.2013.07.004.
- Bastian, C. T., D. M. McLeod, M. J. Germino, W. A. Reiners, and B. J. Blasko. 2002. “Environmental Amenities and Agricultural Land Values: A Hedonic Model Using Geographic Information Systems Data.” Ecological Economics 40 (3): 337–349. doi:10.1016/S0921-8009(01)00278-6.
- Bateman, I. J., and R. K. Turner. 1992. Evaluation of the Environment: The Contingent Valuation Method. CSERGE GEC Working Paper 92–18, 108, Norwich: University of East Anglia. Available at: https://www.researchgate.net/profile/Ian_Bateman/publication/239757571_Evaluation_of_the_Environment_The_Contingent_Valuation_Method/links/574e9dd908ae82d2c6be32cd/Evaluation-of-the-Environment-The-Contingent-Valuation-Method.pdf
- Bennett, E. M., G. D. Peterson, and L. J. Gordon. 2009. “Understanding Relationships Among Multiple Ecosystem Services.” Ecology Letters 12 (12): 1394–1404. doi:10.1111/j.1461-0248.2009.01387.x.
- Brander, L. 2013. Guidance Manual on Value Transfer Methods for Ecosystem Services. UNEP: Nairobi, Kenya.
- Brouwer, R. 2000. “Environmental Value Transfer: State of the Art and Future Prospects.” Ecological Economics 32 (1): 137–152. doi:10.1016/S0921-8009(99)00070-1.
- Burkhard, B., F. Kroll, F. Müller, and W. Windhorst. 2009. “Landscapes’ Capacities to Provide Ecosystem Services: A Concept for Land-Cover Based Assessments.” Landscape Online 15 (1): 1–22. doi:10.3097/LO.200915.
- Carson, R. T., N. E. Flores, and N. F. Meade. 2001. “Contingent Valuation: Controversies and Evidence.” Environmental and Resource Economics 19 (2): 173–210. doi:10.1023/A:1011128332243.
- Ciriacy-Wantrup, V. 1947. “Capital Returns from Soil-Conservation Practices.” Journal of Farm Economics 29 (4): 1181–1190. doi:10.2307/1232747.
- Costanza, R., R. d'Arge, R. de Groot, S. Farber, M. Grasso, B. Hannon, K. Limburg, et al. 1997. “The Value of the World’s Ecosystem Services and Natural Capital.” Nature 387 (6630): 253–260. doi:10.1038/387253a0.
- Costanza, R., R. de Groot, P. Sutton, S. van der Ploeg, S. J. Anderson, I. Kubiszewski, S. Farber, and R. K. Turner. 2014. “Changes in the Global Value of Ecosystem Services.” Global Environmental Change 26 (1): 152–158. doi:10.1016/j.gloenvcha.2014.04.002.
- Czembrowski, P., and J. Kronenberg. 2016. “Hedonic Pricing and Different Urban Green Space Types and Sizes: Insights into the Discussion on Valuing Ecosystem Services.” Landscape and Urban Planning 146: 11–19. doi:10.1016/j.landurbplan.2015.10.005.
- Daily, G. C. 1997. “Introduction: What Are Ecosystem Services?” In Nature’s Services: Societal Dependence on Natural Ecosystems, edited by G. C. Daily, 1–10. Washington, DC: Island Press.
- de Groot, R., R. Alkemade, L. Braat, L. Hein, and L. Willemen. 2010. “Challenges in Integrating the Concept of Ecosystem Services and Values in Landscape Planning, Management and Decision Making.” Ecological Complexity 7 (3): 260–272. doi:10.1016/j.ecocom.2009.10.006.
- de Groot, R., L. Brander, S. van der Ploeg, R. Costanza, F. Bernard, L. Braat, M. Christie, et al. 2012. “Global Estimates of the Value of Ecosystems and Their Services in Monetary Units.” Ecosystem Services 1 (1): 50–61. doi:10.1016/j.ecoser.2012.07.005.
- de Groot, R. S., M. A. Wilson, and R. M. Boumans. 2002. “A Typology for the Classification, Description and Valuation of Ecosystem Functions, Goods and Services.” Ecological Economics 41 (3): 393–408. doi:10.1016/S0921-8009(02)00089-7.
- Department for Environment, Food and Rural Affairs (DEFRA). 2007. An Introductory Guide to Valuing Ecosystem Services. London: DEFRA.
- Diogo, V., E. Koomen, and T. Kuhlman. 2015. “An Economic Theory-Based Explanatory Model of Agricultural Land-Use Patterns: The Netherlands as a Case Study.” Agricultural Systems 139: 1–16. doi:10.1016/j.agsy.2015.06.002.
- Eigenbrod, F., P. R. Armsworth, B. J. Anderson, A. Heinemeyer, S. Gillings, D. B. Roy, C. D. Thomas, and K. J. Gaston. 2010. “The Impact of Proxy‐Based Methods on Mapping the Distribution of Ecosystem Services.” Journal of Applied Ecology 47 (2): 377–385. doi:10.1111/j.1365-2664.2010.01777.x.
- Farber, S. C., R. Costanza, and M. A. Wilson. 2002. “Economic and Ecological Concepts for Valuing Ecosystem Services.” Ecological Economics 41 (3): 375–392. doi:10.1016/S0921-8009(02)00088-5.
- Farley, J. 2008. “The Role of Prices in Conserving Critical Natural Capital.” Conservation Biology 22 (6): 1399–1408. doi:10.1111/j.1523-1739.2008.01090.x.
- Freeman, A. M. III 1984. “On the Tactics of Benefit Estimation under Executive Order 12291.” In Environmental Policy under Reagan’s Executive Order: The Role of Benefit-Cost Analysis, edited by V. K Smith, 167–186. Chapel Hill: University of North Carolina Press.
- Gómez-Baggethun, E., B. Martín-López, D. Barton, L. Braat, H. Saarikoski, E. Kelemen, M. García-Llorente, et al. 2014. “State-of-the-Art Report on Integrated Valuation of Ecosystem Services.” EU FP7 OpenNESS Project Deliverable 4: 1–33.
- Guerry, A. D, S. Polasky, J. Lubchenco, R. Chaplin-Kramer, G. C. Daily, R. Griffin, M. Ruckelshaus, et al. 2015. “Natural Capital and Ecosystem Services Informing Decisions: From Promise to Practice.” Proceedings of the National Academy of Sciences 112 (24): 7348–7355. doi:10.1073/pnas.1503751112.
- Haartsen, A., and N. Brand. 2005. Amstelland: land van water en veen. Utrecht, the Netherlands: Uitgeverij Matrijs (in Dutch).
- Haines-Young, R., and M. Potschin. 2010. “The Links Between Biodiversity, Ecosystem Services and Human Well-Being.”. In Ecosystem Ecology: A New Synthesis, edited by D. Raffaelli and C. Frid, 110–139. BES Ecological Reviews Series. Cambridge: CUP.
- Hoyos, D. 2010. “The State of the Art of Environmental Valuation with Discrete Choice Experiments.” Ecological Economics 69 (8): 1595–1603. doi:10.1016/j.ecolecon.2010.04.011.
- Hu, H., W. Liu, and M. Cao. 2008. “Impact of Land Use and Land Cover Changes on Ecosystem Services in Menglun, Xishuangbanna, Southwest China.” Environmental Monitoring and Assessment 146 (1-3): 147–156. doi:10.1007/s10661-007-0067-7.
- Hushak, L. J. 1975. “The Urban Demand for Urban–Rural Fringe Land.” Land Economics 51 (2): 112–123. doi:10.2307/3145580.
- Johnston, R. J., J. Rolfe, R. S. Rosenberger, and R. Brouwer. 2015. Benefit Transfer of Environmental and Resource Values. Vol. 14. New York: Springer.
- Johnston, R. J., and R. S. Rosenberger. 2010. “Methods, Trends and Controversies in Contemporary Benefit Transfer.” Journal of Economic Surveys 24 (3): 479–510. doi:10.1111/j.1467-6419.2009.00592.x.
- Kareiva, P., S. Watts, R. McDonald, and T. Boucher. 2007. “Domesticated Nature: Shaping Landscapes and Ecosystems for Human Welfare.” Science 316 (5833): 1866–1869. doi:10.1126/science.1140170.
- Kienast, F., J. Bolliger, M. Potschin, R. S. de Groot, P. H. Verburg, I. Heller, D. Wascher, and R. Haines-Young. 2009. “Assessing Landscape Functions with Broad-Scale Environmental Data: Insights Gained from a Prototype Development for Europe.” Environmental Management 44 (6): 1099–1120. doi:10.1007/s00267-009-9384-7.
- Klijn, F., P. Baan, K. de Bruijn, and J. Kwadijk. 2007. Overstromingsrisico’s in nederland in een veranderend klimaat. Delft, Netherlands: Delft Hydraulics (in Dutch).
- Knoche, S., and F. Lupi. 2007. “Valuing Deer Hunting Ecosystem Services from Farm Landscapes.” Ecological Economics 64 (2): 313–320. doi:10.1016/j.ecolecon.2007.07.023.
- Koomen, E., J. Dekkers, and T. van Dijk. 2008. “Open-Space Preservation in The Netherlands: Planning, Practice and Prospects.” Land Use Policy 25 (3): 361–377. doi:10.1016/j.landusepol.2007.09.004.
- Koschke, L., C. Fürst, S. Frank, and F. Makeschin. 2012. “A Multi-Criteria Approach for an Integrated Land-Cover-Based Assessment of Ecosystem Services Provision to Support Landscape Planning.” Ecological Indicators 21: 54–66. doi:10.1016/j.ecolind.2011.12.010.
- Kuhlman, T., J. Luijt, J. van Dijk, A. D. Schouten, and M. J. Voskuilen. 2010. Grondprijskaarten 1998-2008. Wettelijke Onderzoekstaken Natuur Milieu Report 185. Den Haag: LEI Wageningen UR (in Dutch).
- Lambin, E. F., and D. Ehrlich. 1997. “Land-Cover Changes in Sub-Saharan Africa (1982–1991): Application of a Change Index Based on Remotely Sensed Surface Temperature and Vegetation Indices at a Continental Scale.” Remote Sensing of Environment 61 (2): 181–200. doi:10.1016/S0034-4257(97)00001-1.
- Laurans, Y., A. Rankovic, R. Billé, R. Pirard, and L. Mermet. 2013. “Use of Ecosystem Services Economic Valuation for Decision Making: Questioning a Literature Blindspot.” Journal of Environmental Management 119: 208–219. doi:10.1016/j.jenvman.2013.01.008.
- Lavelle, P., T. Decaëns, M. Aubert, S. Barot, M. Blouin, F. Bureau, P. Margerie, P. Mora, and J.-P. Rossi. 2006. “Soil Invertebrates and Ecosystem Services.” European Journal of Soil Biology 42: S3–S15. doi:10.1016/j.ejsobi.2006.10.002.
- Lawler, J. J., D. J. Lewis, E. Nelson, A. J. Plantinga, S. Polasky, J. C. Withey, D. P. Helmers, S. Martinuzzi, D. Pennington, and V. C. Radeloff. 2014. “Projected Land-Use Change Impacts on Ecosystem Services in the United States.” Proceedings of the National Academy of Sciences 111 (20): 7492–7497. doi:10.1073/pnas.1405557111.
- LNV, Ministry of Agriculture, Nature Food Quality (Ministerie van landbouw, natuur voedselkwaliteit). 2006. Kentallen waardering natuur, water, bodem en landschap: Hulpmiddel bij MKBA’s. Rotterdam: LNV (in Dutch).
- Lohila, A., M. Aurela, K. Regina, and T. Laurila. 2003. “Soil and Total Ecosystem Respiration in Agricultural Fields: Effect of Soil and Crop Type.” Plant and Soil 251 (2): 303–317. doi:10.1023/A:1023004205844.
- Martínez-Harms, M. J., and P. Balvanera. 2012. “Methods for Mapping Ecosystem Service Supply: A Review.” International Journal of Biodiversity Science, Ecosystem Services and Management 8 (1-2): 17–25. doi:10.1080/21513732.2012.663792.
- Mavsar, R., E. Varela, F. Gouriveau, and F. Herreros. 2013. “Economic Valuation Methods: Comparison of Economic Valuation Methods.” http://planbleu.org/sites/default/files/upload/files/FactSheets_methods_EN.pdf
- MEA (Millennium Ecosystem Assessment). 2005. Ecosystems and Human Well-Being. Washington, DC: Island Press.
- Metzger, M., M. D. A. Rounsevell, L. Acosta-Michlik, R. Leemans, and D. Schröter. 2006. “The Vulnerability of Ecosystem Services to Land Use Change.” Agriculture, Ecosystems Environment 114 (1): 69–85. doi:10.1016/j.agee.2005.11.025.
- Mohammed, E. Y. 2012. “Contingent Valuation Responses and Hypothetical Bias: Mitigation Effects of Certainty Question, Cheap Talk, and Pledging.” Environmental Economics 3 (3): 62–71.
- Moran, D. 2005. The Economic Valuation of Rural Landscapes: AA21 Study for SEERAD. https://pdfs.semanticscholar.org/9d48/d4fd74cf772c66db1fb066f9cfcd8b1eed26.pdf
- Morse, R., and N. Calderone. 2000. “The Value of Honey Bees as Pollinators of U.S. crops in 2000.” Bee Culture 128: 1–15.
- Nahuelhual, L., A. Carmona, M. Aguayo, and C. Echeverria. 2014. “Land Use Change and Ecosystem Services Provision: A Case Study of Recreation and Ecotourism Opportunities in Southern Chile.” Landscape Ecology 29 (2): 329–344. doi:10.1007/s10980-013-9958-x.
- Nelson, J. P., and P. E. Kennedy. 2009. “The Use (and Abuse) of Meta-Analysis in Environmental and Natural Resource Economics: An Assessment.” Environmental and Resource Economics 42 (3): 345–377. doi:10.1007/s10640-008-9253-5.
- Nilsson, K., S. Pauleit, S. Bell, C. Aalbers, and T. A. S. Nielsen, eds. 2013. Peri-Urban Futures: Scenarios and Models for Land Use Change in Europe. Heidelberg: Springer Science Business Media.
- Oosterbaan, A., A. E. G. Tonneijck, and E. A. de Vries. 2006. Kleine landschapselementen als invangers van fijn stof en ammoniak. Alterra-rapport 1419. Wageningen: Alterra. (in Dutch)
- Overbeek, G., R. de Graaff, and T. Selnes. 2011. Investeren in landschap: lessen uit de gebiedsprocessen in Amstelland, Binnenveld, Het Groene Woud Ooijpolder-Groesbeek. Landbouw Economische Instituut (LEI) Report. Wageningen: LEI.
- Pascual, U., R. Muradian, L. Brander, E. Gómez-Baggethun, B. Martín-López, M. Verma, P. Armsworth, et al. 2010. “The Economics of Valuing Ecosystem Services and Biodiversity.” In The Economics of Ecosystems and Biodiversity: Ecological and Economic Foundations, edited by P. Kumar, 183–256. London: TEEB, Earthscan.
- Pimentel, D., C. Wilson, C. McCullum, R. Huang, P. Dwen, J. Flack, Q. Tran, T. Saltman, and B. Cliff. 1997. “Economic and Environmental Benefits of Biodiversity.” BioScience 47 (11): 747–757. doi:10.2307/1313097.
- Plummer, M. L. 2009. “Assessing Benefit Transfer for the Valuation of Ecosystem Services.” Frontiers in Ecology and the Environment 7 (1): 38–45. doi:10.1890/080091.
- Polasky, S., S. R. Carpenter, C. Folke, and B. Keeler. 2011. “Decision-Making under Great Uncertainty: Environmental Management in an Era of Global Change.” Trends in Ecology and Evolution 26 (8): 398–404. doi:10.1016/j.tree.2011.04.007.
- Population 2014. www.CBS.nl
- Rambonilaza, M., and J. Dachary-Bernard. 2007. “Land-Use Planning and Public Preferences: What Can We Learn from Choice Experiment Method?” Landscape and Urban Planning 83 (4): 318–326. doi:10.1016/j.landurbplan.2007.05.013.
- Richardson, L., J. Loomis, T. Kroeger, and F. Casey. 2015. “The Role of Benefit Transfer in Ecosystem Service Valuation.” Ecological Economics 115: 51–58. doi:10.1016/j.ecolecon.2014.02.018.
- Rolfe, J., and J. Bennett. 2006. Choice Modelling and the Transfer of Environmental Values. Cheltenham: Edward Elgar Publishing.
- Rosenberger, R., and T. Phipps. 2007. “Correspondence and Convergence in Benefit Transfer Accuracy: Meta-Analytic Review of the Literature.” In Environmental Value Transfer: Issues and Methods, edited by S. Navrud and R. Ready, 23–43. Dordrecht: Springer.
- Shrestha, R. K., A. F. Seidl, and A. S. Moraes. 2002. “Value of Recreational Fishing in the Brazilian Pantanal: A Travel Cost Analysis Using Count Data Models.” Ecological Economics 42 (1-2): 289–299. doi:10.1016/S0921-8009(02)00106-4.
- Smolders, G., and M. Plomp. 2012. Weiden van biologisch melkvee. Hoe langer hoe beter? Wageningen UR Livestock Research, Report #594. Lelystad: Wageningen UR (in Dutch).
- Song, W., X. Deng, Y. Yuan, Z. Wang, and Z. Li. 2015. “Impacts of Land-Use Change on Valued Ecosystem Service in Rapidly Urbanized North China Plain.” Ecological Modelling 318: 245–253. doi:10.1016/j.ecolmodel.2015.01.029.
- Spadaro, J., and A. Rabl. 2002. “Air Pollution Damage Estimates: The Cost per Kg of Pollutant.” International Journal of Risk Assessment and Management 3 (1): 75–98. doi:10.1504/IJRAM.2002.001521.
- Stigler, G. J. 1952. The Theory of Price. New York: Macmillan Company.
- Swanwick, C., N. Hanley, and M. Termansen. 2007. Scoping Study on Agricultural Landscape Valuation. Final Report to DEFRA. http://statistics.defra.gov.uk/esg/reports/agrlandval/Mainrep.pdf.
- Swinton, S. M., F. Lupi, G. P. Robertson, and S. K. Hamilton. 2007. “Ecosystem Services and Agriculture: Cultivating Agricultural Ecosystems for Diverse Benefits.” Ecological Economics 64 (2): 245–252.
- Termorshuizen, J. W., and P. Opdam. 2009. “Landscape Services as a Bridge Between Landscape Ecology and Sustainable Development.” Landscape Ecology 24 (8): 1037–1052. doi:10.1007/s10980-008-9314-8.
- Tietenberg, T., and L. Lewis. 2009. Environmental and Natural Resource Economics. 8th ed. New Jersey, USA: Pearson Education, Inc. ISBN: 978-7-300-15522-7.
- Thunnissen, H., and A. de Wit. 2000. “The National Land Cover Database of the Netherlands.” In Proceedings of the XIX Congress of the International Society for Photogrammetry and Remote Sensing (ISPRS), edited by K.J. Beek, and M. Molenaar, 223–230. Amsterdam: GITC.
- Tolessa, T., F. Senbeta, and M. Kidane. 2017. “The Impact of Land Use/Land Cover Change on Ecosystem Services in the Central Highlands of Ethiopia.” Ecosystem Services 23: 47–54. doi:10.1016/j.ecoser.2016.11.010.
- “Top10NL (surface water vector data).” 2009. https://www.pdok.nl/introductie/-/article/basisregistratie-topografie-brt-topnl
- Troy, A., and M. A. Wilson. 2006. “Mapping Ecosystem Services: Practical Challenges and Opportunities in Linking GIS and Value Transfer.” Ecological Economics 60 (2): 435–449. doi:10.1016/j.ecolecon.2006.04.007.
- Vallés-Planells, M., F. Galiana, and V. Van Eetvelde. 2014. “A Classification of Landscape Services to Support Local Landscape.” Ecology and Society 19 (1): 1–11.
- van Berkel, D. B., and P. H. Verburg. 2014. “Spatial Quantification and Valuation of Cultural Ecosystem Services in an Agricultural Landscape.” Ecological Indicators 37: 163–174. doi:10.1016/j.ecolind.2012.06.025.
- Veisten, K., and S. Navrud. 2006. “Contingent Valuation and Actual Payment for Voluntarily Provided Passive-Use Values: Assessing the Effect of an Induced Truth-Telling Mechanism and Elicitation Formats.” Applied Economics 38 (7): 735–756. doi:10.1080/00036840500400152.
- Verhagen, W., A. J. van Teeffelen, and P. H. Verburg. 2018. “Shifting Spatial Priorities for Ecosystem Services in Europe Following Land Use Change.” Ecological Indicators 89: 397–410. doi:10.1016/j.ecolind.2018.01.019.
- Yang, J., Q. Yu, and P. Gong. 2008. “Quantifying Air Pollution Removal by Green Roofs in Chicago.” Atmospheric Environment 42 (31): 7266–7273. doi:10.1016/j.atmosenv.2008.07.003.