Abstract
This empirical study explores visual attention to carbon labels on restaurant menus. Carbon labels can support consumers in making deliberate low-carbon menu choices if, and only if, consumers pay attention to such labels. Using eye-tracking, we investigate how much attention consumers pay to carbon labels. We also compare how much attention they pay to carbon labels compared to labels indicating the benefit of each menu item to the local community. Results indicate that both carbon labels and labels communicating local community benefits attract little attention, suggesting that they are insufficient to direct patrons towards ordering low emissions menu items. Directing patrons toward more environmentally friendly menu items could significantly reduce the negative environmental impact of tourism and hospitality.
Introduction
Climate change is driven by unsustainable patterns of human activity; addressing them requires changes in consumption behaviour (UNEP, Citation2007). Food consumption alone is responsible for around a third of emissions in developed countries (Garnett, Citation2011). Animal-based diets have higher greenhouse gas emissions than vegetarian diets. Most of this difference is due to beef (Marlow et al., Citation2009; Tilman & Clark, Citation2014). Producing one kilogram of beef generates 14–32 kg of CO2 equivalents. Chicken is the more environmentally friendly meat, generating only 3.7–6.9 kg of CO2 equivalents (de Vries & de Boer, Citation2010). Replacing ruminant meat (beef) with poultry can, therefore, reduce the greenhouse gas emission significantly (Hallström, Carlsson-Kanyama, & Börjesson, Citation2015; Stehfest et al., Citation2009; Tilman & Clark, Citation2014).
Tourism and hospitality contribute substantially to global food consumption (with 40 million tonnes of food eaten by tourists globally in 2011 (Gössling & Peeters, Citation2015)), and the global carbon footprint (4.5% (Lenzen et al., Citation2018)). Redirecting food choices in the tourism and hospitality context has the potential of having a substantial positive impact in terms of the reduction of CO2 emissions.
One way of influencing menu choices in tourism and hospitality is to display carbon labels. Carbon labels inform consumers about the extent of the negative environmental impact of the products they are considering to purchase (Berry, Crossley, & Jewell, Citation2008; Schaefer & Blanke, Citation2014; Vandenbergh, Dietz, & Stern, Citation2011), enabling them to select more environmentally friendly options (Gössling, Citation2011). Some retailers, including Tesco, the Finnish RAISIO food company, and the French Casino supermarket, are now selling carbon labelled products (Berry et al., Citation2008; Rosenthal, Citation2009; Schaefer & Blanke, Citation2014). Carbon labelling is also used in restaurants. Max restaurants – Sweden’s largest chain of burger restaurants – display carbon dioxide-equivalent values next to each menu item (Max-Burgers, Citation2018), allowing customers to buy the Max chicken burger (generating 0.3 kg of CO2 equivalent emissions) instead of the cheese burger (generating 1.9 kg of CO2 equivalent emissions).
But the key question remains: are carbon labels an effective communication tool to influence menu choice in tourism and hospitality? Restaurant patrons can only change their menu item choice based on carbon emission information if they pay attention to the carbon labels. Little is known about consumer attention to carbon labels. Existing studies investigate self-reported use of carbon labels on menus (Filimonau, Lemmer, Marshall, & Bejjani, Citation2017) or actual sales of menu items with carbon labels (Spaargaren, van Koppen, Janssen, Hendriksen, & Kolfschoten, Citation2013). In both cases, however, attention is taken for granted. Attention as a key component of a menu choice decision process has not been studied to date.
Our study fills this gap. We combine eye-tracking, survey research, and unstructured interviews to gain insight into people’s visual attention to carbon labels when ordering food from a fast-food menu. We also compare attention to carbon labels with attention to labels communicating the benefits of menu items to the local community. Labels communicating benefits of food items to the local community might attract more attention because consumers attach higher importance to local food claims than they do to carbon labels (Onozaka & McFadden, Citation2011). The key contributions of our study are to (1) determine whether lack of attention is preventing carbon labelling of menu items from affecting ordering decisions, and (2) to assess whether labels indicating benefits to the local community attract more attention than carbon labels. Results are of immediate relevance to industry: they uncover (reasons for) (in)attention to carbon labels, and point to possible approaches of increasing ordering of environmentally friendly food items when dining out. Re-directing consumer choice toward more environmentally friendly food items in tourism and hospitality could significantly reduce the negative environmental impact of restaurant food choice.
Prior work
Carbon labels in tourism and hospitality
Defined as “communication systems intended to influence consumer behaviour towards greater consideration of environmental concerns” (Gössling & Buckley, Citation2016, p. 2), environmental labels on tourism products are a widely advocated strategy to increase sustainability (Araña & León, Citation2016). Carbon labels provide information about the carbon dioxide emissions, and are expected to increase consumers’ environmental awareness, and induce more sustainable behaviour (Lucas, Brooks, Darnton, & Jones, Citation2008). Using carbon labels is in line with the utility-maximizing model of consumer behaviour. For consumers to be able to maximize utility, they must have access to perfect information relating to products they want to purchase. But consumers cannot necessarily observe the information about environmental sustainability (“credence” information) either at the point of purchase or after the purchase. Carbon labels can convert “credence” information – environmental sustainability – into “search” information, allowing consumers to comparatively assess product alternatives before choosing (Cohen & Vandenbergh, Citation2012).
The tourism and hospitality industry has adopted a variety of carbon labelling schemes in accommodation, transport (Anderson, Mastrangelo, Chase, Kestenbaum, & Kolodinsky, Citation2013; Buckley, Citation2002, Citation2012, Citation2013; Font & Buckley, Citation2001), tour packages (Eijgelaar, Nawijn, Barten, Okuhn, & Dijkstra, Citation2016), and destination management (Cerqua, Citation2017; Kozak & Nield, Citation2004; Zielinski & Botero, Citation2015). For example, the British carrier Flybe (Citation2018) uses an environmental label indicating carbon dioxide emission per flight. The hotel association Fuerte Hoteles (Citation2018) states carbon dioxide emissions per guest night (Gössling & Buckley, Citation2016). Carbon information provided to consumers for specific products has the potential of altering consumer preferences and redirecting their attention to more environmentally friendly options (Eijgelaar et al., Citation2016).
Tourism affects the restaurant industry as significantly as it does the hotel industry because one-third of the tourism expenditure is on food, following accommodation (Telfer & Wall, Citation2000; Van Loon & Rouwendal, Citation2017). Restaurant menus represent a fundamental way of communicating with patrons. Providing nutritional labels, for example, increases sales of low fat menu items (Albright, Flora, & Fortmann, Citation1990). Descriptive food names also increase menu item sales (Wansink, Painter, & van Ittersum, Citation2001), and adding pictures of the ocean leads to more seafood being ordered in restaurants (Guéguen, Jacob, & Ardiccioni, Citation2012). At a more general level, providing pictures of menu items improves patron attitudes, purchase intention and stated willingness to pay (Hou, Yang, & Sun, Citation2017). Therefore, providing information about menu items has the potential to educate consumers (Roberto, Larsen, Agnew, Baik, & Brownell, Citation2010), and increase sales of desirable items. Restaurant menus can display environmental labels to inform consumers to choose more environmentally friendly food (Filimonau et al., Citation2017), yet it is not common practice for restaurants to display such labels. Only one restaurant actually displays carbon labels by default: the fast-food restaurant Max-Burgers (Gössling & Buckley, Citation2016).
How carbon labels affect behaviour
Anecdotal evidence relating to products other than restaurant menu items suggests that environmental labels may have the potential to affect product sales (Teisl, Roe, & Hicks, Citation2002): actual purchase behaviour of toilet paper displaying a Nordic Swan label indicating its environmental sustainability increased significantly between 1997 and 2001 in Denmark (Bjørner, Hansen, & Russell, Citation2004). The introduction of the carbon labelling program in a grocery store in Australia increased sales of low-carbon products relative to competing brands. When the low carbon labelled products were also cheapest, sales increased by 20% (Vanclay et al., Citation2011).
Consumer survey studies find consumers are willing to purchase energy-labelled products (Ottman, Citation2011), with people expressing they are willing to pay a price premium for products generating lower CO2 emissions (Michaud, Llerena, & Joly, Citation2013). Survey studies dominate research into environmental labels in tourism, concluding that tourists favour environmental labels (Eijgelaar et al., Citation2016; Fairweather, Maslin, & Simmons, Citation2005), intend to pay more for such products (do Valle, Pintassilgo, Matias, & André, Citation2012), are more satisfied and express a more favourable perception of service quality and corporate image (Esparon, Gyuris, & Stoeckl, Citation2014). Only two studies investigate actual response to environmental labels, measuring objective knowledge about eco-certified boats (Karlsson & Dolnicar, Citation2016) and observed information search behaviour in a visitor information centre (Reiser & Simmons, Citation2005). Results indicate that environmental labels shown in the brochures at visitor centres do not increase daily brochure uptake (Reiser & Simmons, Citation2005), and eco-certified boats are not in higher demand (Karlsson & Dolnicar, Citation2016).
In the context of carbon labelling menu items in restaurants, anecdotal evidence suggest this may be a successful strategy: at Max restaurants, sales of climate friendly burgers increased by 15% after the introduction of carbon labels in 2008 (Gössling, Citation2011). Empirical studies into the effectiveness of carbon labels on menu item purchase intention and actual purchase, however, do not support this anecdotal evidence: while introducing educational posters and a “climate-friendly choice” label on cafeteria menus increased the number of low CO2 meals purchased (Visschers & Siegrist, Citation2015), such effects were not detected in other studies (Spaargaren et al., Citation2013). Consumers are interested in the menu item with carbon emissions labels (Lassen et al., Citation2016; Pulkkinen, Roininen, Katajajuuri, & Järvinen, Citation2016), but self-reported use of carbon labels is higher than actual purchase behaviour (Spaargaren et al., Citation2013). Diners appreciate the novelty of carbon labelling, but they remain undecided on whether or not carbon labelling drives their future decision making (Filimonau et al., Citation2017). The future value of carbon labelling on restaurant menus requires more research on the effects of the feasibility of carbon labels on food ordering behaviour (Filimonau et al., Citation2017).
Carbon labels versus local farmer label
Local food labels may be more effective in directing menu item choice than carbon labels because consumers find carbon labels difficult to understand (Berry et al., Citation2008; Gadema & Oglethorpe, Citation2011; Gössling & Buckley, Citation2016; Hartikainen, Roininen, Katajajuuri, & Pulkkinen, Citation2014; Schaefer & Blanke, Citation2014; Upham, Dendler, & Bleda, Citation2011). It may be easier for them to relate to benefits to local people than to the abstract concept of contributing to saving the planet (Feucht & Zander, Citation2017). Local labels elicit more perceptions of personal and ethical benefits in consumers than low-CO2 emission labels do (Röös & Tjärnemo, Citation2011; White et al., Citation2009). Local labels make consumers think about farmers communities, the local economy, and their health (Campbell, DiPietro, & Remar, Citation2014; Darby, Batte, Ernst, & Roe, Citation2008; Feldmann & Hamm, Citation2015; Frash, DiPietro, & Smith, Citation2015; Onozaka & McFadden, Citation2011). Consequently, consumers attach higher importance to local food claims than to carbon labels (Onozaka & McFadden, Citation2011), express a higher willingness to pay for such food than they do for low-CO2 labelled foods (Feucht & Zander, Citation2017), and report food provenance as a determining factor of menu choice, while undecided about the impact of carbon labels (Filimonau et al., Citation2017). Consumers feel that local food reduces negative environmental impacts (Campbell et al., Citation2014). Locally produced labels together with carbon labels affect demand toward local apples, and reduce carbon emissions because consumers take local claims into consideration with regard to greenhouse gas emissions (Onozaka, Hu, & Thilmany, Citation2016).
The role of attention
As of today, there is no empirical proof of carbon labels causing more pro-environmental behaviours. For any information (such as a CO2 label) to cause more pro-environmental behaviours, the consumer has to be exposed to the information and process it (attention) (Jun & Vogt, Citation2013) ().
Figure 1. The role of attention in carbon label effectiveness.
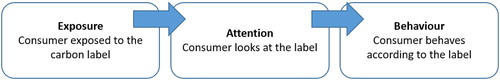
Visual attention to carbon labels is the first step toward carbon label effectiveness. Hierarchy-of-effects communication models posit attention as a prerequisite to any behavioural action. One of the commonly used hierarchy-of-effects communication models is AIDA, suggesting the sequences of Attitude, Interest, Desire, and finally Action (Strong, Citation1925). Attention is not only required to start processing information, but is also necessary to ensure that information continues to be processed for the required period of time (LaBerge, Citation1995). Not surprisingly, therefore, most decision making theories and decision making models view attention as a central construct (Krajbich, Armel, & Rangel, Citation2010; Orquin & Loose, Citation2013; Shimojo, Simion, Shimojo, & Scheier, Citation2003).
Empirical findings from the fields of marketing and psychology suggest: the existence of a strong link between consumer eye movements and underlying cognitive processes (Russo, Citation1978); a strong connection between visual attention to print advertising and brand memory (Pieters, Warlop, & Wedel, Citation2002); and a strong connection between visual attention and decision-making at the point of sale (Atalay, Bodur, & Rasolofoarison, Citation2012; Chandon, Citation2002; Pieters & Warlop, Citation1999; Russo & Leclerc, Citation1994).
Studies in sustainable food also argue the importance of attention. Attention to environmental labels is the first barrier to sustainable food choice (Grunert, Citation2011). Consumers are less likely to pay attention to environmental labels when their understanding of the labels on food packages is lower (Samant & Seo, Citation2016; Van Loo et al., Citation2015). The intangible nature of restaurant menu items worsens this situation. Compared with tangible products (e.g. packaged food), restaurant menu items are physically unobservable at the point of purchase, prompting restaurant customers to search for information or cues that signal the properties of the “final” product (Huang & Lu, Citation2016). Searching for such indicative cues increases cognitive burden (Teevan, Alvarado, Ackerman, & Karger, Citation2004) and customers resort to strategies such as selective attention and heuristics to reduce the cognitive burden (Chajut & Algom, Citation2003; Johnston & Dark, Citation1986). A restaurant menu contains a substantial number of information such as names, images, ingredients, and nutritional information. Such substantial information may limit customers attention to other information (Kim, Tang, Meusel, & Gupta, Citation2018), such as carbon labelling.
Previous studies use self-report measures of attention to specific labels in the menus (Dowray, Swartz, Braxton, & Viera, Citation2013; Yepes, Citation2015) including carbon labels (Filimonau et al., Citation2017; Pulkkinen et al., Citation2016). Yet, self-reported questionnaires about “perceived attention” may lead to incorrect conclusions because self-report measures are based on recall, and recall is an inaccurate measure of attention (Biel, Citation1993). Furthermore, the likelihood of self-reported use of carbon labels to be affected by social desirability bias is high (Juvan & Dolnicar, Citation2016), which can lead to an overestimation of the actual use of carbon labels in purchase behaviour (Karlsson & Dolnicar, Citation2016; Spaargaren et al., Citation2013). Examining objective visual attention is needed as a measure of carbon label processing. This is one of the contributions of the present study.
Methodology
Eye-tracking measures eye movements. Eye movements are proxies of attention and the acquisition of information (Wedel & Pieters, Citation2008). A few eye-tracking studies investigate attention to labels that signal the environmental sustainability of products (Beattie & McGuire, Citation2015; Beattie, McGuire, & Sale, Citation2010; Samant & Seo, Citation2016; Van Loo et al., Citation2015), suggesting that understanding of an importance assigned to sustainability labels lead to higher attention (Samant & Seo, Citation2016; Van Loo et al., Citation2015). In the restaurant menu context, a few studies investigated how restaurant customers read menus using eye-tracking (e.g. Yang, Citation2012). Eye-tracking research on restaurant menu labelling was undertaken primarily in the context of nutritional information (Kim et al., Citation2018; Reale & Flint, Citation2016; Schwebler, Harrington, & Ottenbacher, Citation2018).
We captured visual attention to menu item carbon labels with eye-tracking. Eye-tracking allows measuring visual attention accurately and in real time (Duchowski, Citation2007). We used the desktop mounted eye-tracker Tobii TX-300. We record eye movements at 300 Hz using infrared corneal reflection to measure eye movement. Eye movements consists of saccades and fixations (Duchowski, Citation2007; Rayner, Citation1998). Fixations are relatively stable eye movements lasting for about 200–300 ms. Saccades are quick, short (20–40 ms) movements of the eye, connecting fixations. During saccades, information is not processed (Rayner, Citation1998).
Stimuli
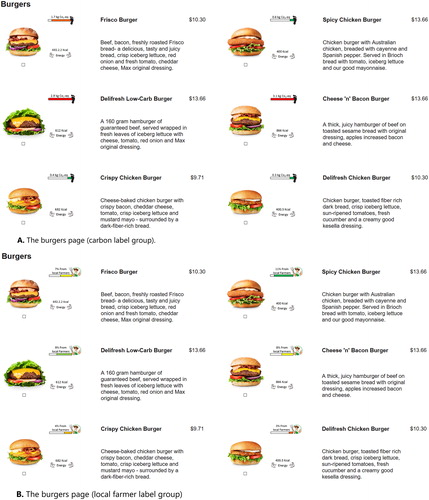
We developed three experimental menus based on food items sold at the fast-food chain Max Burgers (Max-Burgers, Citation2018): one served as the control condition, the second one included a carbon label, and the third one a local farmer label. All menus consisted of three pages (burgers, drinks and desserts) and included six items on the burgers page, four items on the drinks page, and four items on the dessert page. Menu items were described using six characteristics: a name, a description, a picture, energy, a price and – for the experimental conditions – a label (see Appendix, ).
We designed two labels: a carbon and a local farmer label (see ). Both labels contained a tag line, a picture, and a coloured bar. The carbon label contained a tag line, and carbon dioxide values in carbon dioxide kg equivalents using a black footprint picture and coloured bar. We used the actual carbon dioxide numbers from the Max Burger menu (Max-Burgers, Citation2018). A red bar indicated carbon emissions in the relatively high range, and a green bar indicated carbon emissions in the relatively low range. Traffic light colours increase the effectiveness of carbon labels (Thøgersen & Nielsen, Citation2016) because they are commonly understood (Berry et al., Citation2008; Röös & Tjärnemo, Citation2011) and help consumers categorize food options (Cadario & Chandon, Citation2017).
Figure 2. Carbon and local farmer labels.
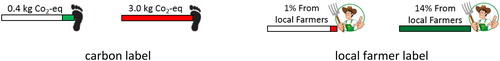
We used the local farmer label for comparison because socially relevant information, such as faces, increases visual attention (Cerf, Harel, Einhaeuser, & Koch, Citation2008; Ro, Russell, & Lavie, Citation2001; Theeuwes & Van der Stigchel, Citation2006). Local food labels can include rich descriptions as well as photographs and other visual illustrations to offer an understanding of the foods to restaurant patrons. Including pictures of farmers in the local food label increases perceived food quality, and leads to positive perceptions of the restaurant (Campbell & DiPietro, Citation2014). The local farmer label indicated the percentage of locally sourced ingredients used in each menu item. The “local” in the local farmer labels indicates that the respective food item was produced within 100 miles of being consumed (Hand & Martinez, Citation2010). We used hypothetical numbers as the percentage of locally sourced ingredients in each menu item. A red coloured bar indicated a relatively low range of locally sourced ingredients, and a green bar a high range (see ). Both carbon and local farmer labels are shown in the eye-tracking computer screen with the size 1920 × 1080 pixels, so the labels are clearly visible on the screen.
Participants
We gathered data by means of eye-tracking, a survey and unstructured interviews from 63 students and staff from an Australian university. We do not expect that using university students and staff as study participants limit the generalisability of results because there is no hypothesis about these groups displaying systematically different attention patterns. It is plausible, however, that people with very specific food requirements would differ significantly in the extent to which they pay attention to menu item labels. Therefore, only people without food-related allergies and requirements (e.g. vegetarian, vegan) not enrolled in a food related program were eligible to participate in the study because those who have allergies and enrolled in a food related program are more likely to read menu more closely, are biasing their food choices. We randomly assigned participants to one of three groups: 20 participants saw the control menu, 22 the carbon labelled menu, and another 20 the local farmer labelled menu. After removing data generated by participants whose eye movements could not be properly calibrated, we had 54 recordings (17 in the control group, 19 in the carbon label group, and 18 in the local farmer group) available for analysis.
On average, our participants dine out in fast-food restaurants once a week. They are between 17 and 67 years old (32 years on average), and 62% are female. Forty per cent prefer chicken and 40% prefer beef when eating out in a fast-food restaurant. Participants’ average weekly spending on dining out is AUD $40. More than half of the participants earn more than AUD $36,400 annually. Ninety per cent of participants hold at least a bachelor degree.
Procedure
Upon entering the laboratory, we provided verbal instructions to participants. We did not inform them that our primary interest was the visual attention they paid to the labels on the burgers page. We informed participants that their eye movements would be captured by a camera while they choose menu items. Then, participants sat in front of the computer screen equipped with the eye-tracker (about 60 cm away). Before they saw any instructions, we calibrated their eye movements using a nine-point calibration process. If the calibration was successful, participants saw one of the menus: unlabelled, carbon labelled, or local farmer labelled. They chose one menu item from each page; three items in total. Participants read the following instruction
You will now see a restaurant menu. Please look at the menu and decide which burger, drink and dessert you want to order. You need to order three items: one burger, one drink, and one dessert. You can select the items using the checkbox below each item. When you have made your decision and ready to order please press F10 to exit. Now, please press F10 to start.
From the three-page menu, they chose one menu item from each page without a time constraint. We recorded eye movements from the moment participants looked at the instruction until they pressed F10 to exit the study.
After the eye-tracking task, study participants responded to the question:
What food characteristic is most important to you when ordering at a restaurant? Please rank the following (description, energy, carbon label/local farmer label, name, picture, price) from 1 to 6 where 1 is the most important and 6 is the least important.
We also asked, “If you are undecided about two menu items, would you use carbon label/local food claim to decide which one to order?”, and “Would it change the likelihood of you ordering more environmentally friendly/locally sourced menu item if it comes with a free drink?” Finally, we asked participants to suggest how environmentally friendly and locally sourced food items could be promoted (“What could restaurants do to get customers choose more environmentally friendly/locally sourced menu items?”).
At the end, participants viewed the recording of their eye movements and commented on what they were thinking while choosing menu items. The entire task took between 15 and 20 min. Study participants were compensated with an AUD $20 shopping voucher.
Areas of interest and visual attention measures
We defined 36 areas of interest that did not overlap. The areas captured each menu characteristic (description, energy, name, label, picture, and price), as well as the entire burgers page. The size of the areas of interest remained constant across all three groups. Gaze data with a minimum duration of 60 milliseconds counts as a fixation. We used Tobii velocity-threshold filter identification to detect the fixation from the raw data (Tobii, Citation2003). We measured the amount of attention using dwell time (Christianson, Loftus, Hoffman, & Loftus, Citation1991; Rosbergen, Pieters, & Wedel, Citation1997). Dwell time (the sum of fixations and saccades on an area of interest) starts with the initial fixation of an area, and ends with the last fixation in the sequence (Tobii, Citation2003). Time to first fixation indicates area of interest attractiveness. This measure starts when participants first see the burgers page of the menu and ends when they first look at the area of interest. Faster times to first area fixation indicates that it has better attention-attracting properties (Byrne, Anderson, Douglass, & Matessa, Citation1999).
Non-parametric Mann–Whitney test determined pairwise differences between experimental groups and control group; p-values beyond .05 are classified as not being statistically significant (n.s.).
Results
Do labels attract visual attention?
Dwell time on the entire burgers page did not differ significantly between the control and the carbon label group (U = 201, z = 1.25, n.s.), and between the control and the local farmer group (U = 219, z = 1.82, n.s.). In both label groups, attention was mainly focused on the description (on average 23.70 and 33.27 s, respectively), followed by the picture (on average, 7.98 and 8.30 s, respectively), and name (on average, 6.16 and 5.93 s, respectively). On average, participants spent 2.63 s (5% of the time required for the choice) on carbon labels, and 2.06 s on local farmer labels (3% of the required time) ().
Table 1. Average dwell time for all areas of interests across three groups.
The Mann–Whitney test shows no significant difference in dwell time to description, picture, name, energy, and price characteristics when participants see the carbon label menu compared to seeing no label. Similarly, dwell time is not significantly shorter when participants see the local farmer menu compared to no label. Therefore, neither carbon nor local farmer labels attract participants’ attention significantly.
shows descriptive label dwell time data. Attention to labels varies substantially, ranging from 0 to 10 s. Despite the small sample, reveals a drop in average dwell time across the sequence of fixated labels. The first fixated experimental label (e.g. a carbon or a local farmer label) indicates that the label is fixated first across all (six) experimental labels in the menu. The sixth fixated label indicates that the label is fixated last across all (six) experimental labels in the menu. On average, dwell time dropped from 0.57 s on the first fixated carbon label to 0.26 s on last fixated carbon label. Similarly, dwell time on the local farmer label dropped from 0.65 to 0.13 s from first to last fixation ().
Table 2. Average dwell time for six labels in order of fixated labels.
Eighty per cent of carbon label group participants looked at all carbon labels for less than 5 s, with 40% only glancing at them (<1 s). On average, these participants dropped their attention to carbon labels from 0.42 s for the first fixated carbon label to almost zero (0.01 s) for the last fixated carbon label. Similarly, 90% of the local farmer group looked at all local farmer labels for less than 5 s, with half only glancing at them (<1 s). Attention to local farmer labels dropped from 0.48 s to almost zero (0.05 s) for these participants.
Participants commented on their lack of attention as follows:
“The carbon footprint, to be honest, I glanced at it, but I did not know really what it means, I looked at the descriptions and the images” (male, 41 years old, carbon label group, dwell time: 0.12 s).
“When I looked at them, I was not sure what they are telling me, and did not necessarily do a comparison between them, I did not even notice their colour, that I am noticing now, because I did not know about them, now it is very obvious but at the start it was not clear to me what it was telling me” (female, 32 years old, carbon label group, dwell time: 0.73 s).
Participants also did not attach much importance to carbon and local farmer labels for their food choice:
“For me it had no impact what I was actually going to choose. It is interesting, but it is not interesting enough that it would have impact my decision” (female, 30 years old, carbon label group, dwell time: 2.32 s).
“At first I noticed them but then did not really keep paying attention to them, it was not interesting information comparing to the rest” (male, 30 years old, carbon label group dwell time: 2.22 s).
“It does not influence my purchasing much. It was nice to look at but … I definitely will go with what … I thought was probably healthier” (female, 26 years old, local farmer group, dwell time: 1.53 s).
Neither label grabbed participants’ attention quickly. Participants did not look at the labels first. Out of 19 fixations from the carbon label group and 18 fixations from the local farmer group, only four and two fixations were immediately made on carbon and the local farmer labels, respectively. On average, participants looked at carbon labels 5.5 s after seeing the burger page. Participants looked at local farmer labels 10 s after seeing the burger page:
“I saw them but I did not make the connection until I read the questions because I am so unused to seeing it [carbon label] that I did not even notice the colours, not even realize it, I know what it means but I did not realize while ordering, I just read the ingredients” (female, 32 years old, carbon label group, dwell time: 0.13 s).
“The local farmer label did not register with me, so if it is going to be in there, there needs to be much more emphasis on what it is about. For me to attract my eye and to be able to register. And then it is going to be meaningful … you try to get the basics … and not who is going to supply it, actually it is about what it taste like (male, 67 years old, local farmer group, dwell time: 0 s).
Only four participants looked at all six carbon labels for more than five seconds and continuously looked at them. These participants were aware of and interested in environmental aspects of food consumption:
“I am teacher in geography, I always try to convince my student to choose chicken instead of beef because of the CO2. I know what it means, I mean 3.1 kg – I know exactly what that means. I know the colour red when it came not to do and green probably mean you got a choice. I have a big book about the carbon footprint I know about it. It was my first time seeing them, I never saw them before in the menu, I was surprised because I have never seen them before. It was quite interesting because they can influence your decision” (male, 33 years old, carbon label group, dwell time: 8.18 s).
“This is the first time I realized what they are, so I saw them on the first one, and I was like ‘I do not know what that means’, and then I was ‘aaaw that is the carbon footprint, oh that is excellent’. It was very obvious that the chicken is the better option …I immediately saw all the beef options were much worse, that is easy…. I do not have much idea how they have direct impact on me, but it is very easy to see to compare to each other, that is very useful. If it is red, that’s bad” (female, 36 years old, carbon label group, dwell time: 9.06 s).
Burger choices
Compared with the no label menu, carbon labels increased the choice of Crispy Chicken Burgers (green carbon label) by 8% (from 24% to 32%) and Spicy Chicken Burgers (green carbon label) by 10% (from 6% to 16%) and reduced the choice of Cheese “n” Bacon Burger (red carbon label) by 24% (from 29% to 5%). However, the choice of the Deli Fresh Chicken Burger (green carbon label) also dropped by 8% (24% to 16%) and the choice of the Frisco Burger (red carbon label) increased by 14% (from 18% to 32%). The same holds for local farmer labels. Local farmer labels increased choice of the Deli Fresh Low Carb Burger (green locally sourced) by 11% (from 0 to 11%) and reduced choice of the Deli Fresh Chicken Burger (red locally sourced) by 18% (from 24% to 6%). However, the choice of the Frisco Burger (yellow locally sourced) was not reduced (). Consequently, both carbon and local farmer labels did not influence burger choices.
Table 3. Number of times (%) each burger was chosen across experimental and control groups.
Chi-square tests shows that the relationship between burger choice and looking behaviour is not statistically significant (p-value larger than 0.05), indicating that they are not related. It means that the proportion of respondents that looked at the labels and the proportion that did not look in the two choice conditions (chosen/nor chosen) is not significantly different. In 26% and 33% of cases, participants did not even look at the labels once, but they chose the corresponding burgers. Additionally, most of the participants (60%) looked at the carbon labels at least once but did not choose the corresponding burger (). Therefore, we can conclude that looking at the labels did not impact burger choice.
Table 4. Burger choice and attention to the carbon and local farmer labels.
Discussion and conclusions
A wide range of carbon labels has been developed in all tourism sub-sectors, and their persuasiveness has been tested by investigating if consumers appreciate the information communicated to them, and if they understand what their behaviour would have to look like in view of the information provided on the label (Gössling & Buckley, Citation2016). As highlighted in previous research (Eijgelaar et al., Citation2016), effective labels need to be present and visible when the purchase decision is being made. But even if labels are present and visible during decision making, it cannot be assumed that consumers pay attention to such labels. In view of the gap between expressed attitudes and displayed behaviour gap in areas affected by social desirability bias, such as sustainable tourism (Juvan & Dolnicar, Citation2014), Eijgelaar et al. (Citation2016) recommend a replication of their research in real settings to learn about actual behaviour, rather than limiting insights to stated behavioural intentions. Our study takes one step in this direction: it examines attention to carbon labels while making menu choice decisions in a simulated fast-food restaurant. This study also compares attention to local farmer labels with attention to carbon labels. This is important because attracting attention to carbon labels on the menu is a prerequisite to influencing environmentally friendly menu choices.
Results show that carbon labels are not successful in attracting attention. On average, participants spend only 5% of their time on carbon labels, and do not continually look at them, indicating that labels play only a minor role in menu item choice. Only 20% of participants (four people) looked at carbon labels continually. This percentage is lower than that reported by Spaargaren et al. (Citation2013), where 70% of participants stated noticing carbon dioxide information during the experiment.
We also find that the carbon labels are not what participants look at first. The carbon label was fixated first by four participants. This small group was aware of and interested in environmental aspects of food choice. This result corroborates Beattie et al.’s (Citation2010) findings that carbon labels only affect choice if labels grab consumers’ attention straight way, within the first few seconds. If this is not the case, the insights relating to acceptance and appreciation of the message contained in the label are meaningless (Wedel & Pieters, Citation2008). Consistent with Campbell-Arvai, Arvai, and Kalof’s (2014) finding, providing information about negative environmental consequences of specific food items does not influence the choice of environmentally friendly menu options. Providing such information may be helpful to educate consumers about the environmental impact of food consumption, but it is not effective in encouraging behavioural change (Campbell-Arvai et al., Citation2014). Our findings confirm that communication of environmental information does not necessarily make the issue of sustainability relevant to decision-making (Font & McCabe, Citation2017).
Our study shows that local farmer labels do not attract more attention than carbon labels. Although participants stated they knew what local farmer labels meant, they did not pay significantly more attention to them. Participants spent only 3% of their time on local farmer labels, and did not continually look at them. Only three participants looked at local farmer labels continually. Our results contradict previous findings about the superior effectiveness of local claims compared to climate-friendliness labels (Feucht & Zander, Citation2017; Onozaka & McFadden, Citation2011). Consistent with Lu and Chi’s (Citation2018) findings, providing local producers’ information does not necessary increase purchase intention, and interacts with diner type (traveller/residence) and the level of involvement with local food.
Cross tabulations between attention to the labels and burger choice show that neither of those labels affected burger choice. One third of respondents chose their burger without looking at the labels. Those who looked at the labels did not necessary chose the corresponding burger. These results confirm insights gained during the interview: participants only glanced at the labels, but they did not compare them to influence their choice.
Participants in our study suggested restaurants should use carbon labels more frequently on their menus to increase awareness of carbon labels. Even participants familiar with labels admitted not paying attention to carbon labels when choosing what to order. Half of the participants indicated they would not even use them if they were undecided between two items. Participants suggested restaurants could increase the proportion of environmentally friendly food chosen by providing direct financial benefits such as special offers, lower prices, discounts, sample tastings, or stamp collection cards. Ninety per cent of participants in the carbon label group indicated that a free drink with an environmentally friendly food item would increase their likelihood of ordering more environmentally friendly item. Carbon footprint labelling does not signal personal consumer benefits, and – as such – does not trigger self-interest related to financial benefit or personal concern to encourage pro-environmental behaviour (Cohen & Vandenbergh, Citation2012).
The present study has a number of limitations. The sample size – while typical for eye-tracking studies – is relatively small. This is due to the time-consuming nature of collecting eye-tracking data. Small sample sizes reduce the power of statistical tests. Here, we use eye-tracking as a qualitative and exploratory tool to offer insights about the way restaurant patrons notice carbon labels on the menu. Eye movements offer accurate data on what people look at, but they can never explain why people look at it or whether they actually process it (Russo, Citation1978). It is for this reason that we asked participants to talk about their thoughts as they were choosing items from the menu to get some insight about the possible reasons for (in)attention. We did not measure actual choice; we conducted our study in the laboratory. Even in a laboratory, eye movements do constitute actual behaviour (visual attention), but the food choices made are not actual food choices and may differ from those people would make in a restaurant. We also did not ask participants how hungry they were before choosing the menu item. This could impact what information participants pay attention to. Finally, participants’ food preferences for either chicken or beef may impact their attention to the burger options and the associated labels. Accepting only study participants who prefer only chicken (or beef) in future studies could resolve this limitation. The problem with this approach, however, is that the variability of carbon emissions would be reduced significantly, to the point where the difference across menu options may be indistinguishable.
Overall, our findings indicate that carbon labels on restaurant menus do not attract much attention, suggesting that they are unlikely to affect menu item choice. Effectiveness could be increased by limiting carbon labels to a few menu items (Berry et al., Citation2008; Cohen & Vandenbergh, Citation2012). Moreover, carbon labels need to be more psychologically salient to attract consumers’ attention (Beattie, Citation2012). Using signals like “danger,” putting carbon labels in more visible places (e.g. on the front of products in supermarket shopping context), and increasing the size of the labels can impact the automatic system of decision making by sending the implicit message that the information is important (Beattie, Citation2012). Larger labels – irrespective of content – attract more attention (Orquin, Scholderer, & Jeppesen, Citation2012). Testing the effectiveness of a range of carbon label formats, and changing the position of labels to increase attention represents another line of possible future investigation. Replication studies would be of great value, as they would permit testing of generalisabilty of findings across a range of subsamples of the general population, as well as among patrons who do have special food requirements or preferences, since the type of product is likely to have an influence on the visual attention behaviour of consumers when making food choices (Van Loo et al., Citation2015).
Disclosure statement
No potential conflict of interest was reported by the authors.
Additional information
Funding
Notes on contributors
Nazila Babakhani
Nazila Babakhani is a PhD student at The University of Queensland. Nazila holds Bachelor’s degree in Mining Engineering and Master’s degree in Business Administration (Marketing). Nazila’s research interests are sustainable tourism and tourism marketing.
Andy Lee
Dr Andy Lee is specialized in the field of hotel and hospitality research. His current work has been on information technology in the hotel and restaurant industries including social media and menu presentation. Dr Lee is working on wellbeing and environmental psychology including the effect of colour on travellers and hotel employees.
Sara Dolnicar
Professor Sara Dolnicar’s main research interest is measurement and methodology in empirical tourism research. Sara has applied her work to a number of areas, including tourism marketing, sustainable tourism and destination image studies.
References
- Albright, C. L., Flora, J. A., & Fortmann, S. P. (1990). Restaurant menu labeling: Impact of nutrition information on entree sales and patron attitudes. Health Education Quarterly, 17(2), 157–167. doi:10.1177/109019819001700203
- Anderson, L., Mastrangelo, C., Chase, L., Kestenbaum, D., & Kolodinsky, J. (2013). Eco-labeling motorcoach operators in the North American travel tour industry: Analyzing the role of tour operators. Journal of Sustainable Tourism, 21(5), 750–764. doi:10.1080/09669582.2012.709859
- Araña, J. E., & León, C. J. (2016). Are tourists animal spirits? Evidence from a field experiment exploring the use of non-market based interventions advocating sustainable tourism. Journal of Sustainable Tourism, 24(3), 430–445. doi:10.1080/09669582.2015.1101128
- Atalay, A. S., Bodur, H. O., & Rasolofoarison, D. (2012). Shining in the center: Central gaze cascade effect on product choice. Journal of Consumer Research, 39(4), 848–866. doi:10.1086/665984
- Beattie, G. (2012). Psychological effectiveness of carbon labelling. Nature Climate Change, 2(4), 214–217. doi:10.1038/nclimate1468
- Beattie, G., & McGuire, L. (2015). Harnessing the unconscious mind of the consumer: How implicit attitudes predict pre-conscious visual attention to carbon footprint information on products. Semiotica, 2015(204), 253–290. doi:10.1515/sem-2014-0079
- Beattie, G., McGuire, L., & Sale, L. (2010). Do we actually look at the carbon footprint of a product in the initial few seconds? An experimental analysis of unconscious eye movements. International Journal of Environmental, Cultural, Economic & Social Sustainability, 6(1), 47–65. doi:10.18848/1832-2077/CGP/v06i01/54719
- Berry, T., Crossley, D., & Jewell, J. (2008). Check-out carbon: The role of carbon labelling in delivering a low-carbon shopping basket. Retrieved from https://www.criticaleye.com/inspiring/insights-servfile.cfm?id=830&view=1
- Biel, A. L. (1993). Ad research in the US-hurdle or help? A brief review of the state of the art. Admap, pp. 27–29.
- Bjørner, T. B., Hansen, L. G., & Russell, C. S. (2004). Environmental labeling and consumers’ choice – An empirical analysis of the effect of the Nordic Swan. Journal of Environmental Economics and Management, 47(3), 411–434.
- Buckley, R. (2002). Tourism ecolabels. Annals of Tourism Research, 29(1), 183–208. doi:10.1016/S0160-7383(01)00035-4
- Buckley, R. (2012). Sustainability reporting and certification in tourism. Tourism Recreation Research, 37(1), 85–90. doi:10.1080/02508281.2012.11081692
- Buckley, R. (2013). Sustainability: Three reasons for eco-label failure. Nature, 500(7461), 151. doi:10.1038/500151c
- Byrne, M., Anderson, J., Douglass, S., & Matessa, M. (1999). Eye tracking the visual search of click-down menus. Paper presented at the Human Factors in Computing Systems: CHI ’99, Pittsburgh, Pennsylvania, USA.
- Cadario, R., & Chandon, P. (2017). Which healthy eating nudges work best? A meta-analysis of behavioral interventions in field experiments (Working Paper Report, Fontainebleau, France).
- Chajut, E., & Algom, D. (2003). Selective attention improves under stress: Implications for theories of social cognition. Journal of Personality and Social Psychology, 85(2), 231–248. doi:10.1037/0022-3514.85.2.231
- Campbell-Arvai, V., Arvai, J., & Kalof, L. (2014). Motivating sustainable food choices: The role of nudges, value orientation, and information provision. Environment and Behavior, 46(4), 453–475. doi:10.1177/0013916512469099
- Campbell, J. M., & DiPietro, R. B. (2014). Sign of the times: Testing consumer response to local food signage within a casual dining restaurant. Journal of Retailing and Consumer Services, 21(5), 812–823. doi:10.1016/j.jretconser.2014.06.010
- Campbell, J., DiPietro, R. B., & Remar, D. (2014). Local foods in a university setting: Price consciousness, product involvement, price/quality inference and consumer's willingness-to-pay. International Journal of Hospitality Management, 42, 39–49. doi:10.1016/j.ijhm.2014.05.014
- Cerf, M., Harel, J., Einhaeuser, W., & Koch, C. (2008). Predicting human gaze using low-level saliency combined with face detection. Paper presented at the Advances in Neural Information Processing Systems Conference, Cambridge, MA.
- Cerqua, A. (2017). The signalling effect of eco-labels in modern coastal tourism. Journal of Sustainable Tourism, 25(8), 1159–1180. doi:10.1080/09669582.2016.1257014
- Chandon, P. (2002). Do we know what we look at? An eye-tracking study of visual attention and memory for brands at the point of purchase (Working Paper Report, Fontainebleau, France).
- Christianson, S.-Å., Loftus, E. F., Hoffman, H., & Loftus, G. R. (1991). Eye fixations and memory for emotional events. Journal of Experimental Psychology: Learning, Memory, and Cognition, 17(4), 693–701. doi:10.1037//0278-7393.17.4.693
- Cohen, M. A., & Vandenbergh, M. P. (2012). The potential role of carbon labeling in a green economy. Energy Economics, 34, S53–S63. doi:10.1016/j.eneco.2012.08.032
- Darby, K., Batte, M. T., Ernst, S., & Roe, B. (2008). Decomposing local: A conjoint analysis of locally produced foods. American Journal of Agricultural Economics, 90(2), 476–486. doi:10.1111/j.1467-8276.2007.01111.x
- de Vries, M., & de Boer, I. J. M. (2010). Comparing environmental impacts for livestock products: A review of life cycle assessments. Livestock Science, 128(1–3), 1–11. doi:10.1016/j.livsci.2009.11.007
- do Valle, P. O., Pintassilgo, P., Matias, A., & André, F. (2012). Tourist attitudes towards an accommodation tax earmarked for environmental protection: A survey in the Algarve. Tourism Management, 33(6), 1408–1416. doi:10.1016/j.tourman.2012.01.003
- Dowray, S., Swartz, J. J., Braxton, D., & Viera, A. J. (2013). Potential effect of physical activity based menu labels on the calorie content of selected fast food meals. Appetite, 62, 173–181.
- Duchowski, A. (2007). Eye tracking methodology: Theory and practice (3rd ed.). United Kingdom: Springer.
- Eijgelaar, E., Nawijn, J., Barten, C., Okuhn, L., & Dijkstra, L. (2016). Consumer attitudes and preferences on holiday carbon footprint information in the Netherlands. Journal of Sustainable Tourism, 24(3), 398–411. doi:10.1080/09669582.2015.1101129
- Esparon, M., Gyuris, E., & Stoeckl, N. (2014). Does ECO certification deliver benefits? An empirical investigation of visitors’ perceptions of the importance of ECO certification's attributes and of operators’ performance. Journal of Sustainable Tourism, 22(1), 148–169. doi:10.1080/09669582.2013.802325
- Fairweather, J. R., Maslin, C., & Simmons, D. G. (2005). Environmental values and response to ecolabels among international visitors to New Zealand. Journal of Sustainable Tourism, 13(1), 82–98. doi:10.1080/17501220508668474
- Feldmann, C., & Hamm, U. (2015). Consumers’ perceptions and preferences for local food: A review. Food Quality and Preference, 40, 152–164. doi:10.1016/j.foodqual.2014.09.014
- Feucht, Y., & Zander, K. (2017). Consumers' willingness to pay for climate-friendly food in European countries. Paper presented at the System Dynamics and Innovation in Food Networks.
- Filimonau, V., Lemmer, C., Marshall, D., & Bejjani, G. (2017). Nudging’ as an architect of more responsible consumer choice in food service provision: The role of restaurant menu design. Journal of Cleaner Production, 144, 161–170. doi:10.1016/j.jclepro.2017.01.010
- Flybe. (2018). Eco-labelling scheme. Retrieved from https://www.flybe.com/corporate/sustainability/eco-labelling-scheme/
- Font, X., & Buckley, R. (2001). Tourism ecolabelling certification and promotion of sustainable management. Wallingford, CT: CAB International.
- Font, X., & McCabe, S. (2017). Sustainability and marketing in tourism: Its contexts, paradoxes, approaches, challenges and potential. Journal of Sustainable Tourism, 25(7), 869–883. doi:10.1080/09669582.2017.1301721
- Frash, R. E., DiPietro, R., & Smith, W. (2015). Pay more for mclocal? Examining motivators for willingness to pay for local food in a chain restaurant setting. Journal of Hospitality Marketing & Management, 24(4), 411–434. doi:10.1080/19368623.2014.911715
- Fuerte Hoteles. (2018). Huella de carbono. Retrieved from http://www.fuertehoteles.com/grupo-el-fuerte/huella-de-carbono/
- Gadema, Z., & Oglethorpe, D. (2011). The use and usefulness of carbon labelling food: A policy perspective from a survey of UK supermarket shoppers. Food Policy, 36(6), 815–822. doi:10.1016/j.foodpol.2011.08.001
- Garnett, T. (2011). Where are the best opportunities for reducing greenhouse gas emissions in the food system (including the food chain)? Food Policy, 36, S23–S32. doi:10.1016/j.foodpol.2010.10.010
- Gössling, S. (2011). Mitigation: Management. In S. Gössling (Ed.), Carbon management in tourism mitigating the impacts on climate change (pp. 154–244). London: Routledge.
- Gössling, S., & Buckley, R. (2016). Carbon labels in tourism: Persuasive communication? Journal of Cleaner Production, 111, 358–369. doi:10.1016/j.jclepro.2014.08.067
- Gössling, S., & Peeters, P. (2015). Assessing tourism's global environmental impact 1900–2050. Journal of Sustainable Tourism, 23(5), 639–659. doi:10.1080/09669582.2015.1008500
- Grunert, K., G. (2011). Sustainability in the food sector: A consumer behaviour perspective. International Journal on Food System Dynamics, 2(3), 207–218.
- Guéguen, N., Jacob, C., & Ardiccioni, R. (2012). Effect of watermarks as visual cues for guiding consumer choice: An experiment with restaurant menus. International Journal of Hospitality Management, 31(2), 617–619. doi:10.1016/j.ijhm.2011.04.008
- Hallström, E., Carlsson-Kanyama, A., & Börjesson, P. (2015). Environmental impact of dietary change: A systematic review. Journal of Cleaner Production, 91, 1–11. doi:10.1016/j.jclepro.2014.12.008
- Hand, M. S., & Martinez, S. (2010). Just what does local mean. Choices, 25(1), 13–18.
- Hartikainen, H., Roininen, T., Katajajuuri, J.-M., & Pulkkinen, H. (2014). Finnish consumer perceptions of carbon footprints and carbon labelling of food products. Journal of Cleaner Production, 73, 285–293. doi:10.1016/j.jclepro.2013.09.018
- Hou, Y., Yang, W., & Sun, Y. (2017). Do pictures help? The effects of pictures and food names on menu evaluations. International Journal of Hospitality Management, 60, 94–103. doi:10.1016/j.ijhm.2016.10.008
- Huang, L., & Lu, J. (2016). The impact of package color and the nutrition content labels on the perception of food healthiness and purchase intention. Journal of Food Products Marketing, 22(2), 191–218. doi:10.1080/10454446.2014.1000434
- Johnston, W. A., & Dark, V. J. (1986). Selective attention. Annual Review of Psychology, 37(1), 43–75.
- Jun, S. H., & Vogt, C. (2013). Travel information processing applying a dual-process model. Annals of Tourism Research, 40, 191–212.
- Juvan, E., & Dolnicar, S. (2014). The attitude–behaviour gap in sustainable tourism. Annals of Tourism Research, 48, 76–95.
- Juvan, E., & Dolnicar, S. (2016). Measuring environmentally sustainable tourist behaviour. Annals of Tourism Research, 59, 30–44.
- Karlsson, L., & Dolnicar, S. (2016). Does eco certification sell tourism services? Evidence from a quasi-experimental observation study in Iceland. Journal of Sustainable Tourism, 24(5), 694–714.
- Kim, E., Tang, L., Meusel, C., & Gupta, M. (2018). Optimization of menu-labeling formats to drive healthy dining: An eye tracking study. International Journal of Hospitality Management, 70, 37–48.
- Kozak, M., & Nield, K. (2004). The role of quality and eco-labelling systems in destination benchmarking. Journal of Sustainable Tourism, 12(2), 138–148.
- Krajbich, I., Armel, C., & Rangel, A. (2010). Visual fixations and the computation and comparison of value in simple choice. Nature Neuroscience, 13(10), 1292–1298.
- LaBerge, D. L. (1995). Attentional processing: The brain's art of mindfulness. Cambridge, MA: Harvard University Press.
- Lassen, A. D., Lehmann, C., Andersen, E. W., Werther, M. N., Thorsen, A. V., Trolle, E., … Tetens, I. (2016). Gender differences in purchase intentions and reasons for meal selection among fast food customers – Opportunities for healthier and more sustainable fast food. Food Quality and Preference, 47, 123–129. doi:10.1016/j.foodqual.2015.06.011
- Lenzen, M., Sun, Y.-Y., Faturay, F., Ting, Y.-P., Geschke, A., & Malik, A. (2018). The carbon footprint of global tourism. Nature Climate Change, 8(6), 522–528.
- Lu, L., & Chi, C. G.-Q. (2018). Examining diners’ decision-making of local food purchase: The role of menu stimuli and involvement. International Journal of Hospitality Management, 69, 113–123.
- Lucas, K., Brooks, M., Darnton, A., & Jones, J. E. (2008). Promoting pro-environmental behaviour: Existing evidence and policy implications. Environmental Science & Policy, 11(5), 456–466.
- Marlow, H. J., Hayes, W. K., Soret, S., Carter, R. L., Schwab, E. R., & Sabate, J. (2009). Diet and the environment: Does what you eat matter?. The American Journal of Clinical Nutrition, 89(5), 1699S–1703S. doi:10.3945/ajcn.2009.26736Z
- Max-Burgers. (2018). Klimatmarkt meny (carbon-labelled menu). Retrieved from www.max.se/sv/Ansvar/Klimatdeklaration/
- Michaud, C., Llerena, D., & Joly, I. (2013). Willingness to pay for environmental attributes of non-food agricultural products: A real choice experiment. European Review of Agricultural Economics, 40(2), 313–329.
- Onozaka, Y., Hu, W., & Thilmany, D. D. (2016). Can eco-labels reduce carbon emissions? Market-wide analysis of carbon labeling and locally grown fresh apples. Renewable Agriculture and Food Systems, 31(2), 122–138.
- Onozaka, Y., & McFadden, D. T. (2011). Does local labeling complement or compete with other sustainable labels? A conjoint analysis of direct and joint values for fresh produce claim. American Journal of Agricultural Economics, 93(3), 693–706.
- Orquin, J. L., & Loose, S. M. (2013). Attention and choice: A review on eye movements in decision making. Acta Psychologica, 144(1), 190–206. doi:10.1016/j.actpsy.2013.06.003
- Orquin, J. L., Scholderer, J., & Jeppesen, H. B. (2012). What you see is what you buy: How saliency and surface size of packaging elements affect attention and choice. Paper presented at the Society for Advancement of Behavioural Economics, Granada, Spain.
- Ottman, J. (2011). The new rules of green marketing. San Francisco, CA: Berrett-Koehler.
- Pieters, R., & Warlop, L. (1999). Visual attention during brand choice: The impact of time pressure and task motivation. International Journal of Research in Marketing, 16(1), 1–16.
- Pieters, R., Warlop, L., & Wedel, M. (2002). Breaking through the clutter: Benefits of advertisement originality and familiarity for brand attention and memory. Management Science, 48(6), 765–781.
- Pulkkinen, H., Roininen, T., Katajajuuri, J.-M., & Järvinen, M. (2016). Development of a climate choice meal concept for restaurants based on carbon footprinting. The International Journal of Life Cycle Assessment, 21(5), 621–630.
- Rayner, K. (1998). Eye movements in reading and information processing: 20 years of research. Psychological Bulletin, 124(3), 372–422. doi:10.1037/0033-2909.124.3.372
- Reale, S., & Flint, S. W. (2016). The impact of menu label design on visual attention, food choice and recognition: An eye tracking study. Journal of Sensory Studies, 31(4), 328–340.
- Reiser, A., & Simmons, D. G. (2005). A quasi-experimental method for testing the effectiveness of ecolabel promotion. Journal of Sustainable Tourism, 13(6), 590–616.
- Ro, T., Russell, C., & Lavie, N. (2001). Changing faces: A detection advantage in the flicker paradigm. Psychological Science, 12(1), 94–99.
- Roberto, C. A., Larsen, P. D., Agnew, H., Baik, J., & Brownell, K. D. (2010). Evaluating the impact of menu labeling on food choices and intake. American Journal of Public Health, 100(2), 312–318. doi:10.2105/AJPH.2009.160226
- Röös, E., & Tjärnemo, H. (2011). Challenges of carbon labelling of food products: A consumer research perspective. British Food Journal, 113(8), 982–996.
- Rosbergen, E., Pieters, R., & Wedel, M. (1997). Visual attention to advertising: A segment-level analysis. Journal of Consumer Research, 24(3), 305–314.
- Rosenthal, E. (2009). To cut global warming, Swedes study their plates. The New York Times. Retrieved from https://www.nytimes.com/2009/10/23/science/earth/23degrees.html
- Russo, J. E. (1978). Eye fixations can save the world: A critical evaluation and a comparison between eye fixations and other information processing methodologies. Advances in Consumer Research, 5(1), 561–570.
- Russo, J. E., & Leclerc, F. (1994). An eye-fixation analysis of choice processes for consumer nondurables. Journal of Consumer Research, 21(2), 274–290.
- Samant, S. S., & Seo, H.-S. (2016). Effects of label understanding level on consumers’ visual attention toward sustainability and process-related label claims found on chicken meat products. Food Quality and Preference, 50, 48–56. doi:10.1016/j.foodqual.2016.01.002
- Schaefer, F., & Blanke, M. (2014). Opportunities and challenges of carbon footprint, climate or CO2 labelling for horticultural products. Erwerbs-Obstbau, 56(2), 73–80. doi:10.1007/s10341-014-0206-6
- Schwebler, S. A., Harrington, R. J., & Ottenbacher, M. C. (2018). Calorie disclosure and color-coding on QSR menus: A multi-method approach using eye-tracking technology, grouping and surveys. International Journal of Hospitality & Tourism Administration. doi:10.1080/15256480.2018.1429339
- Shimojo, S., Simion, C., Shimojo, E., & Scheier, C. (2003). Gaze bias both reflects and influences preference. Nature Neuroscience, 6(12), 1317–1322. doi:10.1038/nn1150
- Spaargaren, G., van Koppen, C. S. A., Janssen, A. M., Hendriksen, A., & Kolfschoten, C. J. (2013). Consumer responses to the carbon labelling of food: A real life experiment in a canteen practice. Sociologia Ruralis, 53(4), 432–453. doi:10.1111/soru.12009
- Stehfest, E., Bouwman, L., Vuuren, D., Elzen, M., Eickhout, B., & Kabat, P. (2009). Climate benefits of changing diet. Climatic Change, 95(1–2), 83–102. doi:10.1007/s10584-008-9534-6
- Strong, E. K. (1925). Theories of selling. Journal of Applied Psychology, 9(1), 75–86. doi:10.1037/h0070123
- Teevan, J., Alvarado, C., Ackerman, M. S., & Karger, D. R. (2004). The perfect search engine is not enough: A study of orienteering behavior in directed search. In Proceedings of the SIGCHI Conference on Human Factors in Computing Systems (pp. 415–422).
- Teisl, M. F., Roe, B., & Hicks, R. L. (2002). Can Eco-labels tune a market? Evidence from Dolphin-Safe labeling. Journal of Environmental Economics and Management, 43(3), 339–359. doi:10.1006/jeem.2000.1186
- Telfer, D. J., & Wall, G. (2000). Strengthening backward economic linkages: Local food purchasing by three Indonesian hotels. Tourism Geographies, 2(4), 421–447. doi:10.1080/146166800750035521
- Theeuwes, J., & Van der Stigchel, S. (2006). Faces capture attention: Evidence from inhibition of return. Visual Cognition, 13(6), 657–665. doi:10.1080/13506280500410949
- Thøgersen, J., & Nielsen, K. S. (2016). A better carbon footprint label. Journal of Cleaner Production, 125, 86–94. doi:10.1016/j.jclepro.2016.03.098
- Tilman, D., & Clark, M. (2014). Global diets link environmental sustainability and human health. Nature, 515(7528), 518–522. doi:10.1038/nature13959
- Tobii. (2003). Tobii technology user manual. Retrieved from http://www.tobiipro.com/siteassets/tobii-pro/user-manuals/tobii-pro-tx300-eye-tracker-user-manual.pdf
- United Nations Environment Programme (UNEP). (2007). Global environment outlook (GEO4): Environment for development. Nairobi: UNEP.
- Upham, P., Dendler, L., & Bleda, M. (2011). Carbon labelling of grocery products: Public perceptions and potential emissions reductions. Journal of Cleaner Production, 19(4), 348–355.
- Van Loo, E. J., Caputo, V., Nayga, R. M., Seo, H.-S., Zhang, B., & Verbeke, W. (2015). Sustainability labels on coffee: Consumer preferences, willingness-to-pay and visual attention to attributes. Ecological Economics, 118, 215–225. doi:10.1016/j.ecolecon.2015.07.011
- Van Loon, R., & Rouwendal, J. (2017). Travel purpose and expenditure patterns in city tourism: Evidence from the Amsterdam Metropolitan Area. Journal of Cultural Economics, 41(2), 109–127. doi:10.1007/s10824-017-9293-1
- Vanclay, J. K., Shortiss, J., Aulsebrook, S., Gillespie, A. M., Howell, B. C., Johanni, R., … Yates, J. (2011). Customer response to carbon labelling of groceries. Journal of Consumer Policy, 34(1), 153–160. doi:10.1007/s10603-010-9140-7
- Vandenbergh, M. P., Dietz, T., & Stern, P. C. (2011). Time to try carbon labelling. Nature Climate Change, 1(1), 4–6. doi:10.1038/nclimate1071
- Visschers, V. H. M., & Siegrist, M. (2015). Does better for the environment mean less tasty? Offering more climate-friendly meals is good for the environment and customer satisfaction. Appetite, 95, 475–483. doi:10.1016/j.appet.2015.08.013
- Wansink, B., Painter, J., & van Ittersum, K. (2001). Descriptive menu labels' effect on sales. Cornell Hotel and Restaurant Administration Quarterly, 42(6), 68–72. doi:10.1177/0010880401426008
- Wedel, M., & Pieters, R. (2008). A review of eye-tracking research in marketing. In N. K. Malhutra (Ed.), Review of marketing research (pp. 123–147). Armonk, NY: Sharpe.
- White, P., Sharp, V., Darnton, A., Downing, P., Inman, A., Strange, K., & Garnett, T. (2009). Food synthesis review summary report. London: Social Marketing Practice et al.
- Yang, S. S. (2012). Eye movements on restaurant menus: A revisitation on gaze motion and consumer scanpaths. International Journal of Hospitality Management, 31(3), 1021–1029. doi:10.1016/j.ijhm.2011.12.008
- Yepes, M. F. (2015). Mobile tablet menus: Attractiveness and impact of nutrition labeling formats on millennials’ food choices. Cornell Hospitality Quarterly, 56(1), 58–67. doi:10.1177/1938965514546371
- Zielinski, S., & Botero, C. (2015). Are eco-labels sustainable? Beach certification schemes in Latin America and the Caribbean. Journal of Sustainable Tourism, 23(10), 1550–1572. doi:10.1080/09669582.2015.1047376
Appendix
Figure A1. (A) The burgers page (carbon label group). (B) The burgers page (local farmer label group).