
Abstract
Two algal cultures, TvB and SH, were isolated from extreme habitats along the Syrian-African rift Valley (Israel). These cultures were initially identified as Chlorella spp. according to their morphology and lack of bristles, but following molecular phylogenetic analyses, re-identified as Micractinium spp. closely related to Chlorella. The strains were subjected to a bi-factorial study in the search for algae that grow well at elevated temperatures and salinities for future biotechnological uses. Cell density (CD) and optical density (OD) were measured for each strain at three temperatures: 35, 40 and 45ºC, and five salinities of seawater (SW): 34.8 ppt (100% SW), 26.5 ppt (75% SW), 18.3 ppt (50% SW) 10 ppt (25% SW) and 1.8 ppt (0% SW). Both strains grew best at 35–40ºC and at 0–50% SW. Increased salinity enhanced temperature tolerance to 45ºC, particularly for strain TvB. At 45ºC, following a short initial growth spurt, cultures underwent a lag period of c. 7 days, followed by a significant growth phase. During the lag period, algae underwent a substantial increase in average cell diameter (ACD). These enlarged or gigantic cells with diameters of up to ~20 μm, produced and eventually released multiple autospores. By day 13, original size distribution was almost restored. The observed morphological alterations appear to enable these strains to survive and grow autotrophically at supra-optimal temperatures (SOT). These natural adjustments may be exploited for reducing costs associated with both cooling and desalination in future cultivation.
INTRODUCTION
The main genera comprising the Chlorellaceae family are Chlorella, Micractinium, Parachlorella, Dictyosphaerium and Auxenochlorella (Guiry & Guiry, Citation2015). These members can be found in a variety of habitats including fresh and brackish waters, hot springs and even rock surfaces in Antarctica, at temperatures ranging overall between freezing to 70ºC (Sakai et al., Citation1995; Hu et al., Citation2008; Jonker et al., Citation2013; Onay et al., Citation2014). Chlorella species in particular are used as animal feed, food supplements and nutraceuticals (e.g. Borowitzka, Citation1992; Merchant & Andre, Citation2001; Pulz & Gross, Citation2004; Becker, Citation2007; Mahboob et al., Citation2012) as well as for wastewater treatment (Wang et al., Citation2010). In addition, Chlorella and Micractinium are considered suitable feedstocks for biofuel due to their ease of growth and high lipid content (Sakai et al., Citation1995; Wijffels & Barbosa, Citation2010; Onay et al., Citation2014).
Growing algae biotechnologically often requires expensive cooling systems due to the use of long, closed photobioreactors or the localization in hot and arid areas (Sheehan et al., Citation1998; Pulz, Citation2001; Ono & Cuello, Citation2002). The use of thermophilic or thermotolerant autotrophs that will thrive at high temperatures is desirable to help reduce cooling costs (Sakai et al., Citation1995; Onay et al., Citation2014). In addition, the use of brackish and saline water is desired to minimize fresh water utilization. In this work we sought to show that Chlorellaceae species collected from extreme environments can be suitable to answer both these requirements.
Stress hardening is a common biological phenomenon, especially in plants, referring to enhanced resistance to lethal factors following acclimation through pre-exposure to a stressor (Lou & Yousef, Citation1997). In particular, several studies have shown that a short preconditioning to a higher temperature enabled plants to withstand supra-optimal temperatures (SOT) later on (Harrington & Alm, Citation1988; Gong et al., Citation2001). There are also cases recorded where preconditioning to high salinity or high temperature enabled plants and bacteria to withstand supra-optimal salinities after a period at optimal conditions (Harrington & Alm, Citation1988; Lou & Yousef, Citation1997; Gong et al., Citation2001). However, little work has been done in hardening organisms to withstand SOT by exposing them to a high salinity and this applies particularly to members of the Chlorellaceae, even though some of the species in the family are cultured intensively.
The classical upper limit for photosynthetic eukaryotes is considered to be 42ºC (Sorokin & Myers, Citation1953; Sorokin, Citation1959; Kessler, Citation1985; Sakai et al., Citation1995; De-Bashan et al., Citation2008). However, recently, Onay et al. (Citation2014) showed that Micractinium sp. is able to grow at 50ºC, although productivity was low. Several studies have recorded growth of Chlorella beyond the 42ºC limit under special circumstances such as following a heat shock treatment (Shen & Lee, Citation1997), growth under 6% CO2 atmosphere (Chinnasamy et al., Citation2009) or mixotrophic growth (Mahboob et al., Citation2012). Various adaptive changes were reported in these cases, but none on alterations in morphology or mode of reproduction. In fact, there are just a few reports on the effect of heat stress on Chlorellaceae morphology and life cycle (Lorenzen, Citation1963; Šetlik et al., Citation1975).
Rodriguez-Lopez & Candela (Citation1962) used the term ‘gigantism’ to refer to a substantial increase in average cell diameter (ACD) observed in Chlorella cells under special circumstances. Gigantism had been reported in the following situations: heterotrophic or mixotrophic growth on sugars in light and in darkness (Rodrigues-Lopez, Citation1963; Higashiyama, Citation1967a, b; Griffiths & Griffiths, Citation1969; Thinh & Griffith, Citation1980; Orús et al., Citation1991; Bhatnagar et al., Citation2010), increased alkalinity (Malis-Arad et al., Citation1980) and temperature stress (Lorenzen, Citation1963; Šetlik et al., Citation1975). Cell enlargement was often reported to be associated with modifications in reproduction, such as multiple spore production or the formation of ‘palmelloid bodies’ containing primary and secondary spores (Rodrigues-Lopez, Citation1963; Higashiyama, Citation1967b; Malis-Arad et al., Citation1980; Orús et al., Citation1991). One explanation for these alterations is that enhanced cell wall elasticity, brought about by an increase in cellulase activity and pectin content in the giant cells, prevents physical rupture by the maturing autospores which instead continue to divide inside the mother cell wall (Malis-Arad et al., Citation1980; Malis-Arad & McGowan, Citation1982). Other authors have demonstrated that cell enlargement does not necessarily culminate in spore release: Griffiths & Griffiths (Citation1969) reported that giant cells of Chlorella vulgaris Emerson under heterotrophic conditions did not divide. Šetlik et al. (Citation1975) claimed that at the restrictive temperature of 43ºC, DNA multiplied inside the nuclei of giant cells of Chlorella vulgaris Beijerinck, but the nuclei themselves, or the cells, did not divide.
The current study was carried out in order to find algal strains able to grow at high temperatures and to examine if relatively high salinities can increase their thermo-tolerance. In addition, we examined the changes in morphology and mode of reproduction in those strains at SOT. We hypothesized that eukaryotic green algae found in saline and thermal habitats would possess the necessary adaptations to withstand these extreme conditions and that some modifications in morphology and mode of reproduction would occur in those strains. We also assumed that there would be cross effects of salinity and temperatures on the growth of these strains.
MATERIALS AND METHODS
Study organisms
Two local cultures studied in this work were isolated from natural water sources along the Israeli sector of the Syrian-African rift valley: TvB from the Tiberias hot springs near the Sea of Galilee, and SH from a sinkhole near Ein Gedi. The environmental conditions at the original locations are shown in .
Table 1. Strains and conditions at source.
Sampling, cultivation and maintenance
Hot spring samples were brought to an air-conditioned sun-lit greenhouse (20–25ºC), located in Yotvata, at the Southern Arava, Israel (29.8956°N, 35.0601°E), where all experiments were carried out. Maximal light intensity at midday was 750 µmol photons m–2 s–1. The samples were transported in thermal containers to prevent thermal shock and then transferred into heated 1.5 l custom-made conical glass columns, one per each sample. The columns were held in water-filled aquaria, placed over hot plates and mixed with magnetic stirrers at 45ºC and 50ºC. The sinkhole sample, initially diluted 7-fold with sterile de-ionized water, was maintained in a 1.5 l glass column at room temperature.
All samples were enriched with the following nutrients to give a BG11-based medium with the following final concentrations: 15 mM KNO3, 1.5 mM KH2PO4, 1.66 mM MgSO4, 1.8 mM CaCl2, 0.65 mM SiO2, 0.22 mM Fe-EDDHSA, 46 µM H2BO3, 10 µM Mn-EDTA, 5 µM Zn-EDTA, 0.8 µM Cu-EDTA, 0.3 µM Mo, and bubbled with 1.5% CO2/air (v/v), at about 0.5 l min–1 through a sterile silicon tube equipped with 0.2 µm Teflon filters to prevent contamination by supplied air.
Over time, populations in the vessels became dominated by Chlorella-like species. Uni-algal cultures were obtained by streaking liquid populations onto sterile 1.5% agar plates, containing the same medium, followed by colony picking. Plating was carried out 85 d from collection for the sinkhole cultures (SH) and 134 d from collection for the Tiberias hot spring culture (TvB). Following isolation, uni-algal colonies were transferred for maintenance into 250 ml sterile flasks containing fresh medium on an orbital shaker at room temperature (20–26ºC), without an additional CO2 supply. The cultures were renewed once a month. In addition, for long-term maintenance, agar plates containing the colonies were maintained at 4ºC in the dark.
Identification
The isolated strains, TvB and SH were identified by Dr Barinova from Haifa University, Israel, using microscopic examination. In addition, the two strains were further identified by Dr Kaplan-Levy from the Yigal Alon Kinneret Limnological Laboratory, IOLR, Israel, using the DNA sequences of the 18S rRNA-ITS1-5.8S-ITS2 (SSU-ITS) and the (rbcL) gene, encoding for the Ribulose-1,5-bisphosphate carboxylase oxygenase large subunit. Finally, in order to further confirm the identification, the bristle development biotest of Luo et al., (Citation2006) was used.
DNA extraction and PCR amplification
Genomic DNA from both cultures was extracted using 15 ml cultures according to Edwards et al. (Citation1991), with the exception that the physical cell lysis was conducted using glass beads of 100 and 500 μm in size (Sigma # G-4649 and G-8772) with vortexing.
The amplification of rbcL was conducted using degenerate primers adopted from Giri et al. (Citation2004). PCR was performed in a volume of 50 µl with 1 µl (~50 ng) genomic DNA as a template, 400 µM dNTPs, 2 µM of each primer, 5 µl of 10× Taq buffer (50mM Tris-HCl pH 8.3, 50 µg ml–1 BSA, 0.5% Ficoll, 1% sucrose, 30mM KCl, 3mM MgCl, 1mM tartrazine) and 1 µl Taq polymerase (Pluthero, Citation1993). The amplification program was as follows: a hot start of 3 min at 95°C, followed by 35 cycles consisting of 45 s denaturation at 95°C, 30 s annealing at 45ºC and 1 min extension at 72ºC. After the final step of 5 min extension at 72°C, the tubes were held at 16°C. The expected ~800 bp long PCR product was then examined by electrophoresis, loading 10% of the reaction on a 1% agarose gel.
The amplification of the SSU-ITS was conducted using the primers NS1 and ITS4 adopted from White et al. (Citation1990). The reaction mixture was similar to that of rbcL, with the exception that primers were added at a final concentration of 600 nM. The thermal cycling conditions used were as for rbcL with the modifications of 59ºC annealing temperature and a 3 min extension time. The expected ~2.5 kbp long PCR product was then examined by electrophoresis, loading 10% of the reaction on a 1% agarose gel.
The amplicons were cloned into the pGEM®-T Easy system (Promega #A1360) and transformed into E. coli JM109 by heat shock. After confirmation of positive clones the plasmid DNA was extracted by NucleoSpin® Plasmid (MN, cat #740588) and sent to be sequenced at the Israel Institute of Technology, Genomics Core Facility by Sanger Sequencing (Applied Biosystems). The sequences were analysed with BioEdit v. 7.2.3 and deposited in the GenBank database under the accession numbers: TvB strain, rbcL – KM820916 and SSU-ITS – KM820917, SH strain, rbcL – KM820918 and SSU-ITS – KM820919.
Phylogenetic analysis
Phylogenetic analysis was conducted in MEGA6 (Tamura et al., Citation2013). The sequences used for the construction of the SSU-ITS tree were retrieved from NCBI database (http://www.ncbi.nlm.nih.gov), according to Luo et al. (Citation2010) (FM205832-FM205885), Hoshina & Fujiwara (Citation2013) (AB731604), Krienitz et al. (Citation2010) (GQ176853), and from GenBank for the rbcL tree.
For the multiple-alignment, the MUSCLE DNA multiple alignment algorithm was used, with default parameters (Gap open -400, Gap extend 0, clustering method UPGMB). The sequence alignment confidence was tested using GUIDANCE2 software (http://guidance.tau.ac.il/ver2/) with the MAFFT algorithm. The SSU-ITS GUIDANCE2 alignment score was 0.953184, and all sequences had a confidence score higher than 0.6. For the rbcL, according to the GUIDANCE2 scores, the alignment is highly reliable and no positions or sequences needed to be masked or removed (score: 1.00).
Models for the estimated distances, based on maximum likelihood (ML), were tested for each alignment prior to phylogenetic inference. The ML phylogeny tree was constructed using the best fit model. The tree topology was confined by bootstrap calculations with 1000 replicates.
Bristles Development Biotest (Luo et al., Citation2006)
Medium of 20 ppt seawater in which Brachionus rotundiformis rotifers were grown to 500 individuals per ml was obtained from Dr Michal Uko’s laboratory, NCM, Eilat, Israel, and filtered through a 0.2 µm PTFE filter. 10 ml of the filtrate were added to 50 ml TvB and SH cultures, grown in our modified BG11 medium (see next section) containing 20 ppt sea salts, at a density of 1.5 × 10⁵ cells ml–1. Cultures were shaken very gently by hand for 5 s twice a day. The development of bristles was examined 24 h, 48 h and 72 h following culturing, using a light microscope.
Experimental medium preparation
For all experiments media were prepared with de-ionized water, enriched with the nutrient mixture described previously and supplemented with Red Sea salt (‘Red Sea Fish Farm’, Israel) to the desired concentrations of seawater according to manufacturer’s instructions. The addition of 33 ppt sea salt to our BG11-based medium was considered as 100% seawater (100% SW) and no addition of sea salt was considered as 0% seawater (0% SW). Our BG11-based medium alone contained 1.8 ppt salts. Altogether, 100% SW was 34.8 ppt, 75% SW was 26.5 ppt, 50% SW was 18.3 ppt, 25% SW was 10 ppt and 0% SW was 1.8 ppt. The TvB strain was maintained at 75% SW and the SH strain at 50% SW.
Growth experiment design
The two strains studied in this work were chosen in earlier screening experiments for in-depth bifactorial experiments, where three temperature regimes and five levels of salinity were tested. Temperatures were set to 35, 40 and 45ºC, and salinities adjusted to 0, 25, 50, 75 and 100% SW as described previously. Temperatures in the aquaria were stabilized within a ± 2ºC range. 50 ml sterile plastic tubes were inoculated (106 cells ml–1) and placed in aquaria as described above. Inocula for the various treatments were taken at the late log phase (3–4 d). Original culture volume was 40 ml and sterile distilled water was added daily to compensate for evaporation before sampling. Each tube was bubbled with 1.5% CO2/air (v/v), at about 0.5 l min–1 through a sterile silicon tube equipped with 0.2 µm PTFE filters to prevent contamination by supplied air. Optical density (OD) was sampled on a daily basis (0.5 ml) and cell density (CD) every other day (20 µl). Sampling of the 35ºC and 40ºC cultures was conducted for 6 days, and of the 45ºC cultures for 2 weeks. From the 8th day onwards, 45ºC sampling was carried out sporadically. Samples for t0 were taken from the master culture.
Cell density (CD) and optical density (OD) measurements
Cells were counted in a double-chambered Neubauer improved hemocytometer (Isolab). Usually, cells were counted in 10 squares and their means were calculated. When cells were very sparse they were counted over the entire grid. The means of the counts of the two chambers were then averaged. OD at 680 nm was determined using a spectrophotometer (Rayleigh UV-1800) against a blank.
Calculations of growth parameters
Specific growth rate (k or µ) of the microalgae was calculated according to Levasseur et al. (Citation1993):
where N2 and N1 are the numbers of cells at times t2 and t1, and k or µ is expressed in time–1. The same equation was used to calculate growth by OD.
Equation No. 2 (Australian National Algae Collection, Citation2013) was used for calculating divisions per day (DPD), which is doubling time–1.
Size experiment design
All experiments were done in triplicate. Inocula of the SH and TvB strains were taken into 50 ml sterile plastic tubes that were held in aquaria at 35 ± 2ºC (OT) and 45 ± 2ºC (SOT) as described previously. The media used for this experiment was 75% SW for TvB, and 50% SW for SH. At 35ºC, samples were taken on d 0, 2, 3, 6 and 13. At 45ºC, SH were sampled on d 0, 1, 2, 3, 6, 8, 9(10), 13 and 15; TvB was sampled daily over the course of 10 days, and then on day 13. Sampling was done in the mornings between 09:00 and 11:00. After sampling, algae were slightly sonicated (Sonics Vibracell 750W – 20% amplitude, 2×18 s pulse) in order to break aggregates and facilitate measurements. Sonicated samples were then photographed on a Moticam 2500 camera, attached to a Motic BA310 microscope. Cell diameters were measured using the manual capacity of Motic 2.0 software to avoid mistakes due to cell divisions. Algae were assumed to be spherical. Outputs were loaded onto Microsoft Excel worksheets and analysed statistically, including two-sample t-tests to establish the significance of ACD differences between treatments.
Statistical analysis
Regression analysis was carried out between time and the various growth parameters to find growth rate coefficients (µ). Means, standard errors and R2 values were calculated for triplicate growth rates and maximal cell densities. One- and two-way ANOVA of the data obtained was performed and the significance of the differences between means was evaluated by Duncan’s post hoc multiple range test. SPSS Statistics 17.0 (IBM Co. Somers NY 2011) was used to perform the ANOVA and Duncan’s multiple range analysis. Otherwise, all statistics were carried out using Excel 2007 (Microsoft Co.).
RESULTS
Genetic, phylogenetic and morphological analyses
In addition to the classical visual identification of the strains under study (), as performed by taxonomist Sofia Barinova (Haifa university, Israel), a two-loci species delineation system analysis was conducted. The sequences of choice were the chloroplast gene rbcL and a long fragment comprising the 18S rRNA full sequence, the internal transcribed spacer 1 (ITS1), 5.8S rRNA, ITS2 and the 28S rRNA partial sequence (SSU-ITS). The advantage of these two loci is that there are many sequences publicly available with which to compare. Genomic DNA from each strain was used to amplify a fragment of about 810 bp for the rbcL loci and a fragment of about 2840 bp long of the SSU-ITS. Pairwise alignment of the rbcL and SSU-ITS showed that TvB and SH share a 99% sequence identity in these two loci, suggesting that both strains belong to the same species. The sequences obtained were then submitted to a BLASTN search against the non-redundant nucleotide database at the NCBI site (http://www.ncbi.nlm.nih.gov/blast/Blast.cgi) revealing contradictory results. While the rbcL sequence shared 99% identity with Chlorella pyrenoidosa strain F-9 and 95% identity to Micractinium pusillum strain SAG 13.81, the SSU-ITS fragment showed 99% identity to Micractinium sp. CCAP 211/92 and only 95% identity to the 18S rRNA of Chlorella pyrenoidosa.
The DNA sequences were then submitted for phylogenetic analyses using the maximum likelihood method (, ). The phylogenetic analysis of the SSU-ITS regions shows that TvB and SH clade together with Micractinium pusillum with statistical significance of 84% (), but the rbcL tree shows that the two strains clade together with Chlorella pyrenoidosa with a 99% confidence (). In order to get conclusive results, we compared the Micractinium molecular signature, deduced from the rRNA secondary structure, in the SSU and ITS-2 rRNA gene (as described by Luo et al., Citation2006) with that of TvB and SH (data not shown). According to this method, our strains have the molecular signature of Chlorella in the SSU sequence while the ITS-2 coincides with that of Micractinium. Additional phylogenetic analysis, using only the ITS region, confirmed that strains TvB and SH belong to the same species as Chlorella pyrenoidosa strains F-5 and F-9, and all four strains clade with Micractinium sp. CCAP 211/92 isolated by Pröschold 2002 (Luo et al., Citation2010). We note that although the taxonomic name that appears at the GenBank entry is Chlorella pyrenoidosa, the current accepted name for these species, as annotated in Algaebase (Guiry & Guiry, Citation2015), is either Chlorella vulgaris for the different varieties of Chlorella pyrenoidosa or Auxenochlorella pyrenoidosa (H.Chick) Molinari & Calvo-Perez for the nomenclature type of species Chlorella pyrenoidosa H.Chick. The lack of publications regarding F-5 and F-9 strains, support our view that there is an error in their identification. Therefore we identify TvB and SH as Micractinium sp., closely related to the genus of Chlorella.
Fig. 1. Molecular phylogenetic analysis of TvB and SH strains based on the ITS1-5.8S-ITS2 region. The evolutionary history was inferred by using the Maximum Likelihood method based on the Tamura–Nei model (Tamura & Nei, Citation1993). The tree with the highest log likelihood (−4510.7914) is shown. A discrete Gamma distribution was used to model evolutionary rate differences among sites (five categories (+G, parameter = 0.3717)). The rate variation model allowed for some sites to be evolutionarily invariable ([+I], 45.6994% sites). The analysis involved 50 nucleotide sequences. There were a total of 574 positions in the final dataset. The tree was rooted using Parachlorella sequences as outgroup. A. = Actinastrum; Chl. = Chlorella; M. = Micractinium; P. = Parachlorella. ![]()
![Fig. 1. Molecular phylogenetic analysis of TvB and SH strains based on the ITS1-5.8S-ITS2 region. The evolutionary history was inferred by using the Maximum Likelihood method based on the Tamura–Nei model (Tamura & Nei, Citation1993). The tree with the highest log likelihood (−4510.7914) is shown. A discrete Gamma distribution was used to model evolutionary rate differences among sites (five categories (+G, parameter = 0.3717)). The rate variation model allowed for some sites to be evolutionarily invariable ([+I], 45.6994% sites). The analysis involved 50 nucleotide sequences. There were a total of 574 positions in the final dataset. The tree was rooted using Parachlorella sequences as outgroup. A. = Actinastrum; Chl. = Chlorella; M. = Micractinium; P. = Parachlorella. Display full size Species added in this study.](/cms/asset/52811959-f8a7-47ae-8b84-edf8aaa0ec1a/tejp_a_1193772_f0001_b.gif)
Fig. 2. Molecular phylogenetic analysis of TvB and SH strains based on rbcL sequences. The evolutionary history was inferred by using the Maximum Likelihood method based on the Tamura 3-parameter model (Tamura, Citation1992). The tree with the highest log likelihood (−2246.5096) is shown. A discrete Gamma distribution was used to model evolutionary rate differences among sites (5 categories (+G, parameter = 0.2753)). The analysis involved 29 nucleotide sequences. There were a total of 493 positions in the final dataset. The tree was rooted using Parachlorella sequences as outgroup. A. = Actinastrum; Chl. = Chlorella; M. = Micractinium; P. = Parachlorella. ![]()
The closeness of these two strains to the Chlorella genus is further supported by their identification as Chlorella sp. by algal taxonomist Sofia Barinova and their lack of bristles in the bio-test we had performed according to Luo et al. (Citation2006) (data not shown). Finally, it is also possible that these two strains represent a new taxon, but this is not the scope of this study.
Maximal growth rates
The maximal k values achieved in those experiments were found mostly at 35–40°C, when the mineral media contained no sea salt (0% SW: , and ). Measured by CD, they were 1.246 d–1 (35°C, R2 = 0.94) for TvB strain and 1.110 d–1 (35°C, R2 = 0.97) for SH strain. These numbers translate into 1.8, and 1.6 divisions per day (DPD), respectively. The highest k value of this study, 1.820 d–1, or 2.63 DPD (40°C, 50% SW, R2 = 0.97, 4 d), measured in CD, had been recorded for SH strain in a screening experiment. Both strains demonstrated good and consistent growth at 45ºC (, ). At that temperature, the best growth of the TvB and SH strains was recorded in the 100% SW medium. The maximal k values during the log phase, measured by CD, were 0.387 d–1 (R2 = 0.979) for TvB and 0.376 (R2 = 0.970) for SH, translated into 0.56 and 0.54 DPD respectively. The maximal growth rates measured by OD were 0.245 d–1 (R2 = 0.94) for TvB and 0.263 (R2 = 0.960) for SH.
Table 2. Growth rates of TvB at the logarithmic growth phase under various combinations of temperatures and salinities.
Table 3. Growth rates of SH at the logarithmic growth phase under various combinations of temperatures and salinities.
Table 4. Initial and maximal ACD at 45ºC in the two strains (Dt0 and Dmax respectively), the volumetric ratio (Vmax/Vt0) and the days needed to achieve Vmax. The statistical bounds represent one standard error.
Relationship between salinity and temperature
Growth of the TvB strain was affected by the combined effects of temperature and salinity. At the temperatures of 35ºC and 40ºC, maximal growth rates, as measured by either CD or OD, were observed at 0% SW, and the minimal ones at 100% SW (). In addition, at these temperatures, under higher salinities, longer lag phases are evident, as judged by OD (). However, at 45°C salinity seemed to have the opposite effect (, ): the highest growth rates were achieved at 100% SW (both CD and OD) and the lowest at 0–25% SW. Moreover, at 0% SW, population decline was observed in both parameters (). Interaction between temperature and salinity for growth rates was highly significant for both OD and CD.
Fig. 3. Growth of (a) TvB and (b) SH at different temperatures and salinities, as measured by OD. Data points represent mean values of triplicates.
For the SH strain, at 35ºC and 40°C, growth rates (measured by CD) peaked at 0% SW and seemed to drop towards 100% SW, but without a clear statistical significance (). At 45°C, this trend reversed with minimal or no growth at 0% SW and maximal growth at 100% SW (CD and OD, see also ). Interaction between temperature and salinity for growth rates was highly significant for OD, but not for CD.
Behaviour of cultures at supra-optimal temperatures
Both TvB and SH showed excellent logarithmic growth at the optimal temperatures of 35ºC and 40ºC and under low salinity, immediately following inoculation. However, at 45°C, under relatively high salinities, a considerable and clear lag period was consistently observed (), starting with an initial rise in OD (). The relationship between CD and OD at SOT can be viewed more clearly in the logarithmic depiction (): the initial increase in OD was not accompanied by a parallel rise in CD, most conspicuously for TvB, where growth was actually negative or null (). However, for the SH strain, CD increased slightly during the first two days, but not to the same extent as OD (). After 7–8 days, both strains entered a stage of more vigorous growth (). The growth rates (, ) calculated during that period, were lower than the values for the respective salinities at optimal temperatures. Most importantly, in both strains, the higher the salinity, the greater was the growth rate at 45ºC during that period (, ). After 15 days of growth at the higher salinities (75–100% SW), maximal culture density of TvB and SH (OD) was close to the 6th day levels at 35ºC, at parallel salinities ().
Fig. 4. Logarithmic representation of growth parameters in (a) TvB and (b) SH strains at 45ºC in maintenance salinities: 75% SW for TvB and 50% SW for SH. Data points represent mean values of triplicates.
No significant growth was observed at 50ºC in any of the strains, but cultures that were re-introduced into room temperature following 4–7 days at 50ºC resumed normal growth levels (data not shown).
Size changes at SOT
Concomitant with the observed division arrest at 45°C, a dramatic growth in cell size took place. While at the OT of 35ºC, only slight changes in ACD were observed over a period of 6 days, at 45ºC a great increase in ACD was registered for the two strains during the lag period (, ). The pattern of ACD change at SOT was the same for both strains: an initial increase, followed by a phase with little or no change, and eventually, when cell division resumed, a decline to almost initial values (). Comparison of cell diameter values at 45ºC on days 3–10 with those of day 0, showed a highly significant difference (α < 0.0001) for both strains. A parallel comparison of ACD values on days 3–6 with those of day 0 at 35ºC, failed to reach a significant difference (α > 0.05). Cell diameter values at 45ºC on day 6 were significantly larger (α < 1014) than those of the parallel day at 35ºC.
Fig. 5. Changes in ACD in the (a) TvB and (b) SH strains, exposed to OT of 35ºC and SOT of 45ºC at maintenance salinities: 75% SW for TvB and 50% SW for SH. Bars represent standard error.
Maximal cell diameter (Dmax) was different for the two strains with TvB > SH. Time needed to reach Dmax was also slightly longer for TvB than for SH (). TvB achieved 93% of Dmax by day 4, but ACD kept fluctuating until Dmax was reached on day 10 (); SH increased in size gradually until day 8 (with a small slump on day 3) (). The ratio between the maximal and initial volume (Vmax·Vt0–1) for TvB and SH was 4.43 and 12.34 respectively (). It is notable that this ratio was lower for the strain with the higher initial ACD.
Temporal changes in size distribution at SOT
Size distribution of the two strains at OT and SOT was organized in three ACD ranges: 0.7–4 μm, 4–8 μm and > 8 μm (). At 35ºC, size distribution was fairly stable along the course of the logarithmic growth. Nonetheless, on day 13, when the cultures were at the stationary phase, a moderate increase in the middle size range (4–8 μm) was measured for TvB (, left), and to a much lesser extent for SH (, right). In contrast, at 45°C, the ACD distribution showed a marked temporal pattern in both strains: by day 3 cell expansion was expressed as a major reduction in the small ACD range (0.7–4 μm) and an increase in the medium (4–8 µm) and large (> 8 µm) ranges (). This trend, which was more pronounced for SH, was maximal on day 6 and then decreased. By day 13, a considerable increase in the 0.7–4 µm ACD range was seen in both strains () with SH being more distinct. This increase matches well with the resumption of cell division seen in the growth experiments () and indeed numerous cells of < 2 μm were observed in the medium at that stage (, ). By day 13, size distribution approximated that of day 0, with a minute fraction of the > 8 μm range still present ().
Fig. 6. Time-course (days 0–13) of ACD distribution in TvB and SH cultures, grown at (a) 35ºC and (b) 45ºC, at 75% SW for TvB and at 50% SW for SH. White bars, 0.7–4 µm range; dotted bars, 4–8 µm range; black bars, > 8 µm range. Sample sizes range between 136–731.
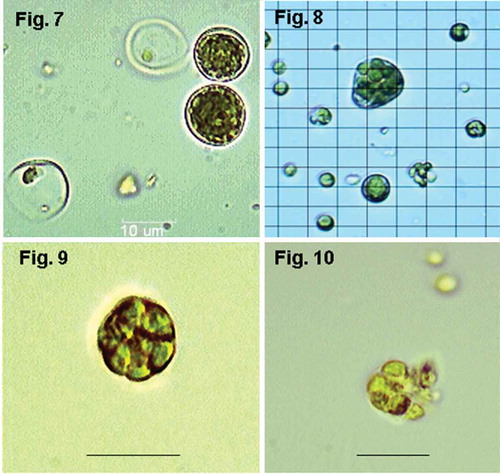
Figs 7–10. Alternative forms of cells and cell division at 45ºC. Fig. 7. SH, d 5 (salinity 50% SW): spore-bearing cells with homogeneously distributed autospores and empty sporangia with some remaining spores still inside; Fig. 8. TvB, d 15 (salinity 75% SW): giant irregular sporangium with secondary small sporangia inside (so-called ‘palmelloid bodies’); Fig. 9. TvB, d 6: sporangium with ‘palmelloid bodies’; Fig. 10. TvB, d 6: sporangium with ‘palmelloid bodies’ releasing autospores. Magnification ×1000, scale bars and grid = 10 μm.
The largest ACDs of individual algae were viewed in both cultures at 45ºC on day 6: 17.1 μm (SH) and 19.5μm (TvB).
Morphological and life cycle changes at SOT
Other morphological changes of the investigated strains were qualitatively observed following inoculation into 45ºC. As the cells enlarged, up to a diameter of 19 µm, they generally assumed a darker green colouration and in some cases cell walls were seen to thicken (). Two main forms of sporangia were observed: one with multiple small spores spread homogeneously inside the cell volume (), and the other with fewer but larger spores. These big primary spores form small spores (secondary spores), but remain enclosed in general sporangial wall. Big sporangia with several secondary sporangia bearing small spores form as a result (–).
DISCUSSION
In the current work we searched for algal strains that would thrive at relatively high temperatures and salinities and thereby lower cooling and desalination costs in future commercial applications. We found that the capability of the two Chlorellaceae strains to grow and divide at > 42ºC was particularly conspicuous at relatively high salinities, which apparently harden the algae to tolerate higher temperatures. An extended lag period seems to coincide with this adaptation. In addition, we saw that this capability was accompanied by alterations in reproduction mode of these two strains. This effect of salinity on temperature tolerance, found in the studied strains originating from saline environments, suggests an adaptation mechanism that responds to a variety of environmental stressors.
As shown in and , at the OT of 35–40°C, a negative correlation was found between salinity and growth rate for both strains. On the other hand, at 45°C, a positive correlation between these two parameters was found, indicating a hardening effect of salinity on temperature tolerance. Cho et al. (Citation2007) found a trend, similar to our observations on TvB and SH, for low-temperature C. ellipsoidea, with respect to maximal cell density at ranges of 15–30ºC and 10–30 ppt salt concentration. The authors also found, in similarity to our study, a negative correlation with salinity at the lower temperature range (15–20ºC) and a positive one at higher temperatures (25–30°C). Zuppini et al. (Citation2010) found that heat or salt stress, by themselves, led to morphological and biochemical changes in the snow strain C. saccharophila, but treating the culture for 24 h with 0.2–0.3M NaCl prior to a heat shock of 44ºC created a ‘cross tolerance’. The salt-induced heat tolerance was manifested by a complete inhibition of the programmed cell death process, measured by the decrease in photosynthetic pigments and rbcL protein, and the processing of procaspase-3-like protein. Regarding the work of Zuppini et al. (Citation2010), it should be noted that psychrophilic organisms, like the thermophilic ones, are exposed naturally to an extreme and unstable environment, so that hardening processes might act similarly in these organisms.
Several studies have also shown the effect of pre-conditioning to one environmental stress on the ability to tolerate another (Harrington & Alm, Citation1988; Gong et al., Citation2001). Based on our study and the works cited above, it seems that the process of hardening cells to withstand relatively high temperatures, by pre-exposure to high salinity, is operative in several genera of the Chlorellaceae family. This process allows these very successful taxa to survive and grow in various extreme environments characterized by multiple stresses. According to Mittler (Citation2006), the exposure of a plant to a combination of stresses may result in the co-activation of different stress-response pathways that might either have a synergistic or an antagonistic effect.
From comparison of the two strains studied in this work with another Micractinuim sp. strain, collected from the Hammat Gader hot springs in the Israeli Golan (strain HGF), it appears that the hardening apparatus is more operative in the strains originating from saline waters. The TvB strain, which showed the best growth parameters at 45ºC and the strongest hardening effect in laboratory conditions, was collected from a high-salinity high-temperature environment, whilst SH was isolated from saline but nonthermal water. In contrast, HGF, originating in a thermal but non-saline environment (EC 2.3 mS cm–2) did not demonstrate a similar hardening effect (data not shown). Since in this study we isolated only one strain per site, it is not possible to determine whether the extreme conditions in the natural habitats affected the genetic variability of Chlorellaceae in these environments.
At 45ºC and at relatively high salinities, especially for TvB, an initial rise in OD was observed in the first 2 days with no parallel rise in CD (). During that period, and throughout the ensuing lag phase (see also ), it was seen that although cell division was mostly arrested, the algae grew volumetrically and got visibly darker in colour. Later, during the consecutive log phase, when CD values ‘caught up‘ with OD values (), mean cell size diminished. Shen & Lee (Citation1997) showed that following a 30-minute heat shock at 45ºC, the OD of a Chlorella zofingiensis culture (now revised as Chromochloris zofingiensis; Fučikova & Lewis, Citation2012) increased during the following 44 h growth period at 45°C. It is possible therefore, that the change observed in OD values during these 44 hours of culturing did not reflect growth in terms of cell numbers via division, but rather, that it was the first stage of thermal adaptation as observed in our experiments.
Although some eukaryotes have been shown to grow at temperatures above 46ºC (Castenholz, Citation1969; Roberts, Citation1999; Onay et al., Citation2014), the limit for growth of eukaryotic photoautotrophs is claimed to be 42ºC (Sorokin & Myers, Citation1953; Sakai et al., Citation1995; de-Bashan et al., Citation2008). According to Sorokin & Krauss (Citation1965), the upper temperature limit for growth or division for the high-temperature Chlorella strain 7-11-05 (C. sorokiniana) is 43ºC. More recently, Sakai et al. (Citation1995) raised a Chlorella strain at 40ºC to a level of 8 DPD, but no growth was observed at 45ºC. Mutants of a low-temperature Chlorella sp. selected for growth at high temperatures, achieved good growth only up to 40ºC (Ong et al., Citation2010). Nevertheless, green microalgae have been found in natural habitats at higher temperatures. Stockner (Citation1967) found Mougeotia sp. in 47ºC thermal streams of Mount Rainier, Sakai et al. (Citation1995) reported that the temperature of the hot spring where they collected their Chlorella strain ranged between 20–70ºC, and Jonker et al. (Citation2013) found Chlorella in > 60ºC thermal water sources in Limpopo province, South Africa. In our research, a Chlorellaceae strain was found in water as hot as 52.4ºC at the Tiberias hot springs.
Growth in the lab beyond the 42ºC limit has been achieved in some species of Chlorella in the following artificial conditions: (1) Shen & Lee (Citation1997), in a 44 h experiment, attained a specific growth rate of ~1.3 (as measured by OD) at 45ºC, by preconditioning, or hardening, a culture of C. zofingiensis (optimum 30ºC, maximum 40ºC) under a 30-minute heat shock at 45ºC; (2) Chinnasamy et al. (Citation2009) reported 379% growth in biomass over 10 d at 50ºC and 6% CO2 atmosphere in C. vulgaris from wastewater, but no growth at ambient CO2 level; (3) Mahboob et al. (Citation2012) achieved growth to a ‘high cell density‘ at 45ºC by growing C. vulgaris mixotrophically on a mineral medium supplemented with yeast extract. Our study demonstrates the effect of high salinity on the ability of a Chlorellaceae sp. to withstand 45°C. It is possible that all the above conditions act as stressors, triggering a common hardening mechanism that enables the algae to withstand SOT.
At the morphological level, when TvB and SH strains were cultured at the SOT of 45°C, cells grew volumetrically during an extended lag phase to produce giant cells and then, upon spore release and the resumption of growth, cell size returned to close-to-initial ( and ). No such changes were observed at the OT of 35°C. These changes in ACD and size distribution, along with the shift in the mode of reproduction (–), can be considered as a part of a composite response of the algae to SOT. Our results support Lorenzen’s (Citation1963) findings that under intermittent light conditions, elevated temperatures of 36ºC triggered cell enlargement or gigantism and sporulation in Chlorella pyrenoidosa. The temperature at which gigantism and the inhibition of cell division occurred in our strains was higher than Lorenzen’s (Citation1963) and more similar to that of Šetlik et al. (Citation1975). The latter authors reported a complete halt of both nuclear and cell division in C. vulgaris Beijerinck, accompanied by cell enlargement at the ‘restrictive‘ temperature of 43ºC; controls at 37ºC reproduced normally. However, their experiments were conducted for only 25 h, so the later release of spores as observed in our experiments at the SOT might have been missed.
The fact that in our study the giant cells eventually released their spores at SOT, strongly supports the hypothesis that gigantism is indeed part of an adaptation mechanism to stressful conditions, including SOT.
Chlorella and related species reproduce by asexual reproduction via sporulation under standard laboratory or natural conditions (e.g. Ettl, Citation1988; Sluiman et al., Citation1989; Van den Hoek, Citation1995). Usually, sporangia of C. vulgaris contain 2–4 spores, but 8, 16 and 32 spores are frequently seen (Yamamoto et al., Citation2003). We observed two types of abnormal sporangia in our Chlorellaceae strains under heat stress conditions. One type was big sporangia with homogeneously distributed small autospores (), resembling Rodriguez-Lopez’s (Citation1963) observations for a C. pyrenoidosa strain cultivated on media with different sugars. The other type is large sporangia containing secondary smaller sporangia, similar to observations made by Higashiyama (Citation1967b). Due to morphological similarity, he compared this type of giant sporangia with palmella formed by some flagellated algae such as Chlamydomonas, and named them ‘palmelloid bodies’ (Higashiyama, Citation1967b). The changes we observed cannot be viewed as alterations in mode of reproduction in our Chlorellaceae strains, but rather as changes of sporangia morphology caused by the gigantism of vegetative cells under stress conditions, perhaps by modification of properties of sporangia walls. These changes correspond, in our opinion, with Higashiyama’s (Citation1967b) suggestion that a re-arrangement of the life cycle of Chlorellaceae occurs under stress conditions. Precise determination of the types of spore-bearing cells, observed in our study by light microscopy, is not possible at this stage without an ultrastructural investigation and a temporal follow-up of divisions in individual cells.
The fact that our algae were found in natural habitats at 42–52.4ºC supports the hypothesis that they possess the genetic ability to adapt to SOT and sustain growth. The various alterations in morphology and cell cycle – cell enlargement, division arrest, apparent darkening of colour, thickening of the cell wall and the development of giant sporangia and so-called ‘palmelloid bodies’, therefore, represent the necessary physiological adjustments to protect the cells from heat stress.
To conclude, strains TvB and SH were found to perform well at a combination of high temperatures and salinities, suggesting the potential to reduce both cooling and desalination costs for a variety of biotechnological purposes. Since higher salinities appear to enhance tolerance for higher temperatures in these Chlorellaceae strains, it appears that they possess an acclimation mechanism for surviving supra-optimal temperatures, which is triggered by osmotic adjustment.
ACKNOWLEDGEMENTS
We are especially grateful to Dr Effi Tripler for his helpful review and advice in statistical analysis and to Dr Amir Neori for thoroughly reviewing the manuscript. We also thank Yigal Eran, Dr Ruth Glasner, Gigi Strom, Dr Gil Ben Natan, Myron Jones and Shirley Berman for technical assistance and to Nadine B. Zielinsky and Rebecca Herst for their help with the German translation. We are grateful to the Israel National Center for Mariculture (NCM) for the use of their sonicator.
The research was supported by the Israeli Ministry of Energy and Water, grant No. 2009-9-21/29-11-003.
DISCLOSURE STATEMENT
No potential conflict of interest was reported by the author(s).
Additional information
Notes on contributors
Orit Adar
O. Adar: original concept, conduction of experiments, analysis of results, draft writing; R. N. Kaplan-Levy: identification of strains, contribution to draft writing; G. Banet: original concept, provision of resources, draft editing.
Ruth N. Kaplan-Levy
O. Adar: original concept, conduction of experiments, analysis of results, draft writing; R. N. Kaplan-Levy: identification of strains, contribution to draft writing; G. Banet: original concept, provision of resources, draft editing.
Gabi Banet
O. Adar: original concept, conduction of experiments, analysis of results, draft writing; R. N. Kaplan-Levy: identification of strains, contribution to draft writing; G. Banet: original concept, provision of resources, draft editing.
Related Research Data
REFERENCES
- Australian National Algae Collection (2013). Algal growth phases including determination of the growth rate and population doubling. www.marine.csiro.au/microalgae/methods/Growth%20rate.htm
- Becker, E. (2007). Micro-algae as a source of protein. Biotechnology Advances, 25: 207–210.
- Bhatnagar, A., Bhatnagar, M., Chinnasamy, S. & Das, K.C. (2010). Chlorella minutissima – a promising fuel alga for cultivation in municipal wastewaters. Applied Biochemistry and Biotechnology, 161: 523–536.
- Borowitzka, M.A. (1992). Algal biotechnology products and processes – matching science and economics. Journal of Applied Phycology, 4: 267–279.
- Castenholz, R.W. (1969). Thermophilic blue-green algae and the thermal environment. Bacteriology Reviews, 33: 476–504.
- Chinnasamy, S., Ramakrishnan, B., Bhatnagar, A. & Das, K.C. (2009). Biomass production potential of a wastewater alga Chlorella vulgaris ARC 1 under elevated levels of CO2 and temperature. International Journal of Molecular Sciences, 10: 518–532.
- Cho, S.H., Ji, S.C., Hur, S.B., Bae, J., Park, I.S. & Song, Y.C. (2007). Optimum temperature and salinity conditions for growth of green algae Chlorella ellipsoidea and Nannochloris oculata. Fisheries Science, 73: 1050–1056.
- De-Bashan, L.E., Trejo, A., Huss, V.A., Hernandez, J.P. & Bashan, Y. (2008). Chlorella sorokiniana UTEX 2805, a heat and intense, sunlight-tolerant microalga with potential for removing ammonium from wastewater. Bioresource Technology, 99: 4980–4989.
- Edwards, K., Johnstone, C. & Thompson, C. (1991). A simple and rapid method for the preparation of plant genomic DNA for PCR analysis. Nucleic Acids Research, 19: 1349.
- Ettl, H. (1988). Zellteilung und sporulation als wichtige unterscheidungsmerkmale bei grünalgen (Chlorophyta). Archiv für Protistenkunde, 135: 103–118.
- Fučikova, K. & Lewis, L.A. (2012). Intersection of Chlorella, Muriella and Bracteacoccus: resurrecting the genus Chromochloris Kol et Chodat (Chlorophyceae, Chlorophyta). Fottea, 12: 83–93.
- Giri, B.J., Bano, N. & Hollibaugh, J.T. (2004). Distribution of RuBisCO genotypes along a redox gradient in Mono Lake, California. Applied Environmental Microbiology, 70: 3443–3448.
- Gong, M., Chen, B., Li, Z.G. & Guo, L.H. (2001). Heat-shock-induced cross adaptation to heat, chilling, drought and salt stress in maize seedlings and involvement of H2O2. Journal of Plant Physiology, 158: 1125–1130.
- Griffiths, D.A. & Griffiths, D.J. (1969). The fine structure of autotrophic and heterotrophic cells of Chlorella vulgaris (Emerson strain). Plant Cell Physiology, 10: 11–19.
- Guiry, M.D. & Guiry, G.M. (2015). AlgaeBase. World-wide electronic publication, National University of Ireland, Galway. http://www.algaebase.org (accessed on30 December 2015).
- Harrington, H.M. & Alm, D.M. (1988). Interaction of heat and salt shock in cultured tobacco cells. Plant Physiology, 88: 618–625.
- Higashiyama, T. (1967a). “Gigantism” of Chlorella vulgaris I, relation of gigantism to cell growth and division. Plant Cell Physiology, 8: 567–579.
- Higashiyama, T. (1967b). “Gigantism” of Chlorella vulgaris II, mechanism of induction of gigantism. Plant Cell Physiology, 8: 581–593.
- Hoshina, R. & Fujiwara, Y. (2013). Molecular characterization of Chlorella cultures of the National Institute for Environmental Studies culture collection with description of Micractinium inermum sp. nov., Didymogenes sphaerica sp. nov., and Didymogenes soliella sp. nov. (Chlorellaceae, Trebouxiophyceae). Phycological Research, 61: 124–132.
- Hu, H., Li, H. & Xu, X. (2008). Alternative cold response modes in Chlorella (Chlorophyta, Trebouxiophyceae) from Antarctica. Phycologia, 47: 28–34.
- Jonker, C.Z., Van Ginkel, C. & Olivier, J. (2013). Association between physical and geochemical characteristics of thermal springs and algal diversity in Limpopo Province, South Africa. Africans Journals OnLine, 39: 95–104.
- Kessler, E. (1985). Upper limits of temperature for growth in Chlorella (Chlorophyceae). Plant Systematics and Evolution, 151: 67–71.
- Krienitz, L., Bock, C., Luo, W. & Pröschold, T. (2010). Polyphyletic origin of the Dictyosphaerium morphotype within Chlorellaceae (Trebouxiophyceae). Journal of Phycology, 46: 559–563.
- Levasseur, M., Thompson, P.A. & Harrison, P.J. (1993). Physiological acclimation of marine phytoplankton to different nitrogen sources. Journal of Phycology, 29: 587–595.
- Lorenzen, H. (1963). Temperatureinfliisse auf Chlorella pyrenoidosa unter besonderer Beriicksichtigung der Zellentwicklung. Flora, 153: 554–592.
- Lou, Y. & Yousef, A.E. (1997). Adaptation to sublethal environmental stresses protects Listeria monocytogenes against lethal preservation factors. Applied Environmental Microbiology, 63: 1252–1255.
- Luo, W., Pflugmacher, S., Pröschold, T., Walz, N. & Krienitz, L. (2006). Genotype versus phenotype variability in Chlorella and Micractinium (Chlorophyta, Trebouxiophyceae). Protist, 157: 315–333.
- Luo, W., Pröschold, T., Bock, C. & Krienitz, L. (2010). Generic concept in Chlorella-related coccoid green algae (Chlorophyta, Trebouxiophyceae). Plant Biology, 12: 545–553.
- Mahboob, S., Rauf, A., Ashraf, M., Sultana T., Sultana, S., Jabeen, F. & Al-Ghanim, K.A. (2012). High-density growth and crude protein productivity of a thermotolerant Chlorella vulgaris: production kinetics and thermodynamics. Aquaculture International, 20: 455–466.
- Malis-Arad, S. & McGowan, R. (1982). Alkalinity-induced aggregation in Chlorella vulgaris II. Changes in the cell wall during the cell cycle. Plant Cell Physiology, 23: 11–17.
- Malis-Arad, S., Friedlander, M., Ben Arie, R. & Richmond, A.E. (1980). Alkalinity-induced aggregation in Chlorella vulgaris I. Changes in cell volume and cell wall structure. Plant Cell Physiology, 21: 27–35.
- Merchant, R.E. & Andre, C.A. (2001). A review of recent clinical trials of the nutritional supplement Chlorella pyrenoidosa in the treatment of fibromyalgia, hypertension, and ulcerative colitis. Alternative Therapies in Health and Medicine, 7: 79–91.
- Mittler, R. (2006). Abiotic stress, the field environment and stress combination. Trends in Plant Science, 11: 15–19.
- Onay, M., Sonmez, C., Oktem, A. & Yucel, A.M. (2014). Thermo-resistant green microalgae for effective biodiesel production: isolation and characterization of unialgal species from geothermal flora of Central Anatolia. Bioresource Technology, 169: 62–71.
- Ong, S.C., Kao, C.Y., Chiu, S.Y., Tsai, M.T. & Lin, C.S. (2010). Characterization of the thermal-tolerant mutant of Chlorella sp. with high growth rate and application in outdoor photobioreactor cultivation. Bioresource Technology, 101: 2880–2883.
- Ono, E. & Cuello, J.L. (2002). Selection of optimal microalgae species for CO2 sequestration. The University of Arizona, Department of Agricultural and Biosystems Engineering. http://www.netl.doe.gov/publications/proceedings/03/carbon-seq/PDFs/158.pdf
- Orús, M.I., Marco, E. & Martínez, F. (1991). Suitability of Chlorella vulgaris UAM 101 for heterotrophic biomass production. Bioresource Technology, 38: 179–184.
- Pluthero, F.G. (1993). Rapid purification of high-activity Taq DNA polymerase. Nucleic Acids Research, 21: 4850–4851.
- Pulz, O. (2001). Photobioreactors: production systems for phototrophic micro-organisms. Applied Microbiology and Biotechnology, 57: 287–293.
- Pulz, O. & Gross, W. (2004). Valuable products from biotechnology of microalgae. Applied Microbiology and Biotechnology, 65: 635–648.
- Roberts, D.M. (1999). Eukaryotic cells under extreme conditions. In Enigmatic Microorganisms and Life in Extreme Environments (Seckbach, J., editor), 163–173. Kluwer Academic Publishers, the Netherlands.
- Rodriguez-Lopez, M. (1963). Gigantism-inducing factors in Chlorella pyrenoidosa. Nature, 199: 506–7.
- Rodriguez-Lopez, M. & Candela, R. (1962). A giant form of Chlorella pyrenoidosa. Nature, 196: 691.
- Sakai, N., Sakamoto, Y., Kishimoto, N., Chihara, M. & Karube, I. (1995). Chlorella strains from hot springs tolerant to high temperatures and high CO2. Energy Conversion and Management, 36: 693–696.
- Šetlik, I., Zachleder, V., Doucha, J., Berkova, E. & Bartos, J. (1975). The nature of the temperature block in the sequence of reproduction processes in Chlorella vulgaris Beikerinck. Archiv für Hydrobiologie (Supplementband), 49: 70–104.
- Sheehan, J., Dunahay, T., Benemann, J. & Roessler, P. (1998). A look back at the U.S. Department of Energy’s Aquatic Species Program – biodiesel from algae. Prepared for: U.S. Department of Energy’s Office of Fuels Development. http://www.nrel.gov/biomass/pdfs/24190.pdf.
- Shen, H. & Lee, Y.K. (1997). Thermotolerance induced by heat shock in Chlorella. Journal of Applied Phycology, 9: 471–475.
- Sluiman, H.J., Kouwets, F.A.C. & Blommers, P.C.J. (1989). Classification and definition of cytokinetic patterns in green algae: sporulation versus (vegetative) cell division. Archiv für Protistenkunde, 137: 277–290.
- Sorokin, C. (1959). Tabular comparative data for the low- and high temperature strains of Chlorella. Nature ( London), 184: 613.
- Sorokin, C. & Myers, J. (1953). A high-temperature strain of Chlorella. Science, 117: 330–331.
- Sorokin, C. & Krauss, R.W. (1965). The dependence of cell division in Chlorella on temperature and light intensity. American Journal of Botany, 52: 331–339.
- Stockner, J.G. (1967). Observations of thermophilic algal communities in Mount Rainier and Yellowstone National Parks. Limnology and Oceanography, 12: 13–17.
- Tamura, K. (1992). Estimation of the number of nucleotide substitutions when there are strong transition-transversion and G + C-content biases. Molecular Biology and Evolution, 9: 678–687.
- Tamura, K. & Nei, M. (1993). Estimation of the number of nucleotide substitutions in the control region of mitochondrial DNA in humans and chimpanzees. Molecular Biology and Evolution, 10: 512–526.
- Tamura, K., Stecher, G., Peterson, D., Filipski, A. & Kumar, S. (2013). MEGA6: Molecular Evolutionary Genetics Analysis version 6.0. Molecular Biology and Evolution, 30: 2725–2729.
- Thinh, L.V. & Griffiths, D.J. (1980). The effect of L-arginine on the growth of heterotrophic cultures of the Emerson strain of chlorella. III. Studies with the structural analogue canavanine. New Phytologist, 84: 429–437.
- Van Den Hoek, C., Mann, D.G. & Jahns, H.M. (1995). Algae: An Introduction to Phycology. Cambridge University Press, Cambridge.
- Wang, L., Min, M., Li, Y., Chen, P., Chen, Y., Liu, Y., Wang, Y. & Ruan, R. (2010). Cultivation of green algae Chlorella sp. in different wastewaters from municipal wastewater treatment plant. Applied Biochemistry and Biotechnology, 162: 1174–1186.
- White, T., Bruns, T., Lee, S. & Taylor, J. (1990). Amplification and direct sequencing of fungal ribosomal RNA genes for phylogenetics. In PCR Protocols: A Guide To Methods And Applications – A Laboratory Manual (Innis, M.A., Gelfand, D.H., Sninsky, J.J., White, T.J., eds), 315–322. Academic Press, London.
- Wijffels, R.H. & Barbosa, M.J. (2010). An outlook on microalgal biofuels. Science ( Washington), 329: 796–799.
- Yamamoto, M., Nozaki, H., Miyazawa, Y., Koide, T. & Kawano, S. (2003). Relationship between presence of a mother cell wall and speciation in the unicellular microalga nannochloris (chlorophyta) 1. Journal of Phycology, 39: 172–184.
- Zuppini, A., Gerotto, C. & Balda, B. (2010). Programmed cell death and adaptation: two different types of abiotic stress response in a unicellular Chlorophyte. Plant Cell Physiology, 51: 884–895.