
ABSTRACT
An ecological classification at the local scale may be a useful tool for conservation planning and for the implementation of specific management programmes in a region. For this purpose, a methodology previously applied on a small scale has been adapted to classify the coast of Cantabria (N Spain). This methodology includes a physical classification and biological validation. The shoreline was divided into 1 km stretches, and the abiotic variables (sea surface temperature, photosynthetically active radiation, significant wave height and coastal morphology) were recorded for each stretch. A hierarchical classification was proposed, with a first level that encompassed a grouping of quantitative variables based on SOM and k-mean analysis and a second level that subdivided the previous groups according to the categorical variable ‘coastal morphology’. To validate the classification using biological data, cover of intertidal macroalgal species was obtained at 14 sites along the study area, and several statistical analyses were applied to test the ecological significance of this classification. Three physical units were obtained (western (W), central (C) and eastern (E) coast), based on abiotic variables. Each group was then subdivided into subunits according to its coastal morphology (cliffs or wave-cut platforms). A general agreement between the macroalgal distribution and physical units was accomplished. In the lower intertidal, Bifurcaria bifurcata and Halopteris scoparia dominated the western and central areas, whereas Corallina spp./Ellisolandia elongata and Gelidium spp. were most abundant towards the east. In contrast, throughout the middle intertidal, Corallina. spp./E. elongata were the dominant taxa. The classification system developed in this study completes a hierarchical framework for classifying the NE Atlantic coast, a promising approach that permits the application of the most suitable resolution in each case study that could be applicable to a wide range of coastal areas.
Introduction
Integrated coastal management requires the characterization of marine assemblages in order to conserve their integrity and the ecosystem services they provide (Douvere, Citation2008; Douvere & Ehler, Citation2009). In this framework, ecological classification is a useful tool that facilitates the quantification of the responses of biological patterns and processes to human uses in a defined region. This classification may also be useful for the development of conservation strategies designed to conserve species in degraded or fragmented areas, as well as in habitats that are being modified as a result of global change (Rice et al., Citation2011). Classifications have been developed and used at several scales, ranging from broad biogeographic provinces to fine-scale divisions. The availability of classifications at different scales represents an essential element in the development of action plans at scales that are both ecologically meaningful and appropriate for management and conservation needs (Bianchi et al., Citation2012). This is particularly important for many policies and management initiatives that also have a range of spatial scales, with goals set for national or regional domains but implemented at more local scales (Rice et al., Citation2011).
Local areas need to be addressed on a case-by-case basis because each is unique in terms of the specific environmental, social and economic characteristics (Reis, Citation2014). The European Union Habitats Directive (92/43/EEC) requires detailed mapping information for the different habitats represented on the coast in order to define and classify Sites of Community Importance (SCIs). The Water Framework Directive (WFD; 2000/60/EC) and the Marine Strategy Framework Directive (MSFD; 2008/56/EC) both established general regions and typologies based on abiotic attributes, but these regions are not always defined at the required level of detail. Therefore, future proposals need to find the balance between being too specific (too many types) and being too general (types do not sufficiently reflect natural variability; Hering et al., Citation2010). In addition, many adaptation and mitigation actions for climate change must take place at reduced scales and are site-specific due to the different vulnerability and resilience of local ecosystems (McCarthy et al., Citation2001). Thus, classifications at a local scale may be useful for conservation planning and for the implementation of effective monitoring programmes in a particular region (Hawkins et al., Citation2000). Along the NE Atlantic coast, a variety of classifications have been applied at European (Ramos et al., Citation2012, Citation2014) and regional scales (Ramos et al., Citation2016), but another approach with higher resolution would be required to cover the complete range of spatial scales. This work is focused on the local scale, a key level in coastal management approaches (Stojanovic et al., Citation2010; Sale et al., Citation2014).
The general premise in recent studies concerning classification systems is that biological communities respond to physiographic variables that are used to delineate ecological units (Gregr et al., Citation2012; Ramos et al., Citation2014, Citation2016). Thus, more easily measured physical or chemical variables, which rely increasingly on remote sensing (Ramos et al., Citation2012; Allee et al., Citation2014) and models (Parravicini et al., Citation2009), are used as surrogates of biological patterns.
In this context, several hierarchical classification systems have been developed. These different approaches can be ‘top down’ (Roff et al., Citation2003) through the application of geophysical factors, or ‘bottom up’ (Connor et al., Citation1995, Citation2004) via cluster analysis of biological and physical data, or a comparison of both (Shumchenia & King, Citation2010). There are also approaches that consider biogeographic regions as well as abiotic and biotic factors (Parry et al., Citation2015). The methodology developed by Ramos et al. (Citation2012) uses standardized physical data and intends to remove any ambiguity in the use of subjective classification schemes, ensuring that results are reliable and provide a sound foundation for ascertaining statistically different groups. Besides, its biological validation supports the ecological relevance of this approach (Ramos et al., Citation2014).
At the European level, the European Nature Information System (EUNIS) is a widely applied hierarchical classification which combines physicochemical with biological characteristics (Davies et al., Citation2004). Nevertheless, an effort should be made to improve the detail of biotope descriptions to reflect all local types (Galparsoro et al., Citation2012, Citation2015). The approach proposed here is comparable to EUNIS classification Levels 4 and 5 but with a different structure. The EUNIS approach is static over time, against the need for a dynamic system that can be adapted to changes or predict future scenarios. It is also a broad system, not specific to coastal waters and their characteristics. The rigidity of the physical variables does not allow adaptation of the classification scheme to different communities. The thresholds of abiotic indicators in EUNIS are not clearly defined and the decision on a category may be misleading, therefore a numerical approach would provide a more objective system.
Macroalgal assemblages are key elements for the functioning of marine ecosystems, as they provide food, habitat and shelter for many marine life forms (Raffaelli et al., Citation1998; Cavanaugh et al., Citation2010) and act as a physical structure, modifying the hydrodynamic forces and sediment transport (Madsen et al., Citation2001; Venier et al., Citation2012). Temperature, wave action and light are important factors determining seaweed distribution, controlling community composition and extension (Dayton, Citation1971; van den Hoek, Citation1982; Lüning, Citation1990). However, factors other than climatological and oceanographic ones are important in the distribution of macroalgae at a local scale, such as geomorphological features (McGuinness & Underwood, Citation1986; McGuinness, Citation1989; Bird, Citation2008; Ramos et al., Citation2015) and the level in the intertidal zone (Wallenstein & Neto, Citation2006; Chappuis et al., Citation2014). Therefore, these factors should also be considered in a classification developed in a reduced area.
The northern coast of the Iberian Peninsula presents some unique biogeographical characteristics, with a marked longitudinal gradient in the distribution of macroalgae (Sauvageau, Citation1897; Fischer-Piette, Citation1963). The transitional character of this coastal area (Ramos et al., Citation2016) is also relevant to the study of the responses of intertidal communities to gradual variations in environmental conditions, such as those caused by climate change. For example, there is evidence that the boundaries of some species have moved eastwards and westwards during the last century (cf. Arrontes, Citation2002; Fernández, Citation2011; Guinda et al., Citation2012). The northern Iberian Peninsula therefore appears appropriate for developing a local-scale classification. The area is enclosed within one biotype at a European scale (A2, the southern group characterized mostly by rhodophytes) (Ramos et al., Citation2012, Citation2014) and in the same typology at a regional level (E Cantabric, dominated by Corallina spp./Ellisolandia elongata, accompanied by Bifurcaria bifurcata in the lower intertidal and by Caulacanthus ustulatus in the middle intertidal) (Ramos et al., Citation2016). Regarding physical characteristics, the coastline is dominated by rocky substrata, with cliffs and wave-cut platforms intercalated by sandy beaches (Ramos et al., Citation2015). In general, this coast is very exposed because of its orientation towards the N and NW (the direction of the dominant winds), its own physiography and the prevailing hydrodynamic regime. The tides are semi-diurnal, with a mean tidal range of 3 m and a spring tidal range of 5 m.
The aim of this study was to establish a methodology for classifying coastal waters at a local scale based on physical variables and to verify the suitability of this methodology regarding the current distribution of intertidal macroalgae communities. This methodology follows approaches that were previously developed at the European and regional scales by Ramos et al. (Citation2012, Citation2014, Citation2016). Thus, an approach with a higher level of resolution will complete a hierarchical classification system from large to small areas along the NE Atlantic coast, a useful approach for the management and preservation of coastal ecosystems.
Methodology
Study area
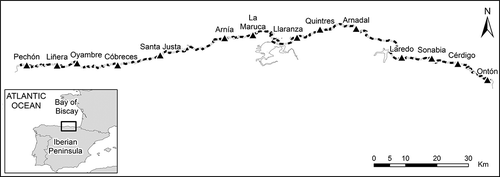
This study was conducted on the coast of Cantabria (c. 200 km long) in the northern Iberian Peninsula (NE Atlantic). An initial division of the entire study area into 1 km sections was undertaken by cutting a smooth digital coastline without estuaries using ArcGIS (ESRI). A total of 209 stretches were obtained. The length of the coastal stretches is in accordance with the variability of environmental conditions, the high level of detail required at the local scale, especially for coastal geomorphology and wave action, and properly characterizes the study area; thus, this length was considered optimal ().
Fig. 1. Location of the study area. Preliminary division of the coast of Cantabria into 1 km stretches (grey and black shading). Location of biological sampling sites as represented by triangles. Map projection: ETRS 1989.
Physical classification
Collection of physical data
The selection of abiotic variables was based on the criteria established by Ramos et al. (Citation2012) adapted to the local scale of this study. Thus, the physical indicators selected are: Sea Surface Temperature (SST) (mean minimum and 99th percentile (P99)), Photosynthetically Active Radiation (PAR) (mean and maximum), significant wave height and coastal morphology (cliff, wave-cut platform or beach). At this level of resolution, minimal changes in sea surface temperature, especially at higher temperatures, could determine the presence or absence of certain species (Fernández, Citation2011; Voerman et al., Citation2013). Because of this the annual 99th percentile was included. The tidal range, salinity and minimum PAR were not considered because they do not vary significantly throughout the study area. Finally, coastal morphology was included due to its influence on macrophytes at this local scale (Ramos et al., Citation2015).
Specific procedures were applied to obtain each variable due to their different attributes (). Temperature and radiation were estimated by satellite sensors. Data from the Group for High-Resolution Sea Surface Temperature (GHRSST) L4 products were used for SST and from MyOcean (MODIS-Aqua and SeaWIFS sensors) products for PAR. These data series were obtained from the nearest point to reference points situated 2 km from the coast in the centre of each stretch with satellite information. This distance from the coast allows satellite sensors to provide reliable data and the physical data found offshore can be associated with the environmental conditions along the intertidal (Ramos et al., Citation2012). The wave height was calculated along the depth of closure, which was considered appropriate for characterizing the intertidal area (Tomas et al., Citation2013), based on downscale wave reanalysis (DOW, Camus et al., Citation2013). Finally, coastal morphology was obtained by the analysis of the Geological Maps of Spain (Geological and Mining Institute of Spain, IGME) and in some cases, by fieldwork (Ramos et al., Citation2015).
Table 1. Data sources and methodologies for the quantification of each environmental variable.
Classification procedure
A two-step hierarchical classification was performed. The first step consisted of a statistical classification that included quantitative variables. Thus, coastal stretches were grouped according to physical data series combining two techniques: Self-Organizing Maps (SOM) (Kohonen, Citation2001), which is a technique that is included in neural networks (Artificial Neural Networks, ANNs), and the k-means algorithm (Hastie et al., Citation2001) (cf. Camus et al., Citation2011; Ramos et al., Citation2016). Map size determination is one of the key points in SOM application. In this study, the optimal map size (i.e. number of units or neurons of the SOM model output) was chosen based on the heuristic formula proposed by Vesanto et al. (Citation2000), , where M is the number of map units, and N is the number of samples in the training data. In addition, the number of chosen units was an optimal solution based on the minimum values for quantization and topographic errors by training with different map sizes. Prior to the SOM training, variables were normalized to an interval of [0, 1] by linear transformation for each variable in each stretch. SOM and k-means analyses were conducted using MATLAB 7.7 and the SOM coding solution based on SOM Toolbox for MATLAB 5 (Vesanto et al., Citation2000).
For the second level of the classification, the previously obtained units were subdivided by adding the categorical variable coastal morphology. Thus, statistical units were segregated between cliffs and wave-cut platforms (subunits).
Biological validation and characterization
Collection of macroalgal data
To obtain biological data, a homogeneous and standardized sampling methodology was conducted during spring tides in April 2011, and May and June 2012. Fourteen sites were surveyed along the coast of Cantabria (; Supplementary table S1), as specified in Ramos et al. (Citation2015). At every site, three transects were established perpendicular to the coast, if possible according to intrinsic characteristics of each area. Inside each transect, a stratified sampling was carried out by the distribution of three sample stations (quadrats) of 50 × 50 cm in the lower and middle intertidal, as this was the suitable sample size for sampling intertidal macroalgae in the area (Anadón & Niell, Citation1981; Anadón & Fernández, Citation1986). According to Ramos et al. (Citation2016), these levels are the intertidal horizons in which seaweeds are a structural element and, thus, where a biological validation should be performed. A total of 177 quadrats were recorded. The cover of macroalgal species was obtained by photo analyses as described in Ramos et al. (Citation2016), as this methodology has produced appropriate results in similar studies (Guinda et al., Citation2014). Algae were identified in situ to species level or assigned to higher taxonomic categories when species identification was not possible. If necessary a second photo of the grid was taken, removing the canopy species in order to quantify the organisms partially hidden by taller species.
Additionally, the height of each point of interest (i.e. quadrats, beginning and end of transects, and the limit between tidal levels) was calculated. The horizontal and diagonal distances from one point of interest to another were obtained using a measuring tape and a distance laser, respectively. Then, relative heights were estimated using the Pythagorean Theorem. The lowest sea level was calculated based on astronomical tides.
Biological validation and characterization procedure
Distribution maps were generated to analyse the macroalgal species patterns in both vertical and longitudinal gradients based on a data matrix with a mean cover of the most abundant species per height (quadrat) and site. Graphical schemes of interpolated cover values were used, representing the spatial distribution of sites along the coast on the X axis (based on UTM coordinates) and the height above the sea level gradient on the Y axis. The interpolation to create the coverage of isolines was performed using the Kriging method implemented in Surfer 8.0 software with default parameters. These maps are a proxy of cartography, a model of the distribution of the macroalgae species in height along the intertidal.
Several statistical analyses were then carried out to test the adjustment between macroalgal distribution and physical units (obtained by SOM and k-means analyses) and to examine the improvement of the physical classification by the addition of the variable coastal morphology (subunits). An MDS analysis was carried out to identify patterns and gradients in the macroalgal communities based on a Bray–Curtis similarity matrix with fourth-root-transformed cover data per quadrat. Vectors defining correlations between macroalgae and physical variables were also represented in the MDS graph. Then, a two-way ANOSIM test was applied to detect differences in the species composition among physical units and different categories of coastal morphology. Taxa making the greatest contribution to the similarity inside typologies and to the dissimilarity inside subunits were detected using SIMPER analysis within each intertidal level. These statistical analyses were performed with the package PRIMER-E (v.6 + PERMANOVA) (Clarke & Gorley, Citation2006).
An evaluation was also undertaken of similarities between the physical and biological variables using component planes (Vesanto, Citation1999). This analysis consists of the graphical representation of the physical variables that were previously included in the SOM and the macroalgal data. Only the 20 species with the highest mean cover per site in each intertidal level were represented. The simultaneous inspection of multiple component planes allows for the visualization of correlated variables because closed placed planes indicate similar behaviour or correlation between respective variables. This analysis was performed using MATLAB 7.7 and the SOM Toolbox 2.0 (Vesanto et al., Citation2000).
Results
Physical classification
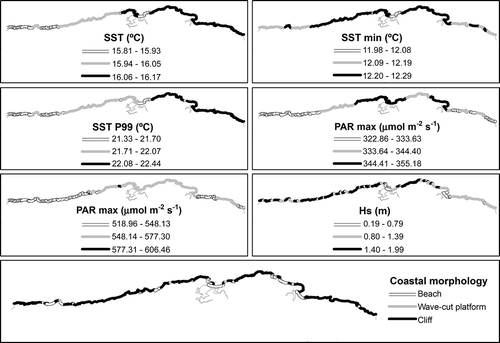
The geographic distribution of physical variables is depicted in . The values of each variable were represented by three equal interval classes. The mean and P99 sea surface temperature presented similar general patterns, progressively increasing eastwards. However, the minimum SST and mean and maximum PAR followed a different trend, being minimum at both border areas. By contrast, the mean and minimum SST showed a very narrow range, with P99 SST presenting a slightly higher range of c. 1°C. Regarding radiation indicators, the maximum exhibited a higher variability than did the mean. The exposure to wave action presented the highest range, with significant wave heights between 0.2 and 2 m. This variable also showed a more patchy pattern, although the lowest values were generally observed towards the east. At the same time, areas close to estuaries experienced minimum wave conditions due to their protected nature. Finally, the coastal morphology along the coast of Cantabria was mostly formed by cliffs (95%), interspersed with limited wave-cut platforms (3%) and beaches (2%), mainly around estuaries.
Fig. 2. Spatial distribution of physical variables along the coast of Cantabria. Visualization of data using three interval classes. From top left: mean SST, minimum SST, P99 SST, mean PAR, maximum PAR, mean wave height and coastal morphology.
As the first level of the physical classification, the six quantitative indicators were included in the SOM training. Based on the previously explained heuristic formula, the selected map size was 72 units (9 × 8 neurons). The trained map had minimum quantization and topographic errors, 0.13 and 0.02, respectively. This map preserved well the topology of the input data (Kohonen, Citation2001) and was relevant for subsequent interpretations.
The SOM technique produced a clustering of the dataset that makes it possible to observe intuitively how the stretches are grouped according to their characteristics (). However, for a more manageable and simplified classification, the k-means technique was applied to the groups obtained by the SOM. Considering the reduced study area, three groups were considered an adequate number to represent the natural environmental variability of the coast and to be a manageable classification for both management and scientific purposes. Figure 3 shows the limits of the groups that were obtained with this technique. The clusters are also presented on a geographic map of the study area to assist interpretations (Fig. 4).
Figs 3, 4. Fig. 3. Left: Gradient analysis of each physical variable on the trained SOM, right: k-means results on the SOM plane. Fig. 4. Geographic projections of the units obtained in physical classification (based on SOM and k-means statistical analyses results).
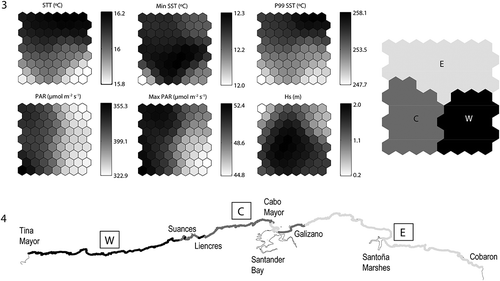
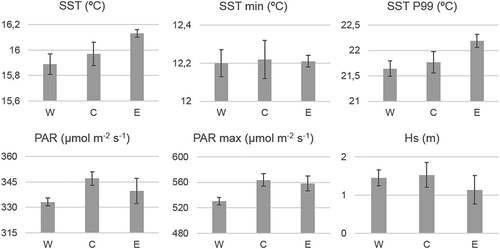
The mean and standard deviation values of each unit (k-means groups) are summarized in . As shown, some variables presented similar mean values between units due to the small study area. This similarity is especially marked in the case of the minimum SST variable, which has a mean value of 12.2°C in all groups. The main characteristics of the three obtained units were as follows:
W (Western coast): This area ranged from the border with Asturias (Tina Mayor) to the zone between Suances and Liencres and was characterized by the lowest SST and minimum radiation, with high wave height values.
C (Central coast): This area ranged from Liencres to the Bay of Santander, showing an intercalated section with the next unit (E) from Cabo Mayor until Galizano. This unit had the maximum values of PAR and wave height and low mean and P99 SST values.
E (Eastern coast): This area ranged from the eastern part of Cantabria, from Galizano to the border with Basque Country (Cobaron), and included an intercalated section in the Bay of Santander. This area was characterized by the lowest wave height and the higher mean and P99 temperature.
Fig. 5. Mean and standard deviation for each physical variable in each unit.
As the second level of the physical classification, a hierarchical scheme was made by adding the variable ‘Coastal morphology’ to the statistical classification. Thus, the units were subdivided into W-cliffs, W-wave-cut platforms, C-cliffs, C-wave-cut platforms, E-cliffs and E-wave-cut platforms.
Biological validation and characterization
Sixty-five different macroalgal taxa were identified: 62 in the lower intertidal and 55 in the middle (Supplementary table S2). Among these taxa, the most abundant were Corallina spp./Ellisolandia elongata, Bifurcaria bifurcata, Gelidium spinosum and Halopteris scoparia. The species richness ranged from 21 to 40 per site, in Sonabia and Liñera, respectively, with an overall mean of 35. Moreover, the Shannon–Wiener diversity ranged from 1.9 to 2.9 per site, in Quintres and Cóbreces, respectively, with an average value of 2.7.
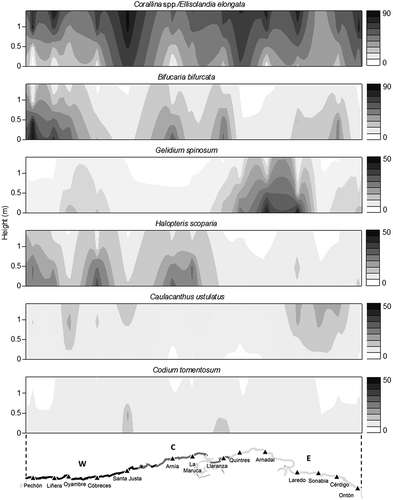
A proxy of cartography of the most important macroalgal species is shown in . These graphical schemes represent the location of the sites using coordinates (X axis) and the height above sea level from 0 to 1.4 m (the middle intertidal mean height as obtained in Cantabria) (Y axis). According to the mean height values, the limit between the lower intertidal and middle intertidal was c. 0.6 m along this coast. As shown in the abundance distribution maps, Corallina spp./E. elongata and B. bifurcata were, respectively, the dominant taxa in the middle and lower intertidal of Cantabria due to their extensive distribution and high cover. Corallina spp./E. elongata remained more or less constant along the entire longitudinal gradient, whereas B. bifurcata was more abundant in the W and C units. In the lower intertidal, there was a high cover of G. spinosum in the eastern area and of H. scoparia in the western and central areas. Finally, the remaining macroalgal species showed distribution patterns related to height, with different preferences for the middle (Caulacanthus ustulatus) or the lower intertidal (Codium tomentosum). Caulacanthus ustulatus also showed higher cover towards the east.
Fig. 6. Interpolated graphic representations of taxa distribution. The most abundant species (Corallina spp./Ellisolandia elongata, Bifurcaria bifurcata) have been represented with a cover legend from 0 to 90% and the accompanying ones (Gelidium spinosum, Halopteris scoparia, Caulacanthus ustulatus and Codium tomentosum) with a cover legend from 0 to 50%. Sample size, n=177 quadrats.
The ordination analysis ratified the general agreement between the macroalgal distribution and physical units, although there were noticeable differences between intertidal levels. As can be observed in Fig. 7, in the lower intertidal quadrats from unit E were differentiated on the right part of the graph, those from unit W were on the left and those from unit C were situated between them. In the middle intertidal, units C and E could also be differentiated, whereas quadrats of unit W were more dispersed. Figure 8 shows the pattern of coastal morphology variable within the two units that presented cliffs and wave-cut platforms (W and C). At both intertidal levels, the central group showed a clear difference between cliffs, located in the upper part of the MDS graph, and wave-cut platforms, located at the bottom. Regarding unit W, in the lower intertidal this pattern could still be distinguished, whereas in the middle intertidal cliffs and wave-cut platform the quadrats were distributed throughout the graph.
The species composition was significantly influenced by physical units and coastal morphology, although R values were generally low (). The greater differences in the middle intertidal level between the central and eastern units are particularly marked. Nevertheless, both levels showed small differences among western and eastern units (R-statistic = 0.18).
Table 2. The results of two-way ANOSIM tests performed at each tidal level considering units and coastal morphology factors. Pairwise comparisons within the factor units are also shown.
Similarity patterns for physical and biological variables could be distinguished considering the component planes (). Those variables with a strong correlation appear as component planes that are closest together. In the interpretation of species cover, the highest values (dark shading) vary among species, depending on each species’ absolute lowest and highest cover per site. Some taxa (Bifurcaria bifurcata in the lower intertidal and Corallina spp./Ellisolandia elongata in both levels) were abundant throughout the study area, and the shading scale represents where the cover was high or very high. In other cases, species did not appear in some locations, and the light shading represents the absence of the taxa (Asparagopsis armata and its tetrasporophytic phase, Falkenbergia rufolanosa, Caulacanthus ustulatus, Cryptopleura ramosa, Gelidium corneum, Cladostephus spongiosus and Halopteris scoparia in the lower intertidal; Chondracanthus acicularis, Cladophora rupestris, Gelidium spinosum, Hildenbrandia rubra, Leathesia marina, Lithophyllum tortuosum, Mesophyllum lichenoides, Pterosiphonia complanata and Ralfsia verrucosa in the middle intertidal; and Osmundea pinnatifida at both levels).
Figs 7, 8. MDS analysis based on macroalgal distribution. Fig. 7. Quadrats are represented according to biogeographic units (‘W’, ‘C’ or ‘E’) at each tidal level. Vectors define correlations between macroalgae and physical variables. Fig. 8. Quadrats are represented according to the coastal morphology (cliff or wave-cut platform) at each tidal level and in ‘W’ and ‘C’ units.
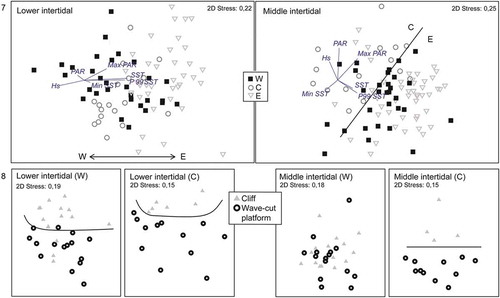
Fig. 9. Component planes ordering the physical variables and taxa in the lower and middle intertidal. Visualization of variables in a shading scale on the previously trained SOM. Taxa as follows: Asparagopsis armata, Bifurcaria bifurcata, Caulacanthus ustulatus, Chondracanthus acicularis, Cladophora rupestris, Cladostephus spongiosus, Codium tomentosum, Cryptoleura ramosa, Cystoseira baccata, Cystoseira tamariscifolia, Ellisolandia elongata, Falkenbergia rufolanosa, Gelidium corneum, Gelidium pusillum, Gelidium spinosum, Halopteris scoparia, Hildenbrandia rubra, Leathesia marina, Lithophyllum incrustans, Lithophyllum tortuosum, Mesophyllum lichenoides, Osmundea pinnatifida, Pterosphonia complanata, Ralfsia verrucosa. Physical variables: SST, Sea Surface Temperature; PAR, Photosynthetically Active Radiation; Hs, significant wave height.
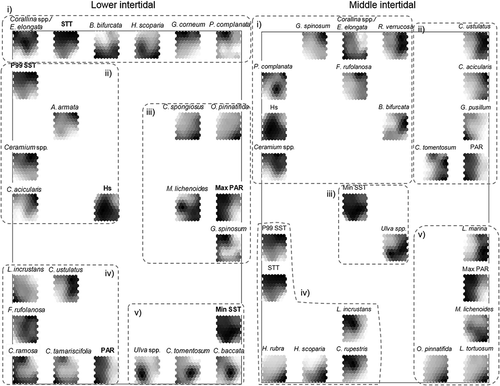
In the lower intertidal, five groups could be identified (): (i) in the top of the graph, the mean SST was related to higher abundance of Corallina spp./E. elongata, G. corneum and P. complanata where the temperature presented high values (unit E) and with higher abundance of B. bifurcata and Halopteris scoparia where the temperature was low (units W and C); (ii) in the left part of the graph, high P99 SST and low wave height were related to A. armata, Ceramium spp. and Chondracanthus acicularis (unit E); and (iii) Cladostephus spongiosus and O. pinnatifida had high cover in unit W, coinciding with low values of maximum PAR and P99 SST. At the same time, the maximum PAR showed positive correlations with G. spinosum (unit E) and negative correlations with M. lichenoides, which was also related to high wave height. (iv) In the bottom left part of the graph, radiation was related to high cover of Lithophyllum incrustans, Cryptopleura ramosa, and Cystoseira tamariscifolia and with low cover of Caulacanthus ustulatus and F. rufolanosa, which was widespread throughout the study area; (v) in the bottom right of the graph, the species Cystoseira baccata, Codium tomentosum and Ulva spp. were linked with the highest values of minimum SST (the two first ones related to unit W and the last one with unit C).
In the middle intertidal, five groups were distinguished (): (i) the variable wave height was related to several taxa, such as Corallina spp./E. elongata spp., which presented high cover when exposure to wave action was high (unit C), and G. spinosum, R. verrucosa, F. rufolanosa and B. bifurcata, which exhibited the opposite pattern, coinciding more or less with unit E, whereas P. complanata and Ceramium spp. were abundant where wave height values were medium or low; (ii) the radiation was positively correlated with G. pusillum (unit C) and negatively correlated with Caulacanthus ustulatus, Chondracanthus acicularis and Codium tomentosum; (iii) in the central part of the graph, Ulva spp. was related to the highest values of minimum temperature; (iv) L. incrustans and Cladophora rupestris appeared with a higher cover when both the mean and P99 sea surface temperatures were elevated (unit E), whereas Hildenbrandia rubra and Halopteris scoparia presented lower cover under these conditions (unit W); and finally, (v) the species Leathesia marina, M. lichenoides, Lithophyllum tortuosum and O. pinnatifida showed higher cover in the western units where the maximum PAR was low.
The main species composition of the obtained three units, with contributions to similarity according to SIMPER analysis, can be seen in Supplementary table S3. Regarding the second level of the classification, in the lower intertidal, inside both units W and C, B. bifurcata was more abundant in wave-cut platform subunits and Corallina spp./E. elongata and H. scoparia in cliffs. Besides, in the western area Codium tomentosum and Cystoseira baccata showed a higher cover in cliffs. In the middle intertidal differences were less clear because Corallina spp./E. elongata were the dominant taxa in all cases, although Caulacanthus ustulatus seemed to be more abundant in the wave-cut platform subunits (Supplementary table S4).
Discussion
In this study, a hierarchical classification along the NE Atlantic coast was completed focusing on the local scale (coast of Cantabria). Thus, detailed knowledge about both the distribution of intertidal macroalgal communities and the abiotic environment is available at European (Ramos et al., Citation2012, Citation2014), regional (Ramos et al., Citation2016) and now local scales. This multi-scale approach has the potential to successfully provide suitable detail for particular applications, consistent with the management activity that was considered in each case (Christensen et al., Citation1996).
Here, we have demonstrated the feasibility of using physicochemical variables obtained by satellite sensors and numerical modelling, easily measurable quantitative data that provide an objective classification system from lower to higher levels of resolution. Physical indicators present, in general, a low range of variation along a reduced study area, as is the case in this study. However, their combination into a statistical classification provides a suitable environmental characterization of the coast which makes ecological sense.
The zonation patterns along the intertidal found in this study correspond, in general, to those that have been described in the neighbouring coastal areas of Asturias (Fernández & Niell, Citation1982; Anadón, Citation1983) and Basque Country (Borja et al., Citation1995; Díez et al., Citation1999) and in small areas within Cantabria (Puente, Citation2000; Guinda et al., Citation2008; Juanes et al., Citation2008). In the middle intertidal, Corallina spp./Ellisolandia elongata form a continuous carpet, being the dominant taxa all along the coast of Cantabria. Below this level, there is a fringe that is structured by Bifurcaria bifurcata, although towards the east, Gelidium spinosum and Corallina spp./E. elongata are the dominant taxa (Borja et al., Citation1995). Regarding the longitudinal distribution, the coast of Cantabria exhibits the general pattern described along the northern Iberian Peninsula: from the west towards the east, Ochrophyta decreases and Rhodophyta species remain in the lower intertidal and shallow subtidal (Fischer-Piette, Citation1955; Anadón, Citation1983; Borja et al., Citation2004; Gorostiaga et al., Citation2004; Ramos et al., Citation2016).
Despite this general pattern, the highest differences in species composition are found not between the two extremes of the coast, but rather between the central (unit C) and the eastern areas (unit E), therefore they are not following a potential biogeographic gradient. This pattern seems to be caused by exposure to wave action, as this variable differs clearly between these two zones, reaching the highest values in unit C and the lowest in unit E. In contrast, the sea surface temperature follows a biogeographic pattern, increasing from west to east in accordance with a trend that is largely known at a smaller scale along the northern coast of the Iberian Peninsula (cf. Ramos et al., Citation2016). Thus, in local areas, the distribution of macroalgal species seems to be more affected by exposure to wave action than by temperature (Burrows, Citation2012; Connor et al., Citation2004), in contrast to what occurs within broad regions (van den Hoek, Citation1982; Breeman, Citation1988; Lüning, Citation1990; Hurd et al., Citation2014; Ramos et al., Citation2014).
The interaction between the environment and macroalgal communities at a local scale is an essential element of this study, including knowledge about the relationship between each physical variable and macroalgal species. Regarding exposure to wave action, we identified some associations that have also been reported in other areas. Such is the case for Pterosiphonia complanata, Ceramium spp., B. bifurcata, Chondracanthus acicularis and G. spinosum, more abundant in shelter to semi-exposed shores (Dixon & Irvine, Citation1977; Bárbara & Cremades, Citation1987; Cabioc’h et al., Citation1995; Puente, Citation2000), as well as Corallina officinalis/E. elongata and Mesophyllum lichenoides being related to high exposure to wave action (Stewart, Citation1989; Irvine & Chamberlain, Citation2011; Díaz-Tapia et al., Citation2013).
Specific connections between PAR and taxon distribution are rarely reported, although the effect of this variable in macroalgae is well known (e.g. Häder & Figueroa, Citation1997; Bischof et al., Citation2002). Along the coast of Cantabria, the associations found in both the lower and middle intertidal were characterized by a higher cover of Osmundea pinnatifida and Caulacanthus ustulatus, where PAR was low, and the opposite occurred in the case of M. lichenoides.
Regarding temperature, wide biogeographic patterns are not comparable with the relationships that were found in this study. However, these relationships can be compared with the results obtained in previous work at a regional scale along the N and NW Iberian Peninsula (Ramos et al., Citation2016). Some of the most abundant characteristic taxa (Corallina spp./E. elongata, B. bifurcata and Halopteris scoparia) showed similar patterns related to temperature at both scales (a positive relationship for the first one and a negative relationship for the last two). By contrast, opportunistic taxa (Ceramium spp. and Ulva spp.) had different relationships with this factor at the regional and local scales, suggesting that they are ubiquitous and do not have specific preferences for SST in these regions.
However, similar patterns between physical variables and species in the component planes analysis must be examined with caution, as these relationships might not be causal but relate to the correlation of variables with unmeasured factors. For example, bathymetric and topographic features, rockpools, sand and freshwater influence at each specific point could cause local modifications (e.g. Díaz-Tapia et al., Citation2013; Martín-García et al., Citation2013). However, the aim of this classification is to describe the macroalgal distribution pattern along a local scale, and thus site-specific factors such as the above mentioned have not been included. Also, other geomorphological factors, including substratum geology or mobility of rocks have not shown a direct relation with macroalgal species at the study scale, although they have inside each site (Ramos et al., Citation2015). Finally, anthropogenic pressures have not been included because this classification of the coast deals with the recognition of natural units based on ecological characteristics, which, in fact, could be applied to detect responses of biological patterns to human uses in a certain region (Rice et al., Citation2011). In contrast, biological interactions, such as competition or predation, are important factors affecting the species distribution at the local scale, especially in the lower intertidal (Janke, Citation1990; Nybakken, Citation1997). However, these factors are difficult to assess and quantify at the level required for this study and have not been included in the classification.
The 14 homogeneously distributed biological data sites seem to be adequate to represent the variability along the study area. Nevertheless, the establishment of more sites with different coastal geomorphology inside each unit will be interesting to test the differences among wave-cut platforms and cliff coasts. On the other hand, it would be advisable to use physical variables with a very high spatial and temporal resolution, thus the same for all variables. However, each variable has been obtained from a different source, which makes it difficult to accomplish this advice. In any case, it is considered that the environmental data used here properly characterize the average conditions in the area during the last decades.
The relationship between coastal geomorphology and intertidal macroalgal community composition has already been shown in the coast of Cantabria (Ramos et al., Citation2015). The addition of this variable provides a more detailed environmental characterization and a better explanation for the distribution of macroalgal species (Bermejo et al., Citation2015). Depending on the purpose (i.e. type of study, assessment or conservation plan), the addition of this variable could be necessary or not. Thus, the hierarchical approach is very useful, providing the option to decide in each case whether an increase in classification accuracy is required. However, given the few samples of each subunit, it is difficult to determine whether differences in species distribution are caused by the influence of coastal geomorphology or by the variation among sampling sites driven by other environmental factors.
In the framework of temporal variability, two of the applications of the obtained ecological classification are to gather data on the current ecological status and to elucidate future changes in the communities (Sales & Ballesteros, Citation2009). The inclusion of the meteoceanographic variables (SST, PAR, Hs) is advantageous, permitting the detection of possible changes in the distribution of macroalgal communities due to climate change (Martín-García et al., Citation2013). In this sense, the northern coast of the Iberian Peninsula is of note because here the distribution limits of cold temperate species have moved along a longitudinal gradient during the last century (Sauvageau, Citation1897; Fischer-Piette, Citation1957, Citation1963; Anadón & Niell, Citation1981; Fernández & Niell, Citation1982; Fernández, Citation2011; Díez et al., Citation2012; Duarte et al., Citation2013). The most recent movements include the westward regression of kelps associated with the increase in the maximum sea surface temperature from 1970 onwards (Planque et al., Citation2003; Gómez-Gesteira et al., Citation2008; Anadón et al., Citation2009; deCastro et al., Citation2009). Thus, the absence of a belt dominated by Laminaria ochroleuca and Saccorhiza polyschides throughout the entire study area agrees with this shift (Fernández & Niell, Citation1982; Anadón, Citation1983). Considering the great importance of temporal variability related to biological community modifications, the next step in the development of ecological classification systems should be to include the annual and seasonal variation of environmental variables or climatic index (e.g. NAO and ENSO), providing a comprehensive tool for a host of ecological and management applications (Carballo et al., Citation2002; Straile & Stenseth, Citation2007).
In conclusion, the classification developed in this study completes a hierarchical framework for classifying the NE Atlantic coast, a promising standard approach that permits the application of the most suitable resolution according to the study extension and that could be applicable to a wide range of coastal areas. The hierarchical approach adopted for the local scale divides the coast into three environmental units and five subunits by the addition of coastal morphology, providing the possibility of adopting a more appropriate scheme for study and management purposes. These units and subunits support different macroalgae assemblages. In general, in the lower intertidal, Bifurcaria bifurcata and Halopteris scoparia dominate the western and central areas, whereas Corallina spp./E. elongata and Gelidium spp. are most abundant towards the east. By contrast, throughout the middle intertidal, Corallina spp./E. elongata is the dominant taxa. These patterns in species distribution observed at the local scale seem to be explained mostly by the exposure to wave action. The classification methodology could be used as a useful tool in the environmental management of coastal waters, including the impact assessment of anthropogenic pressures or the vulnerability of macroalgae communities to climate change.
Supplementary information
The following supplementary material is accessible via the Supplementary Content tab on the article’s online page at http://dx.doi.org/10.1080/09670262.2016.1221469
Supplementary table S1. Georeference (start of the transect with a precision of 10 m), length and altitude of the upper-point of transects.
Supplementary table S2. Species list of obtained intertidal rocky shore macroalgae.
Supplementary table S3. Summarizing table of the hierarchical classification system (physical variables).
Supplementary table S4. SIMPER results based on the second level of the physical classification.
Supplementary Tables S1 to S4
Download MS Word (36.8 KB)Acknowledgements
We are grateful to A. de Ugarte, B. Ondiviela, M. Martinez, M. Recio, P. Ruiz and P. Ugarte for specific support in the fieldwork. This paper constitutes part of E. Ramos’ PhD thesis.
Additional information
Funding
Notes on contributors
Elvira Ramos
E. Ramos: original concept, data collection and treatment, drafting and editing manuscript; A. Puente: data treatment, editing and revising manuscript; X. Guinda: data collection, editing and revising manuscript; J.A. Juanes: original concept, editing and revising manuscript.
Araceli Puente
E. Ramos: original concept, data collection and treatment, drafting and editing manuscript; A. Puente: data treatment, editing and revising manuscript; X. Guinda: data collection, editing and revising manuscript; J.A. Juanes: original concept, editing and revising manuscript.
Xabier Guinda
E. Ramos: original concept, data collection and treatment, drafting and editing manuscript; A. Puente: data treatment, editing and revising manuscript; X. Guinda: data collection, editing and revising manuscript; J.A. Juanes: original concept, editing and revising manuscript.
José Antonio Juanes
E. Ramos: original concept, data collection and treatment, drafting and editing manuscript; A. Puente: data treatment, editing and revising manuscript; X. Guinda: data collection, editing and revising manuscript; J.A. Juanes: original concept, editing and revising manuscript.
Related Research Data
References
- Allee, R.J., Kurtz, J., Gould Jr, R.W., Ko, D.S., Finkbeiner, M. & Goodin, K. (2014). Application of the coastal and marine ecological classification standard using satellite-derived and modeled data products for pelagic habitats in the Northern Gulf of Mexico. Ocean and Coastal Management, 88: 13–20.
- Anadón, R. (1983). Zonación en la costa asturiana: variación longitudinal de las comunidades de macrófitos en diferentes niveles de marea. Investigación Pesquera, 45: 125–141.
- Anadón, R. & Niell, F.X. (1981). Distribución longitudinal de macrófitos en la costa asturiana. Investigación Pesquera, 45: 143–156.
- Anadón, R. & Fernández, C. (1986). Comparación de tres comunidades de horizontes intermareales con abundancia de Gelidium latifolium (Grev.) Born. et Thur. en la costa de Asturias (N de España). Investigación Pesquera, 50: 353–366.
- Anadón, R., Fernández, C., García Flórez, L., Losada, I. & Valdés, L. (2009). Evidencias y efectos potenciales del cambio climático en Asturias. 5. Costas y Océanos. In Evidencias y efectos potenciales del cambio climático en Asturias, pp. 126–170. Consejería de Medio Ambiente, Ordenación del Territorio e Infraestructuras, Gobierno del Principado de Asturias.
- Arrontes, J. (2002). Mechanisms of range expansion in the intertidal brown alga Fucus serratus in northern Spain. Marine Biology, 141: 1059–1067.
- Bárbara, I. & Cremades, J. (1987). Guía de las Algas del litoral gallego. Casa de las Ciencias, La Coruña.
- Bermejo, R., Ramírez-Romero, E., Vergara, J.J. & Hernández, I. (2015). Spatial patterns of macrophyte composition and landscape along the rocky shores of the Mediterranean Atlantic transition region (northern Alboran Sea). Estuarine, Coastal and Shelf Science, 155: 17–28.
- Bianchi, C., Parravicini, V., Montefalcone, M., Rovere, A. & Morri, C. (2012). The challenge of managing marine biodiversity: a practical toolkit for a cartographic, territorial approach. Diversity, 4: 419–452.
- Bird, E. (2008). Coastal Geomorphology: An Introduction. 2nd ed. John Wiley and Sons, Chichester.
- Bischof, K., Peralta, G., Kräbs, G., Van De Poll, W.H., Pérez-Lloréns, J.L. & Breeman, A.M. (2002). Effects of solar UV-B radiation on canopy structure of Ulva communities from Southern Spain. Journal of Experimental Botany, 53: 2411–2421.
- Borja, A., Valencia, V., García, A. & Arresti, A. (1995). Las comunidades bentónicas intermareales y submareales de San Sebastián-Pasajes (Guipúzcoa, Norte de España). Actas del IV Coloquio Internacional sobre Oceanografía del Golfo de Vizacaya: 165–181.
- Borja, Á., Aguirrezabalga, F., Martínez, J., Sola, J.C., García-Arberas, L. & Gorostiaga, J.M. (2004). Benthic communities, biogeography and resources management. In Oceanography and Marine Environment of the Basque Country (Borja, Á. & Collins, M., editors), 455–492. Elsevier, Amsterdam.
- Breeman, A.M. (1988). Relative importance of temperature and other factors in determining geographic boundaries of seaweeds: experimental and phenological evidence. Helgoländer Meeresunters uchungen, 42: 199–241.
- Burrows, M. T. (2012). Influences of wave fetch, tidal flow and ocean colour on subtidal rocky communities. Marine Ecology Progress Series, 445: 193–462.
- Cabioc’h, J., Floc’h, J.Y., Toquin, A.L., Boudouresque, C.F., Meinesz, A. & Verlaque, M. (1995). Guía de las algas de los mares de Europa: Atlántico y Mediterráneo. Ediciones Omega, S.A., Barcelona.
- Camus, P., Mendez, F.J., Medina, R. & Cofiño, A.S. (2011). Analysis of clustering and selection algorithms for the study of multivariate wave climate. Coastal Engineering, 58: 453–462.
- Camus, P., Mendez, F.J., Medina, R., Tomas, A. & Izaguirre, C. (2013). High resolution downscaled ocean waves (DOW) reanalysis in coastal areas. Coastal Engineering, 72: 56–68.
- Carballo, J.L., Olabarria, C. & Osuna, T.G. (2002). Analysis of four macroalgal assemblages along the Pacific Mexican Coast during and after the 1997–98 El Niño. Ecosystems, 5: 749–760.
- Cavanaugh, K.C., Siegel, D.A., Kinlan, B.P. & Reed, D.C. (2010). Scaling giant kelp field measurements to regional scales using satellite observations. Marine Ecology Progress Series, 403: 13–17.
- Clarke, K.R. & Gorley, R.N. (2006). PRIMER v6. User manual/tutorial. PRIMER-E Ltd, Plymouth.
- Chappuis, E., Terradas, M., Cefalí, M.E., Mariani, S. & Ballesteros, E. (2014). Vertical zonation is the main distribution pattern of littoral assemblages on rocky shores at a regional scale. Estuarine, Coastal and Shelf Science, 147: 113–122.
- Christensen, N.L., Bartuska, A.M., Brown, J.H., Carpenter, S., D’Antonio, C., Francis, R., Franklin, J.F., MacMahon, J.A., Noss, R.F., Parsons, D.J., Peterson, C.H., Turner, M.G. & Woodmansee, R.G. (1996). The report of the Ecological Society of America Committee on the scientific basis for ecosystem management. Ecological Applications, 6: 665–691.
- Connor, D.W., Hiscock, K., Foster-Smith, R.L. & Covey, R. (1995). A classification system for benthic marine biotopes. In Biology and Ecology of Shallow Coastal Waters. Proceedings of the 28th European Marine Biological Symposium (Eleftheriou, A. et al., editors), 155–165. International Symposium Series, Crete, Greece.
- Connor, D.W., Allen, J.H., Golding, N., Howell, K.L., Lieberknecht, L.M., Northen, K.O. & Reker, J.B. (2004). The Marine Habitat Classification for Britain and Ireland Version 04.05. JNCC, Peterborough.
- Davies, C.E., Moss, D. & Hill, M.O. (2004). EUNIS Habitat Classification Revised 2004. Report to the European Topic Centre on Nature Protection and Biodiversity. European Environment Agency, 307 pp.
- Dayton, P.K. (1971). Competition, disturbance and community organization: the provision and subsequent utilization of space in a rocky intertidal community. Ecological Monograph, 41: 351–389.
- deCastro, M., Gómez-Gesteira, M., Alvarez, I. & Gesteira, J.L.G. (2009). Present warming within the context of cooling-warming cycles observed since 1854 in the Bay of Biscay. Continental Shelf Research, 29: 1053–1059.
- Díaz-Tapia, P., Bárbara, I. & Díez, I. (2013). Multi-scale spatial variability in intertidal benthic assemblages: differences between sand-free and sand-covered rocky habitats. Estuarine, Coastal and Shelf Science, 133: 97–108.
- Díez, I., Secilla, A., Santolaria, A. & Gorostiaga, J.M. (1999). Phytobenthic intertidal community structure along an environmental pollution gradient. Marine Pollution Bulletin, 38: 463–472.
- Díez, I., Muguerza, N., Santolaria, A., Ganzedo, U. & Gorostiaga, J.M. (2012). Seaweed assemblage changes in the eastern Cantabrian Sea and their potential relationship to climate change. Estuarine, Coastal and Shelf Science, 99: 108–120.
- Dixon, P.S. & Irvine, L.M. (1977). Seaweeds of the British Isles. Volume 1. Rhodophyta. Part 1, Introduction, Nemaliales, Gigartinales. Natural History Museum, London.
- Douvere, F. (2008). The importance of marine spatial planning in advancing ecosystem-based sea use management. Marine Policy, 32: 762–771.
- Douvere, F. & Ehler, C.N. (2009). New perspectives on sea use management: initial findings from European experience with marine spatial planning. Journal of Environmental Management, 90: 77–88.
- Duarte, L., Viejo, R.M., Martínez, B., deCastro, M., Gómez-Gesteira, M. & Gallardo, T. (2013). Recent and historical range shifts of two canopy-forming seaweeds in North Spain and the link with trends in sea surface temperature. Acta Oecologica, 51: 1–10.
- Fernández, C. (2011). The retreat of large brown seaweeds on the north coast of Spain: the case of Saccorhiza polyschides. European Journal of Phycology, 46: 352–360.
- Fernández, C. & Niell, F.X. (1982). Zonación del fitobentos intermareal de la región de Cabo Peñas (Asturias). Investigación pesquera, 46: 121–141.
- Fischer-Piette, E. (1955). Répartition le long des côtes septentrionales de l’Espagne des principales espèces peuplant les rochers intercotidaux. Annales de L’Institut Océanographique, 31: 38–124.
- Fischer-Piette, E. (1957). Sur les déplacements de frontières biogéographiques, observés au large des côtes iberiques dans le domaine intercotidale. Publicaciones del Instituto de Biología Aplicada, 26: 35–40.
- Fischer-Piette, E. (1963). La distribution des principaux organismes intercotidaux nord-ibériques en 1954–1955. Annales de l’Institut Océanographique, 40: 35–302.
- Galparsoro, I., Connor, D.W., Borja, A., Aish, A., Amorim, P., Bajjouk, T., Chambers, C., Coggan, R., Dirberg, G., Ellwood, H., Evans, D., Goodin, K.L., Grehan, A., Haldin, J., Howell, K., Jenkins, C., Michez, N., Mo, G., Buhl- Mortensen, P., Pearce, B., Populus, J., Salomidi, M., Sanchez, F., Serrano, A., Shumchenia, E., Tempera, F. & Vasquez, M. (2012). Using EUNIS habitat classification for benthic mapping in European seas: present concerns and future needs. Marine Pollution Bulletin, 64: 2630–2638.
- Galparsoro, I., Rodriguez, J.G., Menchaca, I., Quincoces, I., Garmendia, J.M. & Borja, A. (2015). Benthic habitat mapping on the Basque continental shelf (SE Bay of Biscay) and its application to the European Marine Strategy Framework Directive. Journal of Sea Research, 100: 70–76.
- Gómez-Gesteira, M., deCastro, M., Alvarez, I. & Gómez-Gesteira, J.L. (2008). Coastal sea surface temperature warming trend along the continental part of the Atlantic Arc (1985–2005). Journal of Geophysical Research: Oceans, 113(C4): C04010.
- Gorostiaga, J.M., Santolaria, A., Secilla, A., Casares, C. & Díez, I. (2004). Check-list of the Basque coast benthic algae (North of Spain). Anales del Jardín Botánico de Madrid, 61: 155–180.
- Gregr, E.J., Ahrens, A.L. & Ian Perry, R. (2012). Reconciling classifications of ecologically and biologically significant areas in the world’s oceans. Marine Policy, 36: 716–726.
- Guinda, X., Juanes, J.A., Puente, A. & Revilla, J.A. (2008). Comparison of two methods for quality assessment of macroalgae assemblages, under different pollution types. Ecological Indicators, 8: 743–753.
- Guinda, X., Juanes, J.A., Puente, A. & Echavarri-Erasun, B. (2012). Spatial distribution pattern analysis of subtidal macroalgae assemblages by a non-destructive rapid assessment method. Journal of Sea Research, 67: 34–43.
- Guinda, X., Gracia, A., Puente, A., Juanes, J.A., Rzhanov, Y. & Mayer, L. (2014). Application of landscape mosaics for the assessment of subtidal macroalgae communities using the CFR index. Deep Sea Research Part II: Topical Studies in Oceanography, 106: 207–215.
- Häder, D.P. & Figueroa, F.L. (1997). Photoecophysiology of marine macroalgae. Photochemistry and Photobiology, 66: 1–14.
- Hastie, T., Tibshirani, R. & Friedman, J. (2001). The Elements of Statistical Learning: Data Mining, Inference, and Prediction. Springer Verlag, New York.
- Hawkins, C.P., Norris, R.H., Gerritsen, J., Huges, R.M., Jackson, S.K., Johnson, R.K. & Stevenson, R.J. (2000). Evaluation of the use of landscape classifications for the prediction of freshwater biota: synthesis and recommendations. Journal of the North American Benthological Society, 19: 541–556.
- Hering, D., Borja, A., Carstensen, J., Carvalho, L., Elliott, M., Feld, C.K., Heiskanen, A.-S., Johnson, R.K., Moe, J., Pont, D., Solheim, A.L. & de Bund, W.v. (2010). The European Water Framework Directive at the age of 10: a critical review of the achievements with recommendations for the future. Science of the Total Environment, 408: 4007–4019.
- Hurd, C.L., Harrison, P.J., Bischof, K. & Lobban, C.S. (2014). Physico-chemical factors as environmental stressors in seaweed biology. In Seaweed Ecology and Physiology. 2nd ed., pp. 294–347. Cambridge University Press, Cambridge.
- Irvine, L.M. & Chamberlain, Y.M. (2011). Seaweeds of the British Isles. Volume 1 Rhodophyta. Part 2B. Corallinales, Hildenbrandiales. Natural History Museum, London.
- Janke, K. (1990). Biological interactions and their role in community structure in the rocky intertidal of Helgoland (German Bight, North Sea). Helgoländer Meeresuntersuchungen, 44: 219–263.
- Juanes, J.A., Guinda, X., Puente, A. & Revilla, J.A. (2008). Macroalgae, a suitable indicator of the ecological status of coastal rocky communities in the NE Atlantic. Ecological Indicators, 8: 351–359.
- Kohonen, T. (2001). Self-organizing Maps. 3rd ed. Springer, Berlin.
- Lüning, K. (1990). Seaweeds: Their Environment, Biogeography, and Ecophysiology. John Wiley & Sons, New York.
- Madsen, J.D., Chambers, P.A., James, W.F., Koch, E.W. & Westlake, D.F. (2001). The interaction between water movement, sediment dynamics and submersed macrophytes. Hydrobiologia, 444: 71–84.
- Martín-García, L., González-Lorenzo, G., Brito-Izquierdo, I.T. & Barquín-Diez, J. (2013). Use of topographic predictors for macrobenthic community mapping in the Marine Reserve of La Palma (Canary Islands, Spain). Ecological Modelling, 263: 19–31.
- McCarthy, J.J., Canziani, O.F., Leary, N.A., Dokken, D.J. & White, K.S. (2001). Climate Change 2001: Impacts, Adaptation, and Vulnerability: contribution of Working Group II to the third assessment report of the Intergovernmental Panel on climate change. Cambridge University Press, Cambridge.
- McGuinness, K.A. (1989). Effects of some natural and artificial substrata on sessile marine organisms at Galeta Reef, Panama. Marine Ecology Progress Series, 52: 201–208.
- McGuinness, K.A. & Underwood, A.J. (1986). Habitat structure and the nature of communities on intertidal boulders. Journal of Experimental Marine Biology and Ecology, 104: 97–123.
- Nybakken, J.W. (1997). Intertidal ecology. In Marine Biology: An Ecological Approach (Pusateri, C., editor), 219–284. Addison-Wesley Educational Publishers, USA.
- Parravicini, V., Morri, C., Ciribilli, G., Montefalcone, M., Albertelli, G. & Bianchi, C.N. (2009). Size matters more than method: Visual quadrats vs photography in measuring human impact on Mediterranean rocky reef communities. Estuarine, Coastal and Shelf Science, 81: 359–367.
- Parry, M.E.V., Howell, K.L., Narayanaswamy, B.E., Bett, B.J., Jones, D.O.B., Hughes, D.J., Piechaud, N., Nickell, T.D., Ellwood, H., Askew, N., Jenkins, C. & Manca, E. (2015). A Deep-sea Section for the Marine Habitat Classification of Britain and Ireland. JNCC report No. 530. Joint Nature Conservation Committee, Peterborough.
- Planque, B., Beillois, P., Jégou, P., Lazure, P.M., Petitgas, P. & Puillat, I. (2003). Large scale hydroclimatic variability in the Bay of Biscay. The 1990s in the context of interdecadal changes. ICES Marine Science Symposium, 219: 61–70.
- Puente, A. (2000). Distribución y estructura de las comunidades de macroalgas de la isla de Mouro (Cantabria, golfo de Vizcaya). Consideraciones sobre su aplicación en la vigilancia ambiental de espacios litorales. PhD. Thesis. E.T.S de Ingenieros de Caminos, Canales y Puertos. Dpto. de Ciencias y Técnicas del Agua y del Medio Ambiente, Universidad de Cantabria, Santander.
- Raffaelli, D., Raven, J.A. & Poole, L.J. (1998). Ecological impact of green macroalgal blooms. Oceanography and Marine Biology – An Annual Review, 36: 97–125.
- Ramos, E., Juanes, J.A., Galván, C., Neto, J.M., Melo, R., Pedersen, A., Scanlan, C., Wilkes, R., van den Bergh, E., Blomqvist, M., Karup, H.P., Heiber, W., Reitsma, J.M., Ximenes, M.C., Silió, A., Méndez, F. & González, B. (2012). Coastal waters classification based on physical attributes along the NE Atlantic region. An approach for rocky macroalgae potential distribution. Estuarine, Coastal and Shelf Science, 112: 105–114.
- Ramos, E., Puente, A., Juanes, J.A., Neto, J.M., Pedersen, A., Bartsch, I., Scanlan, C., Wilkes, R., van den Bergh, E., Ar Gall, E. & Melo, R. (2014). Biological validation of physical coastal waters classification along the NE Atlantic region based on rocky macroalgae distribution. Estuarine, Coastal and Shelf Science, 147: 103–112.
- Ramos, E., Díaz de Terán, J.R., Puente, A. & Juanes, J. (2015). The role of geomorphology in the distribution of intertidal rocky macroalgae in the NE Atlantic region. Estuarine, Coastal and Shelf Science, 179: 90–98.
- Ramos, E., Puente, A. & Juanes, J. (2016). An ecological classification of rocky shores at a regional scale: a predictive tool for management of conservation values. Marine Ecology, 37: 311–328.
- Reis, J. (2014). Introduction to systems approaches in coastal management – the legacy of the SPICOSA project. Marine Policy, 43: 1–2.
- Rice, J., Gjerde, K.M., Ardron, J., Arico, S., Cresswell, I., Escobar, E., Grant, S. & Vierros, M. (2011). Policy relevance of biogeographic classification for conservation and management of marine biodiversity beyond national jurisdiction, and the GOODS biogeographic classification. Ocean & Coastal Management, 54: 110–122.
- Roff, J.C., Taylor, M.E. & Laughren, J. (2003). Geophysical approaches to the classification, delineation and monitoring of marine habitats and their communities. Aquatic Conservation: Marine and Freshwater Ecosystems, 13: 77–90.
- Sale, P.F., Agardy, T., Ainsworth, C.H., Feist, B.E., Bell, J.D., Christie, P., Hoegh-Guldberg, O., Mumby, P.J., Feary, D.A., Saunders, M.I., Daw, T.M., Foale, S.J., Levin, P.S., Lindeman, K.C., Lorenzen, K., Pomeroy, R.S., Allison, E.H., Bradbury, R.H., Corrin, J., Edwards, A.J., Obura, D.O., Sadovy de Mitcheson, Y.J., Samoilys, M.A. & Sheppard, C.R.C. (2014). Transforming management of tropical coastal seas to cope with challenges of the 21st century. Marine Pollution Bulletin, 85: 8–23.
- Sales, M. & Ballesteros, E. (2009). Shallow Cystoseira (Fucales: Ochrophyta) assemblages thriving in sheltered areas from Menorca (NW Mediterranean): relationships with environmental factors and anthropogenic pressures. Estuarine, Coastal and Shelf Science, 84: 476–482.
- Sauvageau, C. (1897). Note préliminaire sur les algues marines du golfe de Gascogne. Journal de Botanique, 11: 1–64.
- Shumchenia, E.J. & King, J.W. (2010). Comparison of methods for integrating biological and physical data for marine habitat mapping and classification. Continental Shelf Research, 30: 1717–1729.
- Stewart, J.G. (1989). Establishment, persistence and dominance of Corallina (Rhodophyta) in algal turf. Journal of Phycology, 25: 436–446.
- Stojanovic, T., Green, D.R. & Lymbery, G. (2010). Approaches to knowledge sharing and capacity building: the role of local information systems in marine and coastal management. Ocean and Coastal Management, 53: 805–815.
- Straile, D. & Stenseth, N.C. (2007). The North Atlantic Oscillation and ecology: links between historical time-series, and lessons regarding future climate warming. Climate Research, 34: 259–262.
- Tomas, A., Medina, R., Méndez, F.J., Jaime, F.F., Castellanos, O.F., Higuera, P., Fernandez, F., Minguez, R., Diaz-Hernandez, G., Lara, J.L. & Ortiz, M.D. (2013). Metodología para la elaboración de los mapas de peligrosidad y riesgo de inundación costera en España (iOLE). In XII Jornadas Españolas de Ingeniería de Costas y Puertos, Cartagena, España.
- van den Hoek, C. (1982). The distribution of benthic marine algae in relation to the temperature regulation of their life histories. Biological Journal of the Linnean Society, 18: 81–144.
- Venier, C., Figueiredo da Silva, J., McLelland, S.J., Duck, R.W. & Lanzoni, S. (2012). Experimental investigation of the impact of macroalgal mats on flow dynamics and sediment stability in shallow tidal areas. Estuarine, Coastal and Shelf Science, 112: 52–60.
- Vesanto, J. (1999). SOM-based data visualization methods. Intelligent Data Analysis, 3: 111–126.
- Vesanto, J., Himberg, J., Alhoniemi, E. & Parhankangas, J. (2000). SOM Toolbox for Matlab 5, Technical Report A57. University of Technology, Neural Networks Research Centre, Helsinki.
- Voerman, S.E., Llera, E. & Rico, J.M. (2013). Climate driven changes in subtidal kelp forest communities in NW Spain. Marine Environmental Research, 90: 119–127.
- Wallenstein, F.F.M.M. & Neto, A.I. (2006). Intertidal rocky shore biotopes of the Azores: a quantitative approach. Helgoland Marine Research, 60: 196–206.