
ABSTRACT
In macroalgal restoration on urchin barren coasts, understanding the variability in microscopic stages of canopy-forming macroalgae such as kelps and fucoids is critical to reduce restoration effort (i.e. sea urchin removal). In the present study, we used epilithic macroalgae present on the limpet Niveotectura pallida to determine the macroalgal seed bank along a depth gradient of habitats (surf, turf, barren and sandy zones). We collected a total of 46 limpets in two seasons (summer: August and winter: December) and from four zones at Sashiga-hama on the north-east coast of northern Honshu, Japan. The attached organisms on the limpet shells were brushed off and identified using a plastid-encoded rbcL gene and high throughput sequencing (HTS) based DNA metabarcoding. The original data set consisted of 432 macroalgal and 224 microalgal operational taxonomic units (OTUs). For macroalgae, 37, 190 and 205 OTUs were assigned to Ulvophyceae, Phaeophyceae and Rhodophyta, respectively. For canopy-forming macroalgal OTUs, Agaraceae, Alariaceae, Lessoniaceae, Laminariaceae and Sargassaceae were detected. In summer, the OTU was significantly richest in the sandy zone (77.0 ± 15.2 OTUs), but the difference among zones was less conspicuous in winter, ranging from 52.8 ± 16.4 to 64.3 ± 13.2 OTUs. The Shannon–Wiener diversity index showed similar patterns. The laminarialean and sargassacean OTUs were significantly the richest in the sandy zone during summer (p < 0.001). In light of these results, macroalgal restoration (i.e. through sea urchin removal) should be initiated in summer and the sandy zone should be preferentially targeted.
Introduction
Macroalgal beds, especially those composed of kelps and fucoids, are important in coastal ecosystems, providing food, habitat and shelter for numerous marine organisms (North, Citation1971; Graham, Citation2004; Steneck & Johnson, Citation2014). However, reports on deforestation of these macroalgal beds have been increasing worldwide over the last two or three decades (Steneck et al., Citation2002; Filbee-Dexter & Scheibling, Citation2014). On barren grounds, although macroalgal spores are constantly supplied as a ‘rain of spores’ from adjacent macroalgal beds (reviewed by Hoffmann, Citation1987; Santelices, Citation1990), continuous grazing by herbivores usually inhibits their growth. In such coasts, settled macroalgal spores generally survive as microscopic forms or stages (e.g. spores, microscopic filaments or crustose stages, and germlings of macroscopic stages or propagules) in refugia (see fig. 19 in Fujita, Citation2003) and form a ‘bank of microscopic forms’ (Chapman, Citation1986; Santelices, Citation1990; Hoffmann & Santelices, Citation1991) (hereafter referred to as the macroalgal seed bank (MSB)). When the grazing pressure from herbivores decreases, macroalgal beds can recover in several months. Thus, the components of the MSB determine the species composition and diversity of the recovered macroalgal stands.
Reduction of macroalgal beds has been reported in many coastal areas in Japan (Fujita, Citation2010). On the northern coast of Japan, the dominance of sea urchins causes reduction of macroalgae, whilst herbivorous fish such as rabbitfish and parrotfish also affect macroalgal stands on the southern coast (Fujita, Citation2010). On the urchin-dominated barrens, repeated removal of sea urchins is recommended for macroalgal recovery (Watanuki et al., Citation2010; Japanese Fisheries Agency, Citation2015). Currently, local fishermen in Japan spend time removing sea urchins to recover their fishery grounds (i.e. macroalgal forest) from urchin barren coasts. Prior to sea urchin removal, understanding the timing and locations that are rich in kelp and fucoid propagules (i.e. kelp gametophytes or propagules of Sargassum) could aid effective restoration.
In previous studies, MSBs were detected by incubation of the substratum (Burrows, Citation1958; Fujita, Citation2004; Robuchon et al., Citation2014; Peters et al., Citation2015). However, we recently developed a more rapid method, based on DNA metabarcoding using a high throughput sequencing (HTS) platform (Akita et al., Citation2019). In a previous study using cobbles (Akita et al., Citation2019), we encountered two main problems: (1) the cobbles were too heavy to collect from the sea bottom and transport to the laboratory, and (2) it was difficult to find cobbles of similar shape and size. However, the surface of shells has also been demonstrated to be a refugium from grazing for macroalgal spores (Fujita Citation2003). Thus, to mitigate the issues we had previously with cobbles, we chose the surface of shells as a more reliable and tractable substratum on which to investigate MSBs in an urchin barren.
The limpet Niveotectura pallida (Gastropoda, Acmaidae) is a specialist grazer of crustose coralline algae (Fujita, Citation1992, as Acmaea pallida) that is found in the urchin barrens in the northern coasts of Japan. The shell diameter of this limpet is up to 3 cm. The limpet attaches firmly to the coralline-covered rocky substratum and is rarely detached or overturned, unlike the common snail. Accordingly, the limpet shells provide several advantages over cobbles as a substratum for macroalgae: (1) abundant in coralline-barren bottoms, (2) substratum uniformity in size and quality and (3) a stable surface. Thus, in the present study, we investigated epilithic MSBs on N. pallida to characterize the variation in microscopic forms of canopy-forming macroalgae on an urchin barren coast, using an HTS-based DNA metabarcoding approach (Akita et al., Citation2019).
Materials and methods
Study site and sampling of Niveotectura pallida
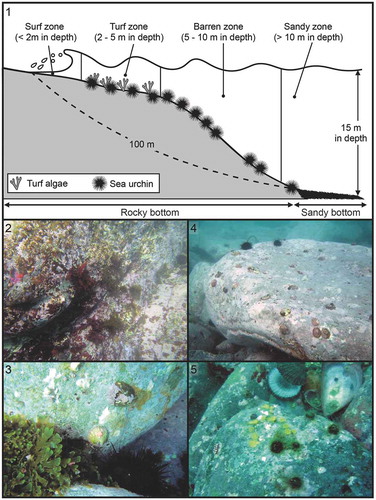
Epilithic MSBs were collected from N. pallida specimens in an urchin barren coast at Sashiga-hama, Miyagi Prefecture, Japan (38°46′N, 141°48ʹE). On this coast, the sea urchins Mesocentrotus nudus and Hemicentrotus pulcherrimus are dominant. The substrata are composed of bedrock or boulders until a depth of ~12 m, after which the hard substratum is replaced by a sandy bottom. We divided the study site into four zones based on representative seascapes (): surf zone, turf algae dominant zone, urchin-dominated barren zone and sandy zone (–, respectively). In the surf zone (), macroalgae including Undaria, Sargassum and Chondrus grows from winter to spring but disappeared in warmer seasons. In the turf zone (), a feeding-deterrent brown turf alga Rugulopteryx okamurae (E.Y.Dawson) I.K.Hwang, W.J.Lee & H.S.Kim was dominant almost throughout the year. Barren zone () is an urchin barren dominated by M. nudus. Sandy zone () is poorly vegetated because of sand cover on cobbles but a coral Rhizopsammia minuta mutsuensis occurs. Rocky substrata are extensively covered with crustose coralline algae in all zones. Five or six limpets were collected from each of the four zones in two seasons (summer: 20 August 2016, and winter: 7 December 2017) (n = 46, Supplementary table S1). Each limpet was collected by SCUBA diving and kept separate using a ziplock plastic bag. The limpets were transported to the laboratory in a coolbox maintained at 4°C, then stored at −20°C until DNA extraction.
Figs 1–5. Schematic illustration of Fig. 1. sampling zones, and representative seascape for Fig. 2. surf, Fig. 3. turf, Fig. 4. barren and Fig. 5. sandy zones
DNA extraction
DNA extraction was conducted separately for each of the 46 limpets. Epiphytes on the shell surface were scraped onto a clean Petri dish using a toothbrush (one brush for each limpet) with sterilized and filtered natural seawater. The muddy suspensions were placed in 2 ml tubes and centrifuged at 20 000 × g for 5 min at room temperature. The precipitate was used for DNA extraction after removing the supernatant. DNA was extracted using an I-soil kit (NIPPON GENE, Tokyo, Japan) according to the manufacturer’s protocol and purified using a GENECLEAN kit II (MP Bioscience, California, USA).
Construction of DNA library and amplicon sequencing
The plastid-encoded rbcL gene was selected for metabarcoding because of the richness of data for this marker in GenBank (NCBI). For primer development, a total of 7000 sequences (1000 operational taxonomical units (OTUs) of Ulvophyceae, 2000 OTUs of Phaeophyceae and 4000 OTUs of Rhodophyta) were downloaded and aligned automatically using MEGA 6 (Tamura et al., Citation2013) and manually adjusted. Then, based on a universal primer of rbcL for chromophyte microalgae (Nishitani et al., Citation2012), the forward primer (rbcL-F118: ACWTGGACWGTWGTWTGGAC) was further degenerated (rbcL_F118_tak: ACNTGGACNGTWGTDTGGAC) to maximize amplification of macroalgal taxa. Two reverse primers (rbcL-R547_tak: GARTTDATRTTYTCRTCRTCYTT, rbcL_R565_tak: CKCATRAANGGYTGNGARTT) were newly designed in the relatively conserved region (located from position 613 to 650 of Saccharina japonica rbcL sequence NC018523) among Ulvophyceae, Phaeophyceae and Rhodophyta. After optimization by polymerase chain reaction (PCR) amplification and Sanger sequencing using 99 species (10 Ulvophyceae, 34 Phaeophyceae and 55 Rhodophyta) collected from the study site, the primer set (forward: rbcL_F118_tak, reverse: rbcL_R565_tak) was selected as the best primer combination, producing rbcL metabarcodes of 446 bp.
Massively parallel paired-end sequencing on the MiSeq platform requires PCR amplicons to be flanked by: (i) primer-binding sites for sequencing; (ii) dual-index (i.e. barcode) sequences; and (iii) adapter sequences for binding to the flow cells of the MiSeq. The workflow was derived from the document 16S metagenomic sequencing library preparation: preparing 16S ribosomal gene amplicons for the Illumina MiSeq system distributed by Illumina (part no. 15044223 Rev. B). When primer sequence contains high degeneracy, it is highly possible to amplify non-specific DNA fragments to construct the pair-end libraries. Normally a two-step PCR approach is employed, but we employed a three-step PCR approach in this study to minimize non-specific amplification. In the first round of PCR, PCR was performed using the primer pairs without any adaptor sequences. The 2nd round of PCR was performed using the same primers but with the adaptor sequences. The third round of PCR was performed using primer pairs with 8 bp index. The eight base segments represent dual-index sequences to recognize each sample; the 5’-end sequences are adapters that allow the final product to bind or hybridize to short oligos on the surface of the Illumina flow cell; and the 3’-end sequences are priming sites for the MiSeq sequencing. The first and second PCR amplifications were performed using a thermal cycler (PC-808, ASTEC, Fukuoka, Japan) in a 50 µl reaction mixture with the following composition: 0.5 μl template DNA (10 ng µl−1), 0.4 mM of each dNTP, 1× PCR buffer for KOD FX Neo, 1.0 U KOD FX Neo (TOYOBO, Osaka, Japan), and 0.2 µM of forward and reverse primers. As for the third PCR, 0.2 µM of primer set of the above PCR reaction mix was replaced by 0.6 µM 6-pb multiplex identifier (MID)-tagged forward and reverse primers. Each of PCR was performed as follows: 1st PCR – initial denaturation at 94°C for 2 min, followed by 35 cycles at 94°C for 30 s, 45°C for 30 s, and 72°C for 30 s, the gel excised products corresponding to rbcL were purified using the High Pure PCR Product Purification kit (Roche, Basel, Switzerland); 2nd PCR – initial denaturation at 94°C for 2 min, followed by 15 cycles at 94°C for 30 s, 56°C for 30 s, and 72°C for 30 s, then the GENECLEAN kit II was used for gel and beads purification; and 3rd PCR – initial denaturation at 94°C for 2 min, followed by 10 cycles at 94°C for 30 s, 59°C for 30 s, and 72°C for 30 s, then the products were purified by gel and column using the High Pure PCR Product Purification kit.
Finally, the purified indexed PCR products were sequenced using the Illumina Miseq 300PE platform (Illumina, California, USA). A PhiX DNA spike-in control (Illumina, USA) was mixed with the pooled DNA library to increase sequence diversity and quality of the sequencing run. DNA concentrations in the pooled library and the PhiX DNA were adjusted to 4 nM using buffer EB (10 mM Tris-HCl, pH 8.5) and mixed at a ratio of 7:3. The 4-nM library DNA (5 µl) was denatured using 5 μl fresh 0.1 N sodium hydroxide (NaOH). The denatured library DNA (10 μl, 2 nM), containing HT1 buffer (from the Illumina MiSeq v.3 reagent kit for 2× 300 bp PE), was diluted to a final concentration of 12 pM for sequencing using the MiSeq platform.
Bioinformatics
Raw sequence data were processed following the method described in Sildever et al. (Citation2019). Nucleotide sequences were demultiplexed depending on the 5’- multiplex identifier (MID) tag and primer sequences using the default format in MiSeq. The sequences containing palindrome clips longer than 30 bp and homopolymers longer than 9 bp were trimmed from the sequences at both ends. The 30 tails with an average quality score of less than 30 at the end of the last 25-bp window were also trimmed from each sequence. The 50 and 30 tails with an average quality score of less than 20 at the end of the last window were also trimmed from each sequence. Sequences longer than 300 bp were truncated to 300 bp by trimming the 30 tails. The trimmed sequences shorter than 250 bp were filtered out. The demultiplexing and trimming were performed using Trimmomatic version 0.35 (http://www.usadellab.org/cms/?page=trimmomatic). The remaining sequences were merged into paired reads using Usearch version 8.0.1517 (http://www.drive5.com/usearch/). In addition, singletons were removed. Subsequently, sequences were aligned using Clustal Omega v 1.2.0. (http://www.clustal.org/omega/). Multiple sequences were aligned and only sequences that were contained in more than 75% of the read positions were extracted. Filtering and a part of the multiple alignment process were performed using the screen.seqs and filter. seqs commands in Mothur, as described in the Miseq SOP (http://www.mothur.org./wiki/MiSeq_SOP) (Schloss et al., Citation2011). Erroneous and chimeric sequences were detected and removed using the pre.cluster (diffs = 4) and chimera.uchime (minh = 0.1; http://drive5.com/usearch/manual/uchime_algo.html) (Edgar et al., Citation2011) commands in Mothur, respectively. Demultiplexed and filtered, but untrimmed, sequence data were deposited in the DNA data bank of Japan (DDBJ) Sequence Read Archive under accession no. DRA008335.
The picked OTUs were taxonomically identified based on top hit species of BLASTn search without any similarity or e-value threshold (Supplementary table S2). The classification and names of taxa were assigned based on AlgaeBase (Guiry & Guiry, Citation2017).
Comparison of detected OTUs among four sampling zones
The read number of each detected OTU was rarefied based on the minimum read counts (15422, urchin barren No. 2 in winter) using R 3.2.2. (R Core Team, Citation2015) and the ‘rrarefy’ function of the package ‘vegan’ v. 2.5-2 (Oksanen et al., Citation2015) to reduce amplification and sequencing bias that may be present in deeper sequenced samples. Subsequently, we screened out microalgal OTUs to restrict our analysis to macroalgal OTUs, and only macroalgal OTUs (Ulvophyceae, Phaeophyceae and Rhodophyta) were used in further analysis. In addition, microalgae distributed in Ulvophyceae and obvious misidentification of DNA barcoding, such as OTUs closely matching the freshwater macroalgae, Sheathia grandis (sequence ID: M04999_10_000000000-B2NBK_1_2112_18160_20119) and members of Cladophorales, were removed.
For each zone, the number (i.e. richness) and the read counts (i.e. abundance) of detected OTUs were counted for Ulvophyceae, Phaeophyceae and Rhodophyta, as well as for canopy-forming macroalgal OTUs belonging to Laminariales and Fucales (two important economic groups). The Shannon–Wiener diversity (Hʹ) was calculated based on the read counts for each OTU. Analysis of variance (ANOVA) was performed to reveal any significant differences in the richness and diversity index H’ of the OTUs for all detected macroalgae (Ulvophyceae, Phaeophyceae and Rhodophyta) and in the canopy-forming macroalgae. Season (summer and winter) and zone (surf, turf, urchin barren and sand) were used as factors. The post-hoc pairwise difference was further examined with Tukey–Kramer test using R version 3.2.2. For the abundance, the dissimilarity in OTU abundance of three macroalgal groups (Ulvophyceae, Phaeophyceae and Rhodophyta) was verified by two-way permutational analysis of variance (PERMANOVA) (9999 permutations, seasons and zones as fixed factors) based on a Bray–Curtis resemblance matrix with square root transformation conducted using ‘vegan’ in R 3.2.2. The pairwise significance was further examined using the ‘pairwiseAdonis’ package (Martinez, Citation2019).
Pooled read counts per family were used for the floristic comparison, to account for inaccuracies in identification at genus or species level derived from short fragments of rbcL gene used in this study. Aheatmap was drawn to visualize dominant families using the ‘genefilter’ (Gentleman et al., Citation2018) and ‘gplots’ (Warnes et al., Citation2009) packages in R version 3.2.2., based on the families with square root transformed read counts of >10. To detect floristic differences in the MSB among seasons and zones, we performed non-metric multidimensional scaling (nMDS) based on a Bray–Curtis resemblance matrix with square root transformation using the ‘MASS’ package (Venables & Ripley, Citation2002) in R version 3.2.2. In addition, a two-way PERMANOVA (9999 permutation, seasons and zones as a fixed factors) based on the Bray–Curtis resemblance matrix with square root transformation was conducted using ‘vegan’, and the pairwise significance was further examined using ‘pairwiseAdonis’ (Martinez, Citation2019).
Results
Number of obtained reads and picked-OTUs
We obtained 15422–71852 (macroalgae: 14740–70880 reads, microalgae: 7–14634 reads) read counts from each limpet (Supplementary table S1). In average, microalgal OTUs were 7.6 ± 14.0% of original read counts, among which the richest number of OTUs and the most abundant read counts were diatoms (165 OTUs) and Pinguiophyceae (in total 47 888 reads). In the original data (i.e. prior to rarefaction), 432 OTUs were assigned to macroalgae (microalgae: 224 OTUs), and 106–168 macroalgal OTUs (microalgae: 39–105 OTUs) were detected in each zone. In the rarefied data, 374 macroalgal OTUs (microalgae: 203 OTUs) were obtained, 94–157 macroalgal OTUs (microalgae: 32–93 OTUs) were identified in each zone (Supplementary table S1). The OTUs detected in the rarefied dataset were assigned to five families in Ulvophyceae, 16 families in Phaeophyceae and 39 families in Rhodophyta ().
Table 1. List of macroalgal families detected on shell surface of Niveotectura pallida in Sashiga-hama, Onagawa Bay, Miyagi Prefecture, Japan
Macroalgal OTU richness was highest in the sandy zone (77.0 ± 15.2 OTUs) during summer (p = 0.011, , ). In summer, the OTU richness in Phaeophyceae and Rhodophyta increased in the sandy zone, though the richness in Phaeophyceae was similar in the surf zone and sandy zone. In winter, the richness was not significantly different between zones, ranging from 52.8 ± 16.4 to 64.3 ± 13.2 (, p > 0.10, Supplementary table S3a). The OTUs abundance of Ulvophyceae, Phaeophyceae and Rhodophyta was significantly different between seasons (p < 0.001, ) and between zones (p < 0.001, ). In summer, the abundance of Phaeophyceae and Rhodophyta showed opposite trends: Phaeophyceae decreased with depth, but Rhodophyta increased. In winter, Rhodophyta were abundant in all zones (). In further pairwise PERMANOVAs, a significant difference was detected only between the surf zone and sandy zone in summer (p < 0.05, Supplementary table S4a).
Table 2. Result of ANOVA comparing OTUs richness in all detected macroalgae and in canopy-forming macroalgae, and diversity index (H’)
Table 3. Result of PERMANOVA using Bray–Curtis resemblance matrix of read counts for OTU abundance of three macroalgal groups (Ulvophyceae, Phaeophyceae and Rhodophyceae) and each of the macroalgal families detected on limpets in four zones and two seasons of an urchin barren coast
Fig. 6. (a) Richness and (b) abundance of operational taxonomical units (OTUs) associated with three macroalgal groups (Ulvophyceae, Phaeophyceae and Rhodophyta) detected on limpet shells inhabiting surf, turf, barren and sandy zones in summer and winter
Six laminarialean OTUs (one in Agaraceae, one in Alariaceae, three in Laminaraceae and one Lessoniaceae) and eight sargassacean OTUs were obtained in the rarefied data (, Supplementary table S4). The dominant laminarialean (Sequence ID: M04999_10_000000000-B2NBK_1_1109_29347_16064) OTU was 100% match for Saccharina japonica var. religiosa. In the Fucales, the OTU (Sequence ID: M04999_10_000000000-B2NBK_1_2118_28432_10539) was 99.7% similar to four Sargassum species (Sargassum sp. 2 SMC-2012, S. serratifolium, S. macrocarpum and S. autumnale) (Supplementary table S2). Laminarialean OTUs were detected in all seasons and zones, whereas the sargassacean OTUs were found only in the surf, turf and sandy zones in summer (). Richness in canopy-forming macroalgal OTUs was significantly the highest in the sandy zone in summer (p < 0.001, , , Supplementary table S3b). OTUs in Laminariaceae were dominant in all zones and seasons, except the turf zone during summer, where Sargassaceae dominated (). Shannon–Wiener diversity (Hʹ) of macroalgal OTUs was the highest in the sandy zone during summer, although no significant difference was detected (ANOVA; P > 0.05, , ).
Fig. 7. (a) Richness and (b) abundance of operational taxonomical units (OTUs) associated with canopy-forming macroalgae (Laminariales and Fucales) detected on limpet shells inhabiting surf, turf, barren and sandy zones in summer and winter
Fig. 8. Variations of the Shannon–Wiener index (Hʹ) among limpets inhabiting surf, turf, barren, and sandy zones in summer and winter
Notably, the OTU (sequence ID: M04999_10_000000000-B2NBK_1_2108_14546_13853), which is the only OTU assigned to Lessoniaceae in this study, matched the austral Ecklonian kelp Ecklonia radiata with 99% similarity (Supplementary table S2). However, the OTU was interpreted as Eisenia bicyclis, because E. bicyclis is the only Eisenia or Ecklonia species in the study area.
Floristic variability on limpet shells
The dominant macroalgal families, based on the obtained read counts, across zones and seasons are shown on the heatmap (). In summer, the dominant families changed from brown to red macroalgae with increasing depth. In this season, ~91.0% and 57.3% of read counts belonged to the brown algal family Scytosiphonaceae in the surf and turf zones. In the barren zone, 36.7% and 35.4% of the reads were associated with Chordariaceae in Phaeophyceae and Peyssonneliaceae in Rhodophyta, respectively. Two families in Rhodophyta, Ceramiaceae and Rhodomelaceae, were dominant in the sandy zone with 36.1% and 29.5%, respectively. In contrast, in winter, Peyssonneliaceae was dominant in all zones (28.0–62.8%), followed by either Chordariaceae or Scytosiphonaceae, except in the sandy zone. PERMANOVA analyses (, Supplementary table S4b) also detected differences between seasons in read counts per family that were reflected in the nMDS, with most summer samples falling in the lower part of the plots and all winter samples in the higher part ().
Fig. 9. Heatmap using square roots of read numbers of macroalgal families detected from limpets inhabiting surf, turf, barren, and sandy zones in summer and winter
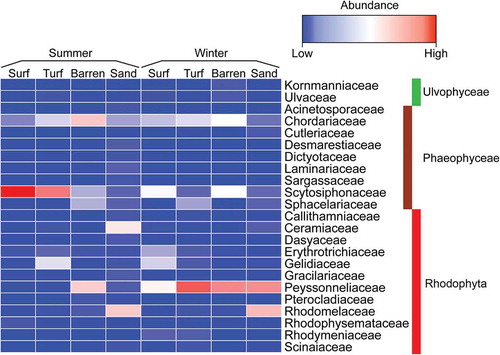
Fig. 10. Non-metric multidimensional scaling (nMDS) plot of all samples using Bray–Curtis resemblance matrix of rarefied read counts in each family based on collected limpets
Discussion
HTS-based MSB detection using an alternative substratum
In the present study, we obtained 432 macroalgal OTUs (including 37 Ulvophyceae, 190 Phaeophyceae and 205 Rhodophyta) from 46 limpet shells using HTS based meta-DNA barcoding. The detection of a MSB has been demonstrated in a variety of substrata after their incubation for a few weeks and subsequent species identification (Burrows, Citation1958; Fujita, Citation2004; Robuchon et al., Citation2014; Peters et al., Citation2015). HTS-based meta-DNA barcoding, which was proposed in a recent study (Akita et al., Citation2019), enables shortening of the study period and detection of the macroalgal diversity on the substratum in situ by omitting the culturing step. Moreover, in the present study, we improved the primer set to match to three macroalgal groups (Ulvophyceae, Phaeophyceae and Rhodophyta) and employed the limpet shell as an alternative substratum for easier sampling. Although comparison of diversity of MSBs between two studies is not straightforward due to different study sites, sequence platforms and substrata, the diversity was much higher in the present study (32–93 OTUs/limpet (up to 3 cm in shell diameter)) than our previous study (Akita et al., Citation2019: 14–35 OTUs/cobble (~15 cm in length)). This may be due to difference of study sites (in the present study: cold temperate NE Honshu; Akita et al., Citation2019: warm temperate Kyushu) and sequence platform between the two studies, but also suggests that limpet shells are more functional ‘refugia’ than cobbles, where MSB can be protected from grazing. Regretfully, we could not collect comparable stable cobbles on the present study site because all of the hard substrata were large boulders, as shown in –.
DNA metabarcoding studies of algae are a recent development (Marcelino & Verbruggen, Citation2016; Sauvage et al., Citation2016; Sherwood et al., Citation2017; Akita et al., Citation2019; Fredericq et al., Citation2019). These studies used markers from the algal plastid genome (16S rRNA: Fredericq et al., Citation2019; 23 s rDNA: Sherwood et al., Citation2017; tufA: Sauvage et al., Citation2016; rbcL: Fredericq et al., Citation2014; Akita et al., Citation2019; 16S rDNA, 18S rDNA, 23S rDNA and tufA: Marcelino & Verbruggen, Citation2016). When algae are targeted, using plastid markers is reasonable to exclude non-phototrophic taxa from the PCR success. Amongst the plastid markers, rbcL is the richest in macroalgal sequences on GenBank, especially for Phaeophyceae and Rhodophyta, which should contribute to a high resolution of OTU identification. For example, the number of macroalgal rbcL sequences is five times that of the tufA marker used by Sherwood et al. (Citation2017). For this reason, we selected the rbcL as the barcoding marker. However, a disadvantage of using the rbcL marker is that PCR amplification fails in some Chlorophyta (e.g. Thompson et al. Citation1995; Nozaki et al. Citation1998). In the Ulvophyceae, amplification of rbcL fails in the genus Caulerpa and the order Bryopsidales because of the presence of introns, and in the order Cladophorales due to a fragmented chloroplast genome (Hanyuda et al., Citation2000; Del Cortona et al., Citation2017). Such amplification problems have not been detected for Phaeophyceae and Rhodophyta. Comparing the results of our study with a similar one (i.e. single marker and online database derived reference) that used tufA (Sauvage et al., Citation2016), rbcL provided more accurate OTU identification. Most of the OTUs were identified to genus level in the present study (Supplementary table S2), but only to family level in Sauvage et al. (Citation2016), probably due to the richness of the database for rbcL. However, 46.4% of OTUs were associated with more than two species in the present study and accordingly our floristic analyses were carried out at family level identification. A potential solution to improve taxonomic resolution in metabarcoding studies is to use a multi-DNA barcoding approach combining several markers (Marcelino & Verbruggen, Citation2016). Considering currently employed major DNA markers for macroalgae (Leliaert et al., Citation2014) and running cost of HTS, a combination of two markers is better. The potential for this combined marker approach to improve identification accuracy should be tested. Taking into account database richness and the recommended DNA marker for each taxon (Saunders & Kucera, Citation2010; Leliaert et al., Citation2014), the most useful candidates would be plastid rbcL and tufA for Ulvophyceae, and rbcL and mitochondrial COI for Phaeophyceae and Rhodophyta.
In DNA library construction, two-step PCR is generally employed for metabarcoding (e.g. Nagai et al., Citation2017; Sildever et al., Citation2019). However, we used a three-step PCR: the first and second PCRs were for amplification, and the third was for indexing. This is because our primer set (Forward: rbcL_F118_tak, Reverse: rbcL_R565_tak), especially the reverse primer, included a high level of degeneracy in order to match the sequences of Ulvophyceae, Phaeophyceae and Rhodophyta, although these regions are highly conserved among Ulvophyceae, Phaeophyceae and Rhodophyta in our rbcL sequence alignments of 7000 OTUs. Indeed, the annealing positions of the forward and reverse primers were partially overlapped with the universal primers of Ulvophyceae (U1–1: Hanyuda et al., Citation2000; rbcL 2: Pierce et al., Citation2006). Unexpectedly, non-specific PCR products were obtained in some samples after the indexing PCR, although we combined three-step PCR and gel purification to avoid contamination from non-target regions in sequencing. This may have been caused by mis-annealing of the primers with high degeneracy.
Comparison of MSBs detected on the limpet shells
Macroalgal OTUs were significantly richer in the sandy zone in summer, especially Phaeophyceae and Rhodophyta, although no significant difference was found among Hʹ values (p > 0.05). According to an investigation of macroalgal flora in an adjacent bay to our study site (Oppa Bay, 10 km north of our study site; Nakata et al., Citation2001), mature thalli of small annual macroalgal species were observed mostly from spring to early summer, whereas from summer to winter, the thalli of perennial species were mature. In addition, winter to spring blooming annual species were dominant at our study site (Sashiga-hama; Fujita & Kondo, personal observation), probably due to urchin barrens. Spores and algal fragments generally sink (Amsler & Searles, Citation1980; Okuda & Neushul, Citation1981; Hoffman & Camus, Citation1989), which may explain the increase of Phaeophyceae and Rhodophyta in the deeper (sandy) zone during summer. Amongst Ulvophyceae, Ulvaceae was dominant, and their opportunistic life cycle, lacking a phenological pattern (Lee, Citation2008), could support their equivalent distribution between zones in summer. The homogeneity of macroalgal OTUs in winter could be explained by a lack of spore supplementation from mature thalli. Macroalgal flora is poor from the beginning of summer to winter in this study site (Fujita & Kondo, personal observation). This poor vegetation is reflected by MSBs in winter when a crustose red alga in the family Peyssonneliaceae was dominant in all zones during winter. The abundance of ‘spore rain’ is likely to determine the richness and abundance of epilithic MSBs.
Of the two seasons, richness in canopy-forming (i.e. kelp and fucoid) macroalgal OTUs was higher during summer, especially in the sandy zone (p < 0.001), and the diversity index was also highest in this deepest zone. Therefore, it would be advisable to begin recovery of macroalgal beds in the deepest zone during summer. However, various factors other than sea urchin grazing, namely light intensity, water motion, sediment and sand scour (Dayton, Citation1985; Watanabe et al., Citation2016) influence the survival and growth of macroalgal germlings in the hard–soft bottom boundary. Therefore, these factors should also be considered when selecting a site for the removal of sea urchins. The homogeneity of richness and abundance in canopy-forming species before and after sea urchin removal is needed to drive further discussions.
In winter, sargassacean OTUs were absent. The fucoid life cycle does not have a gametophyte stage, and the settled germlings grow to young sporophytes within a few months. The attachment of large macroalgae on the shell would negatively affect the survival of the limpet and this may explain the absence of fucoids during winter.
In conclusion, we could detect variability in macroalgal OTUs, focusing on canopy-forming species, using the shell surface of Niveotectura pallida and a metabarcoding technique. Given the richness and abundance of canopy forming macroalgae, macroalgal restoration (e.g. urchin removal) at this study site should be carried out in the sandy zone during summer. In future studies, comparison between MSBs on the surfaces of cobbles and limpet shells should be made to prove viability of this limpet as an alternative substratum for MSB detection. Also, further studies should be linked to the practice of removing sea urchins on the study site to test whether canopy is restored in the sandy zone as predicted above.
Supplementary information
The following supplementary material is accessible via the Supplementary Content tab on the article’s online page at https://doi.org/10.1080/09670262.2020.1750056
Supplementary table S1. Numbers of obtained MPS and OTUs for macro- and micro-algae in each sampling site.
Supplementary table S2. Sequence ID, identification and read counts of obtained OTUs.
Supplementary table S3. Pairwise P-value of Tukey–Kramer test on richness in (a) Macroalgal OTUs and (b) canopy-forming OTUs.
Supplementary table S4. Pairwise P-value and F value of PERMANOVA using Bray-Curtis resemblance matrix of OTU abundance (i.e. read counts) for a) Ulvophyceae, Phaeophyceae and Rhodophyta, and b) each of macroalgal families detected on limpets in four zones and two seasons of urchin barren coast.
Author contributions
S. Akita: analysis of molecular data, drafting and editing manuscript; H. Murasawa, M. Kondo and Y. Takano: field survey, sampling and DNA data collection; Y. Kawakami: bioinformatic analysis; S. Nagai and D. Fujita: original concept and manuscript editing.
Supplemental Material
Download MS Word (16.1 KB)Supplemental Material
Download MS Word (16.1 KB)Supplemental Material
Download MS Excel (303.4 KB)TEJP-2019-0058-File008.docx
Download MS Word (22.4 KB)Acknowledgements
We are grateful to the local fishermen for their assistance during the survey. This work was supported by a research project grant from the Fisheries Research Agency of Japan (FRA) to SN and JSPS KAKENHI 15K07525 grant to DF. We would like to thank Editage for English language editing.
Disclosure statement
No potential conflict of interest was reported by the authors.
Supplemental Material
The following supplementary material is accessible via the Supplementary Content tab on the article’s online page at https://doi.org/10.1080/09670262.2020.1750056.
Related Research Data
References
- Akita, S., Takano, Y., Nagai, S., Kuwahara, H., Kajihara, R., Tanabe, A.S. & Fujita, D. (2019). Rapid detection of macroalgal seed bank on cobbles: application of DNA metabarcoding using next-generation sequencing. Journal of Applied Phycology, 31: 2743–2753.
- Amsler, C.D. & Searles, R.B. (1980). Vertical distribution of seaweed spores in a water column offshore of North Carolina. Journal of Phycology, 16: 617–619.
- Burrows, E.M. (1958). Subtidal algal population in Port Erin Bay, Isle of Man. Journal of Marine Biological Association of the United Kingdom, 37: 687–703.
- Chapman, A.R.O. (1986). Population and community ecology of seaweeds. Advance in Marine Biology, 23: 1–161.
- Dayton, P.K. (1985). Ecology of kelp communities. Annual Review of Ecology and Systematics, 16: 215–245.
- Del Cortona, A., Leliaert, F., Bogaert, K.A., Turmel, M., Boedeker, C., Janouškovec, J., Lopez-Bautista, J.M., Verbruggen, H., Vandepoele, K. & De Clerck, O. (2017). The plastid genome in Cladophorales green algae is encoded by hairpin chromosomes. Current Biology, 27: 3771–3782.
- Edgar, R.C., Haas, B.J., Clemente, J.C., Quince, C., & Knight, R. (2011). UCHIME improves sensitivity and speed of chimera detection. Bioinformatics, 27: 2194–2200.
- Filbee-Dexter, K. & Scheibling, R.E. (2014). Sea urchin barrens as alternative stable states of collapsed kelp ecosystems. Marine Ecological Progress Series, 495: 1–25.
- Fredericq, S., Arakaki, N., Camacho, O., Gabriel, D., Krayesky, D., Self-Krayesky, S., Rees, G., Richards, J., Sauvage, T., Venera-Ponton, D. & Schmidt, W.E. (2014). A dynamic approach to the study of rhodoliths: a case study for the Northwestern Gulf of Mexico. Cryptogamie Algologie, 35: 77–99.
- Fredericq, S., Krayesky-Self, S., Sauvage, T., Richards, J., Kittle, R., Arakaki, N., Hickerson, E. & Schmidt, W.E. (2019). The critical importance of rhodoliths in the life cycle completion of both macro- and microalgae, and as holobionts for the establishment and maintenance of marine biodiversity. Frontiers in Marine Science, 5: 502.
- Fujita, D. (1992). Grazing on the crustose coralline alga Lithophyllum yessoense by the sea urchin Strongylocentrotus nudus and the limpet Acmaea pallida. Benthos Research, 42: 49–54 (in Japanese with English abstract).
- Fujita, D. (2003). Algal recovery on coralline-covered cobbles collected from urchin-dominated barren ground in flowing deep-sea water II. Deep Ocean Water Research, 4: 1–9 (in Japanese with English abstract).
- Fujita, D. (2004). Nutrients and snail grazing affect recovery of algal vegetation on cobbles transplanted from a barren ground in southwestern Hokkaido to aquaria. Japanese Journal of Phycology (Sorui), 52: 23–32.
- Fujita, D. (2010). Current status and problems of isoyake in Japan. Bulletin of Fisheries Research Agency, 32: 33–42.
- Gentleman, R., Carey, V., Huber., W. & Hahne, F. (2018). Genefilter: Methods for Filtering Genes from High-throughput Experiments. R package version 1.64.0.
- Graham, M.H. (2004). Effects of local deforestation on the diversity and structure of southern California giant kelp forest food webs. Ecosystems, 7: 341–357.
- Guiry, M.D. & Guiry, G.M. (2017). AlgaeBase. World-wide electronic publication, National University of Ireland, Galway. http://www.algaebase.org (accessed20 March 2017).
- Hanyuda, T., Arai, S. & Ueda, K. (2000). Variability in the rbcL introns of Caulerpalean algae (Chlorophyta, Ulvophyceae). Journal of Plant Research, 113: 403–413.
- Hoffmann, A.J. (1987). The arrival of propagules at the shore: a review. Botanica Marina, 30: 151–165.
- Hoffmann, A.J. & Camus, P. (1989). Sinking rates and viability of spores from benthic algae in central Chile. Journal of Experimental Marine Biology and Ecology, 126: 281–291.
- Hoffmann, A.J. & Santelices, B. (1991). Banks of algal microscopic forms: hypotheses on their functioning and comparisons with seed banks. Marine Ecological Progress Series, 79: 185–194.
- Japanese Fisheries Agency (2015). Isoyake Taisaku Guideline. Japanese Fisheries Agency, Tokyo (in Japanese).
- Lee, R.E. (2008). Phycology. 4th ed. Cambridge University Press, New York.
- Leliaert, F., Verbruggen, H., Vanormelingen, P., Steen, F., López-Bautista, J.M., Zuccarello, G.C. & De Clerck, O. (2014). DNA-based species delimitation in algae. European Journal of Phycology, 49: 179–196.
- Marcelino, V.R. & Verbruggen, H. (2016). Multi-marker metabarcoding of coral skeletons reveals a rich microbiome and diverse evolutionary origins of endolithic algae. Scientific Reports, 6: 31508.
- Martinez, A.P. (2019). pairwiseAdonis: Pairwise Multilevel Comparison using Adonis. R package version 0.3. https://github.com/pmartinezarbizu/pairwiseAdonis.
- Nagai, S., Urusizaki, S., Hongo, Y., Chen, H. & Dzhembekova, N. (2017). An attempt to semi-quantify potentially toxic diatoms of the genus Pseudo-nitzschia in Tokyo Bay, Japan by using massively parallel sequencing technology. Plankton and Benthos Research, 12: 248–258.
- Nakata, Y., Agatsuma, Y. & Taniguchi, K. (2001). Marine algal flora off the coast of Jusan−Hama at Kitakami in Miyagi Prefecture Japan. Wildlife Conservation Japan, 6: 33–39 (in Japanese with English abstract).
- Nishitani, G., Nagai, S., Hayakawa, S., Kosaka, Y., Sakurada, K., Kamiyama, T. & Gojobori, T. (2012). Multiple plastids collected by the dinoflagellate Dinophysis mitra through kleptoplastidy. Applied and Environmental Microbiology, 78: 813–821.
- North, W.J. (1971). The biology of giant kelp beds (Macrocystis) in California: introduction and background. Nova Hedwigia, 32: 1–68.
- Nozaki, H., Ohta, N., Yamada, T. & Takano, H. (1998). Characterization of rbcL group IA introns from two colonial volvocalean species (Chlorophyceae). Plant Molecular Biology, 37: 77–85.
- Oksanen, J., Blanchet, F.G., Kindt, R., Legendre P., Minchin, P.R., O’Hara, R.B., Simpson, G.L., Solymos, P., Stevens, M.H.H. & Wagner, H. (2015). Vegan: Community Ecology Package. R Package Vegan, version 2.2-1. http://CRAN.R-project.org/package=vegan.
- Okuda, T. & Neushul, M. (1981). Sedimentation studies of red algal spores. Journal of Phycology, 17: 113–118.
- Peters, A.F., Couceiro, L., Tsiamis, K., Küpper, F.C. & Valero, M. (2015). Barcoding of cryptic stages of marine brown algae isolated from incubated substratum reveals high diversity in Acinetosporaceae (Ectocarpales, Phaeophyceae). Cryptogamie Algologie, 36: 3–29.
- Pierce, S.K., Curtis, N.E., Massey, S.E., Bass, A.L., Karl, S.A. & Finney, C.M. (2006). A morphological and molecular comparison between Elysia crispata and a new species of kleptoplastic sacoglossan sea slug (Gastropoda: Opisthobranchia) from the Florida Keys, USA. Molluscan Research, 26: 23–38.
- R Core Team (2015). R: A Language and Environment for Statistical Computing. R Foundation for Statistical Computing, Vienna. https://www.R-project.org/.
- Robuchon, M., Couceiro, L., Peters, A.F., Destombe, C. & Valero, M. (2014). Examining the bank of microscopic stages in kelps using culturing and barcoding. European Journal of Phycology, 49: 128–133.
- Santelices, B. (1990). Patterns of reproduction, dispersal and recruitment in seaweeds. Oceanography and Marine Biology – An Annual Review, 28: 177–276.
- Saunders, G.W. & Kucera, H. (2010). An evaluation of rbcL, tufA, UPA, LSU and ITS as DNA barcode markers for the marine green macroalgae. Cryptogamie Algologie, 31: 487–528.
- Sauvage, T., Schmidt, W.E., Suda, S. & Fredericq, S. (2016). A metabarcoding framework for facilitated survey of endolithic phototrophs with tufA. BMC Ecology, 16: 8.
- Schloss, P.D., Gevers, D. & Westcott, S.L. (2011). Reducing the effects of PCR amplification and sequencing artifacts on 16S rRNA-based studies. PLoS ONE, 6: e27310.
- Sherwood, A.R., Dittbern, M.N., Johnston, E.T. & Conklin, K.Y. (2017). A metabarcoding comparison of windward and leeward airborne algal diversity across the Ko ‘olau mountain range on the island of O’ahu, Hawaii. Journal of Phycology, 53: 437–445.
- Sildever, S., Kawakami, Y., Kanno, N., Kasai, H., Shiomoto, A., Katakura, S. & Nagai, S. (2019). Toxic HAB species from the Sea of Okhotsk detected by a metagenetic approach, seasonality and environmental drivers. Harmful Algae, 87: 101631.
- Steneck, R.S., Graham, M.H., Bourque, B.J., Corbett, D., Erlandson, J.M., Estes, J.A. & Tegner, M.J. (2002). Kelp forest ecosystems: biodiversity, stability, resilience and future. Environmental Conservation, 29: 436–459.
- Steneck, R.S. & Johnson, C. (2014). Kelp forests: dynamic patterns, processes and feedbacks. In Marine Community Ecology and Conservation (Bertness, M.D. et al., editors), 315–366. Sinauer Associates, Sunderland, MA.
- Tamura, K., Stecher, G., Peterson, D., Filipski, A. & Kumar, S. (2013). MEGA6: Molecular Evolutionary Genetics Analysis version 6.0. Molecular Biology and Evolution, 30: 2725–2729.
- Thompson, M.D., Copertino, D.W., Thompson, E., Favreau, M.R. & Hallick, R.B. (1995). Evidence for the late origin of introns in chloroplast genes from an evolutionary analysis of the genus Euglena. Nucleic Acids Research, 23: 4745–4752.
- Venables, W.N. & Ripley, B.D. (2002). Modern Applied Statistics with S. 4th ed. Springer, New York.
- Warnes, G.R., Bolker, B., Bonebakker, L., Gentleman, R., Huber, W., Liaw, A., Lumley, T., Maechler, M., Magnusson, A., Moeller, S., Schwartz, M. & Venables, B. (2009). gplots: Various R programming tools for plotting data. http://cran.r-project.org/web/packages/gplots/index.html.
- Watanabe, H., Ito, M., Matsumoto, A. & Arakawa, H. (2016). Effects of sediment influx on the settlement and survival of canopy-forming macrophytes. Scientific Reports, 6: 18677.
- Watanuki, A., Aota, T., Otsuka, E., Kawai, T., Iwahashi, Y., Kuwahara, H. & Fujita, D. (2010). Restoration of kelp beds on an urchin barren: removal of sea urchins by citizen divers in southwestern Hokkaido. Bulletin of Fisheries Research Agency, 32: 83–87.