
 ?Mathematical formulae have been encoded as MathML and are displayed in this HTML version using MathJax in order to improve their display. Uncheck the box to turn MathJax off. This feature requires Javascript. Click on a formula to zoom.
ABSTRACT
The impact of the heavy metal cadmium on the lightly silicified marine diatom Cylindrotheca closterium was studied with regard to growth dynamics, organic matter production and morphological characteristics. C. closterium cultures were able to sustain positive growth in the tested range of 0–1000 μg Cd l–1 with a significant decrease in specific growth rate in the exponential growth phase at the highest tested Cd concentration. The concentrations of both dissolved (DOCcell) and particulate organic carbon per cell (POCcell) in C. closterium cultures exposed to 500 and 1000 µg l–1 Cd more than doubled compared with the control culture. Enhanced organic matter production as a feedback response to Cd exposure may thus contribute to cell detoxification, supported by the electrochemical data showing that Cd was not significantly accumulated by or associated with diatom cells except for the culture exposed to 1000 μg Cd l–1. In order to gain more insight into the effects of cadmium on diatom morphological features, the cell surface of C. closterium was characterized at the nanoscale on a single cell level using atomic force microscopy (AFM). Changes induced by Cd were observed as irregular patterns of silica spheres on more silicified parts of the cell, girdle band and around the raphe. These changes clearly show that beside the physiological response, C. closterium also showed a morphological response which is probably due to the interference of Cd with the diatom biosilification process. This study overall contributes to better understanding of the effects of cadmium on diatoms and shows that morphological characteristics assessed by AFM may be a valuable indicator for metal contamination.
Introduction
Anthropogenic pollutants in aquatic environments have significantly increased over the last few decades. Among these, heavy metals including cadmium have long been recognized as major marine pollutants (Cheung et al., Citation2003; Ansari et al., Citation2004; Wang & Wang, Citation2011; Suratno et al., Citation2015). Cadmium (Cd) is a non-essential trace metal considered as one of the most toxic metals even at µg per litre levels (Wang & Wang, Citation2009). It can accumulate to hazardous levels in living organisms, posing environmental and human health risks. Cd toxicity is believed to result primarily from its interaction with sulphydryl, carboxyl, and imidazole groups of enzymes, causing inhibition of many physiological processes, including photosynthesis and respiration (Prasad et al., Citation1998; Wang & Wang, Citation2008). However, under conditions of Zn limitation, it was shown that Cd can replace Zn in the carbonic anhydrase catalytic site in the marine diatom Thalassiosira weissflogii which was confirmed by expression of Cd-containing carbonic anhydrase (CDCA1) (Lane & Morel, Citation2000; Lane et al., Citation2005; Alterio et al., Citation2015). Park et al. (Citation2007) also observed the presence of Cd-containing carbonic anhydrase in some other diatom species.
Unicellular algae are primary producers widely used for assessing the impact of toxins in aquatic environments (Bitton & Dutka, Citation1986). Most of the usual tests involving microalgae have been based on population growth (OECD, Citation2011), respiratory processes (Pérez-García et al., Citation1993) or 14C assimilation (Kusk & Nyholm, Citation1991). Despite their small size, diatoms (Bacillariophyta) occupy an essential position at the base of the aquatic food web and are important primary producers (Armbrust, Citation2009; Ianora & Miralto, Citation2010), being responsible for 25–40% of the inorganic carbon fixation in oceans (Falkowski et al., Citation2004; Granum et al., Citation2005). Due to their cosmopolitan nature, short lifespan and quick response to environmental and anthropogenic perturbations diatoms can be used as sensors of environmental quality (De Stefano et al., Citation2009; Rimet, Citation2012; Tudesque et al., Citation2012).
Morin et al. (Citation2012) reviewed the response of diatoms to metal pollution from the individual level (e.g. size, growth form and morphological abnormalities) to community structure (replacement of sensitive species by tolerant ones). Although morphological abnormalities in diatoms have been reported and thoroughly studied under different types of environmental and anthropogenic perturbations (Falasco et al., Citation2009), they have most often been reported under heavy metal stress (Morin et al., Citation2012). The relationship between diatom frustule deformations and contamination by heavy metals including Cd (Morin et al., Citation2007, Citation2008; Falasco et al., Citation2009; Corcoll et al., Citation2012; Pandey et al., Citation2014) indicated that the occurrence of diatom deformities was a good indicator of high heavy metal contamination. While systematic changes in nanostructural characteristics in the aforementioned studies of diatom frustules induced by heavy metals have been observed by electron microscopy (EM), no corresponding atomic force microscopy (AFM) measurements of diatom cells exposed to heavy metals have been reported so far, to our knowledge, although the number of AFM investigations of diatoms is growing steadily (Luís et al., Citation2017). AFM is one of the most effective tools for studying the structure and surface properties of biological samples at the nanoscale (Binnig et al., Citation1986; Hörber & Miles, Citation2003). AFM allows the examination of biological specimens in their native intact state, without the need for chemical fixation, dehydration and/or staining, associated with other high-resolution techniques such as electron microscopy. Moreover, AFM avoids the need for removal of organic matter from the diatom cells, in contrast to electron microscopy. The first AFM characterization of the diatom cell wall at the nanostructural level was made on the diatom Navicula pelliculosa dried with ethanol in 2001 (Almqvist et al., Citation2001), followed by characterization of live diatom cells of Pinnularia viridis and Hantzchia amphioxys in the same year (Crawford et al., Citation2001). In our previous studies we used AFM to characterize nanostructural and nanomechanical properties of Cylindrotheca closterium (Pletikapić et al., Citation2012) and supramolecular organization of its extracellular polymers (Pletikapić et al., Citation2011; Svetličić et al., Citation2011, Citation2013). Using AFM nanomechanical measurements we also revealed that Dunaliella tertiolecta cells were significantly stiffer in the presence of Cd, which influenced the dynamics of the initial contact between the cell and the model charged interface (Ivošević DeNardis et al., Citation2019).
The aim of the present study was to assess the response of the lightly silicified marine diatom Cylindrotheca closterium to Cd, with regard to cell physiology and cell morphology. C. closterium was chosen as an ecologically important cosmopolitan species, widely distributed in high and low latitude marine to brackish waters where this species can reach high densities (de Brouwer et al., Citation2005; Najdek et al., Citation2005). C. closterium has also been widely used as a diatom model system to study diatom ecophysiology, including the production and function of extracellular polymeric substances (de Brouwer et al., Citation2005; Pletikapić et al., Citation2011), movement (Apoya-Horton et al., Citation2006; Araújo et al., Citation2013) and anti-oxidative defence (Rijstenbil, Citation2005). Moreno-Garrido et al. (Citation2003) used C. closterium for toxicity tests in surface sediments and showed that C. closterium is a suitable organism for this purpose, with a good growth rate and sensitivity to heavy metals. In a recent study by Becker & Copplestone (Citation2019), it was established that C. closterium takes up a significant quantity of Cd from the sediment, as well as from the water column.
We designed an experiment for controlled laboratory conditions in which C. closterium was exposed to different Cd concentrations in the range 1–1000 µg l−1. The level of stress caused by Cd exposure was assessed by measuring cell growth and organic matter production. Additionally, morphological changes at the single cell level were assessed using AFM. These physiological and morphological measurements can support the prediction of diatom behaviour in different Cd contamination levels. We also introduce AFM as a method for evaluating the impact of heavy metal on nanostructural characteristics of diatom cells under ambient conditions, avoiding the drastic sample preparation procedures needed for electron microscopy, including cleaning diatom frustules from organic material and coating the samples, which could destroy the structure of lightly silicified diatoms or cell integrity of other phytoplankton species with softer cell membranes.
Materials and methods
Phytoplankton culture
The diatom C. closterium (Ehrenberg) Reimann & Lewin (strain CCNA1) was isolated from a seawater sample collected in the northern Adriatic Sea (offshore station SJ108, 12°45′E, 44°45.4′N, 12 m depth, 13 November 2006). One DNA sequence is deposited in GenBank under accession number HM070405 (18S (SSU) ribosomal RNA) (Pletikapić et al., Citation2011). The diatom was grown in 250 ml conical flasks containing 100 ml f/2 medium (Guillard, Citation1975). Seawater for preparation of f/2 media was sampled in the Adriatic Sea (500 m offshore of Vis Island, 20 m depth) and filtered through a 0.2 µm pore size cellulose nitrate membrane filter (Whatman). Cultures were incubated in a water bath at a temperature of 20°C with constant shaking (15 rpm), 12:12 light:dark (L:D) cycle at an irradiance of 31 µmol photons m–2 s–1.
Cadmium exposure experiment
Erlenmeyer flasks containing 89 ml of f/2 medium were inoculated with 10 ml of algal culture in the exponential growth phase (5-day-old). Then, 1 ml of Cd solution with different concentrations, from 100 µg l–1 (0.889 µmol l–1) to 100 mg l–1 (0.889 mmol l–1), were added to Erlenmeyer flasks (no Cd was added to the control culture) and stoppered with cotton. Cd was applied as a cadmium nitrate (Cd(NO3)2) (AAS TraceCERT®, Fluka). Cadmium concentrations in the culture media tested were 1 µg l–1 (0.0089 µmol l–1), 10 µg l–1 (0.089 µmol l–1), 100 µg l–1 (0.889 µmol l–1), 500 µg l–1 (4.449 µmol l–1) and 1000 µg l–1 (8.897 µmol l–1). For all tested Cd concentrations an initial cellular concentration was ~104 cells ml–1. The cultures were grown in duplicates.
Modelling of chemical speciation
Computational simulations of chemical equilibrium were performed with Visual MINTEQ ver. 3.1. (Gustafsson, Citation2018) in order to calculate potentially bioavailable cadmium concentration (free ions and inorganic complexes), as well as the concentrations of Cd-EDTA complexes. Speciation calculations were performed taking into account major, minor and trace cations and anions of the f/2 medium which are influencing cadmium speciation (Cl–, SO42–, CO32–, OH–, Na+, Mg2+, Ca2+, Fe3+, Cu2+, Mo6+, Zn2+, Co2+ and Mn2+). For concentrations of metals Fe3+, Cu2+, Mo6+, Zn2+, Co2+ and Mn2+ concentrations in the f/2 medium were used (Guillard, Citation1975) and for Cl–, SO42–, CO32–, OH–, Na+, Mg2+ and Ca2+ average concentrations in seawater were used. The ionic strength of 0.7 M, pH of 8.15 (pH of the f/2 medium) and concentration of EDTA of 1.17 10–5 M (concentration of EDTA in the f/2 medium; Guillard, Citation1975) were used for all calculations.
Growth inhibition determination
During the experiment, 1 ml of algal cultures were sampled at the beginning of the experiment (day 0) and after 1, 2, 3, 4, 7, 10, 14 and 18 days from each test flask. Flasks were vigorously manually stirred prior to taking samples to prevent cell settling. Cells were counted using a light microscope (Olympus model BX51 equipped with DP70 Digital Camera System and operating with DP Controller and DP Manager software Olympus Corporation, Tokyo, Japan, 200× magnification) with Fuchs-Rosenthal hemocytometer.
The average specific growth rate for a specific time period was calculated according to the equation described in OECD (Citation2011):
where, μi–j is the average specific growth rate from time i to j; ti is the time of the start of the period; tj is the time of the end of the period; Ni is the cell number per volume of culture at time i; Nj is the cell number per volume of culture at time j.
Growth inhibition was calculated according to the formula described by OECD (Citation2011):
where, % I is the per cent inhibition; µC is the average specific growth rate in the control group, and µT is the average specific growth rate for the treatment replicate.
For statistical data analysis purposes, data values for cell density as a function of time in the area of the exponential growth (from day 0 to day 4, 7 and 10) were fitted to the following exponential function:
to obtain fitted specific growth rates µ0–j (µ(f)) within tested time intervals. The fitted specific growth rate values for exposure groups and control group were compared (Supplementary figs 1-3). Specific growth rate values differing more than ± 2 standard deviations (SD) were considered to be statistically significant.
Organic carbon analysis
Organic carbon, both dissolved and particulate, was analysed with the high-temperature catalytic oxidation method (HTCO). TOC–VCPH (Shimadzu, Japan) carbon analyser with platinum/silica catalyst (Elemental Microanalysis, UK) and a non-dispersive infrared (NDIR) detector for CO2 measurements was used for dissolved organic carbon (DOC) measurements and calibrated with potassium hydrogen phthalate. Concentration was calculated as an average of three replicates. The average instrument and Milli-Q blank corresponded to 30 μg C l–1 with high reproducibility (1.5%). Particulate organic carbon (POC) was analysed with a solid sample module SSM-5000A associated with a TOC–VCPH carbon analyser calibrated with glucose. A mixture of CoO and platinum/silica was used as a catalyst for the particulate phase. Prior to analysis, filtration of 50 ml of each sample was performed through 0.7 μm Whatman GF/F filters, previously combusted at 450°C for 4 h, to separate DOC and POC fractions. DOC samples were preserved with mercury chloride (10 mg l–1) and stored at +4°C in the dark until analysis. POC samples were stored at −50°C until analysis.
Samples for DOC and POC analyses were taken from the cultures on day 18 of the experiment for each tested Cd concentration including the control sample and from the culture medium before inoculation. DOC and POC data were obtained by deducing measured values in the cultures from the measured value in the culturing medium. Batch cultures were not axenic; however, all precautions were taken to avoid further contamination with bacteria. During cell counting, we observed a negligible number of dead cells, lacking pigments and cell content. Therefore, analysed dissolved organic carbon is discussed as being mainly produced by C. closterium.
Cadmium measurements by voltammetry
Electrochemical measurements of Cd were performed using differential pulse anodic stripping voltammetry (DPASV) on a µAutolab3 potentiostat (Autolab-Metrohm). Total Cd concentrations and dissolved concentrations of Cd present in the culture (after filtering the sample through 0.45 µm pore size cellulose nitrate filters (Sartorius, Germany)) were determined at days 7 and 18 of the growth experiment for each tested Cd concentration. Samples were digested by acidification to pH < 2 with HNO3 (ROTIPURAN Supra 69%, Roth, Germany), and irradiated by UV-light (mercury lamp, 150 W, Hanau, Germany) for 24 hours. Prior to measurements, samples were diluted with sterilized seawater up to 2000 times, depending on the concentration of the Cd added to the f/2 medium. Measurements were done in a three-electrode cell (663 VA Stand, Metrohm), with a hanging mercury drop (HMDE) as a working electrode, an Ag/AgCl (sat. NaCl) as a reference electrode and a platinum wire as a counter electrode. Accumulation potential used for measurements was −0.85 V with accumulation times between 45 and 300 s, depending on the dilution factor of the samples. Concentrations of Cd were determined by a method of standard addition, and results are presented with error bars representing a 95% confidence interval.
Atomic force microscopy
For nanostructural characterization of the C. closterium cell surface, topography images were collected using a Multimode AFM with Nanoscope IIIa controller (Bruker) and a vertical engagement (JV) 125 µm scanner. Contact mode imaging was performed using silicon-nitride tips (NP-S, Bruker, nom. freq. 12–24 kHz, nom. spring constant of 0.06 N/m). The linear scanning rate was optimized between 1.5 and 2 Hz with a scan resolution of 512 samples per line. The setpoint was kept at the lowest possible value to minimize the interaction forces between the tip and the surface. Processing and analysis of images were carried out using NanoscopeTM software (Bruker).
Sample preparation for AFM imaging
Cells used for AFM experiments were recovered from the stationary growth phase (day 14) from the cultures with 0 µg Cd l–1, 1 µg Cd l–1, 10 µg Cd l–1, 100 µg Cd l–1, 500 µg Cd l–1 and 1000 µg Cd l–1. For sample preparation, we used the direct drop deposition method (Mišić Radić et al., Citation2011; Pletikapić et al., Citation2011). Five µl of the cell culture was pipetted directly onto freshly cleaved mica. Mica sheets were placed in enclosed Petri dishes for 30–45 min to allow cells to settle and attach to the surface. Samples were then rinsed three times for 30 s in ultrapure water and placed in enclosed Petri dishes at a relative humidity of 60% to evaporate the excess of water on the mica. Rinsing of the samples with ultrapure water was necessary to remove the excess of salt crystals that would hamper AFM imaging under ambient conditions. With this procedure, the diatom cells stayed firmly attached to the mica surface, enabling stable imaging for AFM experiments.
Results
Cadmium bioavailability
Results of chemical speciation modelling at different Cd concentrations using software Visual MINTEQ ver.3.1.1 are shown in . Bioavailable (free and inorganic) Cd concentrations were far below total Cd due to the formation of strong Cd-EDTA complexes. The concentration of free Cd is around 22× lower than the inorganic Cd fraction in which chloride complexes dominate. With increasing Cd concentration from 1 µg Cd l–1 to 1000 µg Cd l–1, the bioavailable Cd fraction (free and inorganic fraction) also increased from 43% to 76%. Additionally, pH measurements during a separate growth experiment showed that the initial pH of 8.1 remained unchanged for the first 4 days of the experiment, after which it started to increase, reaching 8.5 on day 7, and 9.0 on day 18 of the experiment. According to speciation calculations, the bioavailability of Cd is expected to decrease by ~20% from day 0 to day 7, for all added concentrations of Cd. By day 18, the bioavailability of Cd decreased further, dropping to 8% of bioavailable Cd for the lowest added Cd concentration of 1 µg l–1, to 24% of bioavailable Cd for the 1000 µg l–1 concentration.
Table 1. Modelling of cadmium chemical speciation in the f/2 medium (pH = 8.15, c(EDTA)=1.17 10–5 M)
Effect of cadmium on Cylindrotheca closterium growth
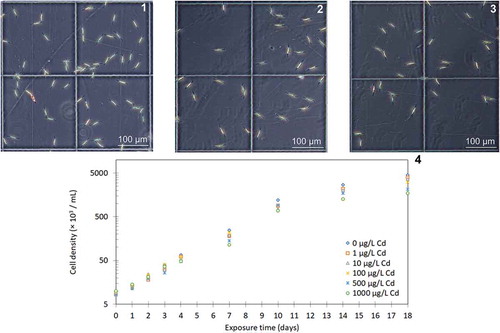
Growth curves of C. closterium exposed to different concentrations of Cd in the range 0–1000 µg l–1, with optical micrographs of cultures at selected Cd concentrations, are shown in . Growth curves show typical exponential growth from day 0 to day 10, followed by entering into the stationary phase from day 10 for the whole range of tested Cd concentrations (0–1000 µg l–1). For all tested Cd concentrations C. closterium cells were able to sustain positive growth. Specific growth rates (µ) and percentage inhibition (%I) of C. closterium in the exponential growth phase exposed to different Cd concentrations calculated according to EquationEq. 1(1)
(1) and EquationEq. 2
(2)
(2) are shown in . During the first 4 days of the exponential phase, the specific growth rate decreased from 0.48 d–1 (corresponding to the division rate of 0.69 div d–1) in the control culture to 0.39 d–1 (corresponding to the division rate of 0.56 div d–1) in the culture exposed to 1000 µg Cd l–1. The specific growth rate for the 7-day period decreased from 0.46 d–1 (division rate 0.66 div d–1) for the control to 0.35 d–1 (division rate 0.50 div d–1) for the culture exposed to 1000 μg Cd l–1. For the 10 day period, the specific growth rate decreased from 0.48 d–1 (division rate of 0.69 div d–1) for the control to 0.42 d–1 (division rate of 0.61 div d–1) for cultures exposed to 1000 μg Cd l–1. The inhibitory effect of Cd on diatom growth during the exponential phase was greatest for cultures exposed to 1000 μg Cd l–1 for 7 days, which resulted in a growth inhibition of 24.7% relative to the control (). Difference in specific growth rates was tested by fitting the data values for cell density as a function of time in the exponential growth phase (for first 4, 7 and 10 days) for all tested Cd concentrations and control to EquationEq. 3
(3)
(3) . No significant difference in specific growth rate between cultures exposed to different Cd concentrations including the control was observed during the first 4 days (SI ). However, with prolonged exposure times (7 and 10 days), cultures exposed to 1000 µg Cd l–1 did show a significant decrease of specific growth rate relative to the control culture, as tested by fitting the data values for cell density as a function of time to EquationEq. 3
(3)
(3) (SI ).
Table 2. Specific growth rates (µ) and growth inhibition (%I) compared with control of Cylindrotheca closterium exposed to different cadmium concentrations in the exponential growth phase between day 4 (D4), day 7 (D7), day 10 (D10) and day 0 (D0)
Figs 1–4. Effects of different concentrations of cadmium on the growth of Cylindrotheca closterium. Figs 1–3. Optical micrographs of C. closterium culture on day 3 of growth in the control group (Fig. 1); in culture exposed to 500 μg Cd l–1 (Fig. 2); in culture exposed to 1000 μg Cd l–1 (Fig. 3). Fig. 4. Growth curves of C. closterium exposed to different cadmium concentrations (0–1000 μg Cd l–1) as measured by cell density over an 18 day period (values are the mean of duplicate determinations)
Effect of cadmium on organic matter production by C. closterium
The effect of Cd on organic matter production was analysed by measuring dissolved (DOC) and particulate organic carbon (POC). DOC and POC were analysed at day 18 of growth in the control culture and in the cultures exposed to different Cd concentrations in order to establish whether changes in organic matter production represent a response to the presence of Cd. DOC and POC data in the cultures are reported in and are additionally reported as DOC per cell (DOCcell) and POC per cell (POCcell) in order to compare the DOC and POC between the different cultures. DOCcell in the control culture and in the cultures exposed to Cd concentrations in the range 1–100 µg l–1 were in the range of 0.22–0.26 pg C cell–1. Higher DOCcell concentrations were found in cultures exposed to 500 µg Cd l–1 (0.82 pg C cell–1) and 1000 µg Cd l–1 (0.56 pg C cell–1), indicating a 3.6- and 2.4-fold increase, respectively. The lowest amount of POCcell was found in the control culture (17.6 pg C cell–1) and the highest amount of POCcell was found in the culture exposed to a Cd concentration of 500 µg Cd l–1 (46.2 pg C cell–1) followed by the culture exposed to a Cd concentration of 1000 (40.0 pg C cell–1), indicating a 2.6- and 2.3-fold increase, respectively.
Table 3. Dissolved organic carbon (DOC), dissolved organic carbon per cell (DOCcell), particulate organic carbon (POC) and particulate organic carbon per cell (POCcell) of Cylindrotheca closterium culture exposed to different cadmium concentrations at day 18 of growth. Cell density corresponds to cell density at day 18 of growth for Cd concentrations 0, 1, 10, 100, 500 and 1000 µg l–1
Cadmium uptake by Cylindrotheca closterium
Percentage of measured Cd concentration (% Cd) in the dissolved fractions (< 0.45 µm) and total Cd in C. closterium cultures exposed to different Cd concentrations compared with concentrations of added Cd in the cultures are shown in . The percentage of measured dissolved Cd on day 7 ranged from 82.9 ± 6.2% to 109.0 ± 9% and of the total Cd from 91.0 ± 6.7% to 105 ± 7%. On day 18 the percentage of measured dissolved Cd ranged from 92 ± 10% to 107.5 ± 4.7% and of the total Cd from 94 ± 17% to 106.8 ± 4.8%. The obtained results show that most of the Cd was present in the dissolved fraction, indicating that Cd in the C. closterium culture was not significantly accumulated by or associated with diatom cells with the exception of the culture exposed to 1000 μg Cd l–1 on day 7, where a significant difference between total and dissolved Cd was observed.
Table 4. Percentage of total Cd and dissolved Cd fraction of Cylindrotheca closterium cultures, compared with the concentration of Cd added in the culture measured by differential pulse anodic stripping voltammetry (DPASV). Samples were previously treated with acid (pH < 2) and UV
Effect of cadmium on nanostructural properties of Cylindrotheca closterium
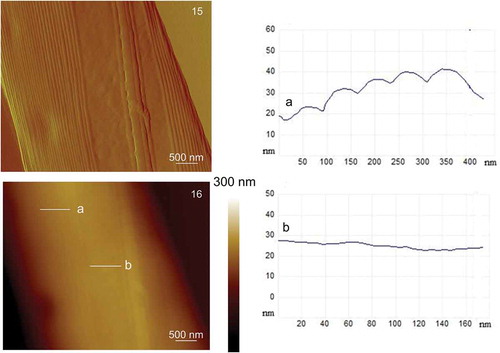
AFM images of cells from the culture that was not exposed to cadmium, where the details of the cell surface could be observed, are shown in . The cell has an elongated shape with cell length of 38–43 µm and cell width (at the centre of the cell) of 3.5–4.8 µm. The height of the cell at the centre of the cells and in the central part where chloroplasts are situated was 600–1000 nm and 750–1500 nm, respectively and rostra height was 200–300 nm. On C. closterium cells, flexible rostra can be clearly distinguished from the central part of the cell (). show the rostra and the central part of the cell at higher resolutions, where three morphologically different parts of the frustule can be easily distinguished: the girdle band, the valve and the raphe. High-resolution images of the central part of the cell revealed a non-structured and smooth surface of the valve whereas the girdle band showed a structured surface consisting of a set of parallel bands (). The longitudinal slit raphe extends along the valve (), and is bridged by the fibulae (). The spacing between fibulae was 250–350 nm, and fibulae arches underneath the cell wall were noticeable. On the enlarged image of the central part of the cell, vertical cross-sections were made (). The valve has a relatively smooth surface with an average roughness (Ra) of 3 nm, in contrast to the girdle band with Ra around 14 nm.
Figs 5–14. AFM images of a whole Cylindrotheca closterium cell and its morphological details acquired using contact mode in air. Fig. 5. The whole C. closterium cell. Figs 6–8. Enlarged upper rostra of the cell with raphe and fibulae. Figs. 9–11. The enlarged centre of the cell where girdle band, valve and raphe are seen in more detail. Figs. 12–14. Enlarged lower rostra of the cell. All images are deflection data with scan sizes: 45 μm × 25 μm (Fig. 5); 8.5 μm × 8.5 μm (Fig. 6); 5 μm × 5 μm (Fig. 7); 4 μm × 4 μm (Fig. 8); 4.5 μm × 4.5 μm (Fig. 9); 2 μm × 2 μm (Fig. 10); 2 μm × 2 μm (Fig. 11); 8.5 μm × 8.5 μm (Fig. 12); 8 μm × 8 μm (Fig. 13); 4 μm × 4 μm (Fig. 14). Labels V, G, R and F indicate the following features: valve, girdle band, raphe and fibulae
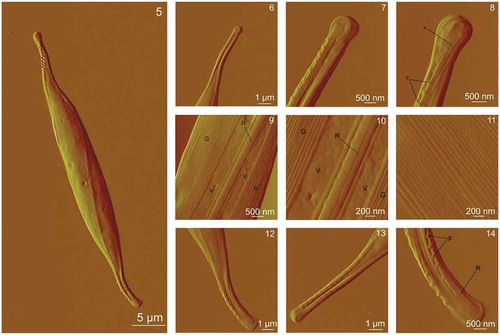
Figs 15–16. AFM images of the centre of the Cylindrotheca closterium cell acquired in contact mode. Fig. 15. Deflection data (scan size: 4 μm × 5 μm). Fig. 16. Height data (scan size: 4 μm × 5 μm, vertical scale: 300 nm) with analysis of vertical sections of the girdle band along the indicated line a and analysis of vertical sections of the valve along the indicated line b
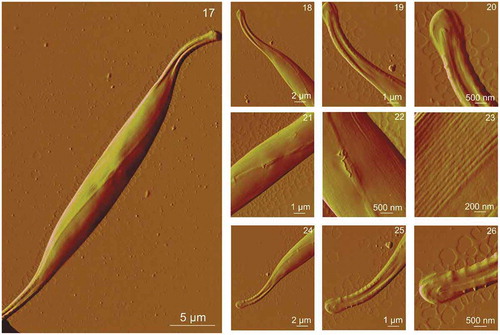
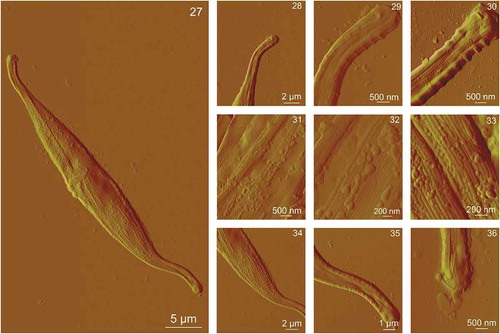
C. closterium cells exposed to the elevated concentrations of Cd (1–1000 µg l–1) maintain the same overall shape of the cells. The length and height of the cells cultured in the control culture and in the cultures with elevated concentrations of Cd did not differ significantly. Cells grown exposed to 1, 10 and 100 µg Cd l–1 showed identical morphology to cells in the control culture with no observed nanostructural changes compared with controls (data not shown). Cells exposed to 500 and 1000 µg Cd l–1 showed morphological changes on the cell surface. show AFM images of C. closterium cells exposed to 500 µg Cd l–1. The cell overall morphology was similar to the morphology of cells that were not exposed to Cd, but minor changes were observed in the central part of the cell and on its more silicified parts, the girdle band and around the raphe (). Clusters of smaller spherical particles () were visible around the raphe that were not detected on C. closterium cells from the control culture. Also, the structure of the girdle band at the central cell part appeared not to be as smooth as in the control sample but had more pronounced underlying features (). The surface of the valve did not change compared with the control (). The girdle band at the cell rostra appeared similar to that of C. closterium cells grown in control cultures (). show AFM images of C. closterium cells exposed to 1000 µg Cd l–1. Changes were visible on the entire surface of the cell in the form of irregular patterns of spherical particles. Spherical particles at the central part of the cell were mostly found on the more silicified regions, on the girdle band (), and around the raphe (), while a smaller number was detected on the valve (). Spherical particles were also observed on the girdle band and around the raphe on the rostra (). Vertical cross sections () show that diameters of particles ranged from 50–390 nm and the height of the particles ranged from 20–50 nm. The valve retained a relatively flat surface, but the girdle band appeared rougher due to spherical particles. Ra for the valve area was 4 nm, and Ra for the girdle band area was 25 nm.
Figs 17–26. AFM images of a whole Cylindrotheca closterium cell grown at cadmium concentration 500 μg l–1 and its morphological details acquired using contact mode in air. Fig. 17. The whole C. closterium cell. Figs 18–20. Enlarged upper rostra of the cell. Figs 21–23. The enlarged centre of the cell where girdle band and valve are seen more detailed. Figs 24–26. Enlarged lower rostra of the cell with expressed raphe and fibulae around it. All images are deflection data with scan sizes: 35 μm × 25 μm (Fig. 17); 18 μm × 14 μm (Fig. 18); 9 μm × 7 μm (Fig. 19); 4.5 μm × 3.5 μm (Fig. 20); 9 μm × 7 μm (Fig. 21); 4.5 μm × 3.5 μm (Fig. 22); 2 μm × 1.5 μm (Fig. 23); 18 μm × 14 μm (Fig. 24); 9 μm × 7 μm (Fig. 25); 4.5 μm × 3.5 μm (Fig. 26)
Figs 27–36. AFM images of a whole Cylindrotheca closterium cell grown at cadmium concentration 1000 μg l–1 and its morphological details acquired using contact mode in air. Fig. 27. The whole C. closterium cell. Figs 28–30. Enlarged upper rostra of the cell. Figs 31–33. The enlarged centre of the cell where girdle band and valve are seen in more detail. Figs 34–36. Enlarged lower rostra of the cell. All images are deflection data with scan sizes: 50 μm × 30 μm (Fig. 27); 13.5 μm × 11.5 μm (Fig. 28); 4.5 μm × 4 μm (Fig. 29); 4.5 μm × 4 μm (Fig. 30); 4.5 μm × 4 μm (Fig. 31); 2.5 μm × 2 μm (Fig. 32); 2 μm × 1.5 μm (Fig. 33); 18 μm × 15 μm (Fig. 34); 9 μm × 7.5 μm (Fig. 35); 4.5 μm × 4 μm (Fig. 36)
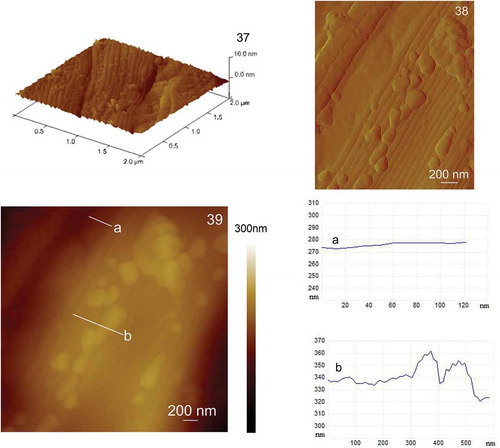
Figs 37–39. AFM images of the centre of the Cylindrotheca closterium cell, grown at cadmium concentration 1000 μg l–1, acquired in contact mode. Fig. 37. Three-dimensional display of the girdle band (scan size 2 μm × 2 μm, vertical scale 10 nm). Fig. 38. Deflection data of the girdle band (scan size 2.5 μm × 2 μm). Fig. 39. Height data (scan size 3.5 μm × 3.5 μm, vertical scale 300 nm) with analysis of vertical sections section of the valve along the indicated line a and analysis of vertical sections of the girdle band along the indicated line b
Discussion
Heavy metals, including Cd, are important anthropogenic contaminants in aquatic ecosystems and can cause diverse negative impacts on marine ecosystems. Since phytoplankton represents the base of the trophic pyramid and the main primary producer in the marine ecosystem, research on the impact of heavy metals on phytoplankton gives an insight into their impact on the entire food chain in the marine ecosystem.
The growth dynamic results show that C. closterium was able to maintain a positive growth rate in the exponential phase in the whole range of tested Cd concentrations. The concentrations of bioavailable Cd (including free and inorganic forms) (Sunda, Citation1989; Lage et al., Citation1994) in C. closterium cultures were estimated taking into account the chemical composition of the medium and the pH of the medium at the moment of Cd addition, and throughout the experiment. Lower values of bioavailable Cd compared to total Cd are due to the formation of strong Cd-EDTA complexes, which reduces the bioavailability (Lage et al., Citation1994) and consequentially the toxicity of heavy metals (Moreno-Garrido, Citation1997). The highest Cd concentration of 1000 µg l–1 (corresponding to 750.7 µg l–1 of bioavailable Cd) induced a significant decrease in the specific growth rate compared with the control culture. The lowest specific growth rate of C. closterium was found in the culture with a Cd concentration of 1000 μg l–1 over a 7 day period, 0.35 d–1 in comparison to 0.46 d–1 in the control culture, indicating a growth inhibition of 41.6%. Obtained results are consistent with previous studies where it was shown that exposure of Cylindrotheca sp. to Cd inhibited growth and reduced photosynthesis and cellular respiration (Lehman & Vasconcelos, Citation1979; Pistocchi et al., Citation2000; Satoh et al., Citation2005). Higher tolerance for toxic heavy metals compared with dinoflagellates was shown for the diatom Cylindrotheca fusiformis, which was not completely inhibited by Cd concentrations as high as 500 μg l–1 (Pistocchi et al., Citation2000). Higher tolerance to Cd was also shown by the diatom Phaedactylum tricornutum where the response to Cd was investigated on a molecular, metabolic and physiological level (Brembu et al., Citation2011).
Extracellular polymeric substance (EPS) release by phytoplankton is a process mostly dependent on phytoplankton physiological state and increased production was found to be a general response to the presence of heavy metals (Pistocchi et al., Citation1997, Citation2000). We found that the exposure to cadmium at concentrations of 500 and 1000 µg l–1 for 18 days more than doubled both DOC per cell (DOCcell) and POC per cell (POCcell) compared with the control values. The increase of DOCcell in the cultures exposed to heavy metal was expected and in line with previous reports showing that C. fusiformis exuded a higher amount of carbohydrates when cultured in the presence of heavy metal concentrations that were not extremely toxic (Pistocchi et al., Citation1997). The increase of POCcell in the cultures exposed to Cd could be due to the higher production of extracellular polymers that stay attached to the cell surface or secretion of larger particles that remain on GF/F filters used to separate DOC and POC fractions and thus are included in the POC fraction. Furthermore, heavy metals have also been found to increase the lipid content per cell in some microalgae (Einicker-Lamas et al., Citation2002; Yang et al., Citation2015) thus increasing POCcell. The secretion of large particles was previously demonstrated by Chin et al. (Citation2004) for Phaeocystis globosa, which uses regulated exocytosis to secrete polysaccharide gels, including large polymers or particles. Applying high-resolution imaging by AFM (Svetličić et al., Citation2013), we previously showed that extracellular polymers excreted by C. closterium were attached to the diatom cell wall or released into the surrounding seawater, and were best described as gel networks. Extracellular polymeric substances have high metal complexing capacities and could reduce metal bioavailability, thus increased EPS production may protect cells from the uptake of metals and their consequent toxicity (Decho, Citation1990; Pistocchi et al. Citation1997). Our results indicate that extracellular polymer release in C. closterium cultures exposed to Cd could be one of the self-defence mechanisms against toxic effects.
Electrochemical data show that Cd in the C. closterium culture was not significantly accumulated by or associated with diatom cells, being mostly present in the dissolved fraction, except for the culture exposed to 1000 μg Cd l–1 on day 7 of the experiment, where the measured percentage of dissolved Cd is significantly lower than total Cd measured. The lower dissolved Cd values in this culture could be explained by bioaccumulation of Cd and/or biosorption of Cd on the cell surface or on extracellular polymers attached on the cell surface. These data are in line with previously reported data (Kim Tiam et al., Citation2018) showing that the diatom Nitzschia palea exposed to Cd showed the lowest Cd dissolved values on day 7 of the experiment and increased Cd dissolved values with increased exposure time.
The addition of Cd to the cell culture of C. closterium did not affect the shape and size of cells. However, AFM revealed nanomorphological changes in frustule features at Cd concentrations of 500 µg l–1 and 1000 µg l–1. The irregular patterns of spherical particles, mostly located on the more silicified regions of the cell, girdle band and around the raphe Observed particles agreed in size (20–50 nm) with previous studies (Sumper & Kröger, Citation2004; Hildebrand et al., Citation2009) showing that silicate structures of different diatom species are composed of silica spherical nanoparticles 2–200 nm in diameter. Pletikapić et al. (Citation2012) showed that the nanoparticles forming the valve in C. closterium were 5–15 nm in height and are incorporated into the organic material of the valve, demonstrated by removal of the organic material with sulphuric acid, after which the nanoparticles were not fused and did not form a fixed nanostructure. The observed nanoparticles withstood additional acid treatments clearly indicating that they were non-organic. Morphological abnormalities in diatoms have been reported and thoroughly studied under different types of environmental and anthropogenic perturbations (Falasco et al., Citation2009), most often under heavy metal stress (Morin et al., Citation2012). Morphological abnormalities of diatom cells as a consequence of exposure to high cadmium concentrations were observed by an electron microscope in smaller pennate diatoms revealing micromorphological changes in frustule features. Cd led to the development of abnormal valve outlines in Achnanthidium spp., Amphora pediculus, Eolimna minima, Gomphonema parvulum, Mayamaea spp. (including M. agrestis) and Nitzschia palea (Morin et al., Citation2008). Interruption of the raphe was noticed in Encyonema minutum, Eolimna minima and Sellaphora seminulum, and abnormal pore shape and pattern in E. minima and G. parvulum (Morin et al., Citation2008). The observed morphological changes on the surface of the C. closterium cells are probably the consequence of the effect of Cd on the biosilification process, resulting in the appearance of irregular structures on some, more strongly silicified frustule parts since the formation of silica parts of the cell is under the control of environmental effects, such as the availability of silicon in seawater or the presence of toxic elements (Morin et al., Citation2008). Since silicic acid uptake in diatoms is known to be regulated by sulphydryl groups on the cell surface (Lewin, Citation1954), metals could affect the biosilification process through the perturbation of the silicic acid uptake due to their affinity to sulphydryl groups (Falasco et al., Citation2009). Additionally, Kim Tiam et al. (Citation2018) showed that exposure of the diatom Nitzschia palea to Cd affected silica regulation at the genetic level with strong down-regulation of the silicon transporter, suggesting a lower uptake of silicic acid under Cd stress.
The results obtained within this study contribute to a better understanding of the impact of the heavy metal cadmium on the marine diatom C. closterium, providing insight into growth dynamics, organic matter production and morphological changes at the cell level. Although the obtained results apply directly to C. closterium, they also form the basis for further investigation of the impact of heavy metals on the nanostructural properties of other phytoplankton species by AFM, enabling the study of native intact cell surfaces at the nanoscale without drastic sample preparation procedures.
Author contributions
T. Mišić Radić designed the study, drafted and finalized the manuscript; A. Čačković and T. Mišić Radić were responsible for C. closterium cultivation; A. Čačković performed AFM measurements; A. Čačković and T. Mišić Radić analysed AFM data; A. Čačković and J. Lončar analysed the growth dynamics data; A. Penezić performed electrochemical measurements and analysed the data; J. Dautović performed DOC/POC measurements, K. Juraić did statistical analysis of C. closterium growth data; D. Omanović did metal speciation calculation; Z. Ljubešić revised the manuscript. All authors read and approved the final manuscript.
TEJP-2019-0047-File008.docx
Download MS Word (495.8 KB)Acknowledgements
Marta Plavšić is thanked for the discussion about heavy metal speciation.
Disclosure statement
No potential conflict of interest was reported by the authors.
Supplementary information
The following supplementary material is accessible via the Supplementary Content tab on the article’s online page at http://10.1080/09670262.2020.1758347
Supplementary figs 1–3. Results of fit to the exponential function (EquationEq. 3(3)
(3) ) of growth curves of C. closterium exposed to different cadmium concentrations in the different parts of exponential growth phase marked by red rectangles (first 4 days in Supplementary fig. 1, first 7 days in Supplementary fig. 2, first 10 days in Supplementary fig. 3).
Additional information
Funding
References
- Almqvist, N., Delamo, Y., Smith, B.L., Thomson, N.H., Bartholdson, Å., Lal, R., Brzezinski, M. & Hansma, P.K. (2001). Micromechanical and structural properties of a pennate diatom investigated by atomic force microscopy. Journal of Microscopy, 202: 518–532.
- Alterio, V., Langella, E., De Simonea, G. & Monti, S.M. (2015). Cadmium-containing carbonic anhydrase CDCA1 in marine diatom Thalassiosira weissflogii. Marine Drugs, 13: 1688–1697.
- Ansari, T.M., Marr, I.L. & Tariq, N. (2004). Heavy metals in marine pollution perspective – a mini review. Journal of Applied Sciences, 4: 1–20.
- Apoya-Horton, M.D., Yin, L., Underwood, G.J. & Gretz, M.R. (2006). Movement modalities and responses to environmental changes of the mudflat diatom Cylindrotheca closterium (Bacillariophyceae). Journal of Phycology, 42: 379–390.
- Araújo, C.V., Romero-Romero, S., Lourençato, L.F., Moreno-Garrido, I., Blasco, J., Gretz, M. R., Moreira-Santos, M. & Ribeiro, R. (2013). Going with the flow: detection of drift in response to hypo-saline stress by the estuarine benthic diatom Cylindrotheca closterium. PLoS ONE, 8 (11): e81073.
- Armbrust, E.V. (2009). The life of diatoms in the world’s oceans. Nature, 459: 185–92.
- Becker, A.E. & Copplestone, D. (2019). Cadmium uptake from sediment by Cylindrotheca closterium and the effect of diatom presence on partitioning of cadmium between sediment and water: a laboratory study. Limnology and Oceanography, 64: 2550–2568.
- Binnig, G., Quate, C.F. & Gerber, C. (1986). Atomic force microscope. Physical Review Letters, 56: 930–933.
- Bitton, G. & Dutka, B.J. (1986). Introduction and review of microbial and biochemical toxicity screening procedures. In Toxicity Test Using Microorganisms (Bitton, G. & Dutka, B.J., editors), vol. 1, 1–8. CRC Press, Boca Raton, FL.
- Brembu, T., Jorstad, M., Winge, P., Collier Valle, K. & Bones A.M. (2011). Genome-wide profiling of responses to cadmium in the diatom Phaeodactylum tricornutum. Environmental Science & Technology, 45: 7640–7647.
- Cheung, K.C., Poon, B.H.T., Lan, C.Y. & Wong, M.H. (2003). Assessment of metal and nutrient concentrations in river water and sediment collected from the cities in the Pearl River Delta, South China. Chemosphere, 52: 1431–1440.
- Chin, W.C., Orellana, M.V., Quesada, I. & Verdugo, P. (2004). Secretion in unicellular marine phytoplankton: demonstration of regulated exocytosis in Phaeocystis globose. Plant Cell Physiology, 45: 535–542.
- Corcoll, N., Bonet, B., Morin, S., Tlili, A., Leira, M. & Guasch, H. (2012). The effect of metals on photosynthesis processes and diatom metrics of biofilm from a metal-contaminated river: a translocation experiment. Ecological Indicators, 18: 620–631.
- Crawford, S.A., Higgins, M.J., Mulvaney, P. & Wetherbee, R. (2001). Nanostructure of the diatom frustule as revealed by atomic force and scanning electron microscopy. Journal of Phycology, 37: 543–554.
- de Brouwer J.D., Wolfstein K., Ruddy G.K., Jones T.E.R. & Stal, L.J. (2005). Biogenic stabilization of intertidal sediments: the importance of extracellular polymeric substances produced by benthic diatoms. Microbial Ecology, 49: 501–512.
- Decho, A.W. (1990). Microbial exopolymer secretions in ocean environments: their role(s) in food webs and marine processes. Oceanography and Marine Biology: An Annual Review, 28: 73–153.
- De Stefano, L., Rotiroti, L., De Stefano, M., Lamberti, A., Lettieri, S., Setaro, A. & Maddalena, P. (2009). Marine diatoms as optical biosensor. Biosensors & Bioelectronics, 24: 1580–1584.
- Einicker-Lamas, M., Mezian, G.A., Fernandes, T.B., Silva, F.L.S., Guerra, F., Miranda, K., Attias, M. & Oliveira, M.M. (2002). Euglena gracilis as a model for the study of Cu2+ and Zn2+ toxicity and accumulation in eukaryotic cells. Environmental Pollution, 120: 779–786.
- Falasco, E., Bona, F., Badino, G., Hoffmann, L. & Ector, L. (2009). Diatom teratological forms and environmental alterations: a review. Hydrobiologia, 623: 1–35.
- Falkowski, P., Katz, M.E., Knoll, A.H., Quigg, A., Raven, J.A., Schofield, O. & Taylor, F.J.R. (2004). The evolution of modern eukaryotic phytoplankton. Science, 305: 354–360.
- Granum, E., Raven, J.A. & Leegood, R.C. (2005). How do marine diatoms fix 10 billion tons of inorganic carbon per year? Canadian Journal of Botany, 83: 898–908.
- Guillard, R.R. (1975). Culture of phytoplankton for feeding marine invertebrates. In Culture of Marine Invertebrate Animals (Smith, W.L. & Chanley, M.H., editors), 29–60. Plenum, New York, NY.
- Gustafsson, J.P. (2018). Visual Minteq ver 3.1. KTH, https://vminteq.lwr.kth.se/.
- Hildebrand, M., Holton, G., Joy, D.C., Doktycz, M.J. & Allison, D.P. (2009). Diverse and conserved nano- and mesoscale structures of diatom silica revealed by atomic force microscopy. Journal of Microscopy, 235: 172–187.
- Hörber, J.K.H. & Miles, M.J. (2003). Scanning probe evolution in biology. Science, 302: 1002–1005.
- Ianora, A. & Miralto, A. (2010). Toxigenic effects of diatoms on grazers, phytoplankton and other microbes: a review. Ecotoxicology, 19: 493–511.
- Ivošević DeNardis, N., Pečar Ilić, J., Ružić, I., Novosel, N., Mišić Radić, T., Weber, A., Kasum, D., Pavlinska, Z., Balogh, R.K., Hajdu, B., Chorvatova, A.M. & Gyurcsik, B. (2019). Algal cell response to laboratory-induced cadmium stress: a multimethod approach. European Biophysics Journal, 48: 231–248.
- Kim Tiam, S., Lavoie, I., Doose, C., Hamilton, P.B. & Fortin, C. (2018). Morphological, physiological and molecular responses of Nitzschia palea under cadmium stress. Ecotoxicology, 27: 675–688.
- Kusk, K.O. & Nyholm, N. (1991). Evaluation of a phytoplankton toxicity test for water pollution assessment and control. Archives of Environmental Contamination and Toxicology, 20: 375–379.
- Lage, O.M., Parente, A.M., Soares, H.M.V.M., Vasconelos, M.T.S.D. & Salema, R. (1994). Some effects of copper on the dinoflagellates Amphidinium carterae and Prorocentrum micans in batch culture. European Journal of Phycology, 29: 253–260.
- Lane, T.W. & Morel, F.M.M. (2000). A biological function for cadmium in marine diatoms. Proceedings of the National Academy of Sciences USA, 97: 4627–4631.
- Lane, T.W., Saito, M.A., George, G.N., Pickering, I.J., Prince, R.C. & Morel, F.M.M. (2005). A cadmium enzyme from a marine diatom. Nature, 435: 42.
- Lehman, J.L. & Vasconcelos, A.C. (1979). Physiology of zinc and cadmium stress in the marine diatom Cylindrotheca closterium. Journal of Phycology, 15 (Suppl.): 19.
- Lewin, J.C. (1954). Silicon metabolism in diatoms. I. Evidence for the role of reduced sulfur compounds in silicon utilization. Journal of General Physiology, 37: 589–599.
- Luís, A.T., Hlúbiková, D., Vaché, V., Chouet, P., Hoffmann, L. & Ector, L. (2017). Atomic force microscopy (AFM) application to diatom study: review and perspectives. Journal of Applied Phycology, 29: 2989–3001.
- Mišić Radić, T., Svetličić, V., Žutić, V. & Boulgaropoulos, B. (2011). Seawater at the nanoscale: marine gel imaged by atomic force microscopy. Journal of Molecular Recognition, 24: 397–405.
- Moreno-Garrido, I. (1997). Toxicidad y acumulación de metales pesados en microalgas marinas usadas en acuicultura. Tesis Doctoral. Servicio de Publicaciones de la Universidad de Cádiz.
- Moreno-Garrido, I., Hampel, M., Lubián, L.M. & Blasco, J. (2003). Sediment toxicity tests using benthic marine microalgae Cylindrotheca closterium (Ehrenberg) Lewin and Reimann (Bacillariophyceae). Ecotoxicology and Environmental Safety, 54: 290–295.
- Morin, S., Vivas-Nogues, M., Duong, T.T., Boudou, A., Coste, M. & Delmas, F. (2007). Dynamics of benthic diatoms colonization in a cadmium/zinc-polluted river (Riou-Mort, France). Fundamental and Applied Limnology. Archiv für Hydrobiologie, 168: 179–187.
- Morin, S., Coste, M. & Hamilton, P.B. (2008). Scanning electron microscopy observations of deformities in small pennate diatoms exposed to high cadmium concentrations. Journal of Phycology, 44: 1512–1518.
- Morin, S., Cordonier, A., Lavoie, I., Arini, A., Blanco, S., Duong, T.T., Tornés, E., Bonet, B., Corcoll, N., Faggiano, L. et al. (2012). Consistency in diatom response to metal-contaminated environments. In Emerging and Priority Pollutants in Rivers (Guasch, H., Ginebreda, A. & Geiszinger, A., editors), 117–146. Springer, Berlin.
- Najdek, M., Blazina, M., Djakovac, T. & Kraus, R. (2005). The role of the diatom Cylindrotheca closterium in a mucilage event in the northern Adriatic Sea: coupling with high salinity water intrusions. Journal of Plankton Research, 27: 851–862.
- OECD (2011). Test No. 201: Freshwater Algae and Cyanobacteria, Growth Inhibition Test. OECD Guidelines for the Testing of Chemicals, Section 2. Effects on Biotic Systems. Organisation for Economic Cooperation and Development, Paris.
- Pandey, L.K., Kumar, D., Yadav, A., Rai, J. & Gaur, J.P. (2014). Morphological abnormalities in periphytic diatoms as a tool for biomonitoring of heavy metal pollution in a river. Ecological Indicators, 36: 272–279.
- Park, H., Song, B. & Morel F.M.M. (2007). Diversity of cadmium-containing carbonic anhydrase in marine diatoms and natural waters. Environmental Microbiology, 9: 403–413.
- Pérez-García, A., Codina, J.C., Cazorla, F.M. & de Vicente, A. (1993). Rapid respirometric toxicity test: sensitivity to metals. Bulletin of Environmental Contamination and Toxicology, 50: 703–708.
- Pistocchi, R., Guerrini, F., Balboni, V. & Boni, L. (1997). Copper toxicity and carbohydrate production in the microalgae Cylindrotheca fusiformis and Gymnodinium sp. European Journal of Phycology, 32: 125–132.
- Pistocchi, R., Mormile, A.M., Guerrini, F., Isani, G. & Boni, L. (2000). Increased production of extra- and intracellular metal-ligands in phytoplankton exposed to copper and cadmium. Journal of Applied Phycology, 12: 469–477.
- Pletikapić, G., Mišić Radić, T., Hozić Zimmermann, A., Svetličić, V., Pfannkuchen, M., Marić, D., Gordijan, J. & Žutić, V. (2011). AFM imaging of extracellular polymer release by marine diatom Cylindrothecae closterium (Ehrenberg) Reiman & J.C. Lewin. Journal of Molecular Recognition, 24: 436–445.
- Pletikapić, G., Berquand, A., Mišić Radić, T. & Svetličić V. (2012). Quantitative nanomechanical mapping of marine diatom in seawater using peak force tapping atomic force microscopy. Journal of Phycology, 48: 174–185.
- Prasad, M.N.V., Drej, K., Skawinska, A. & Strzalka, K. (1998). Toxicity of cadmium and copper in Chlamydomonas reinhardtii wild-type (WT2137) and cell wall deficient mutant strain (CW15). Bulletin of Environmental Contamination and Toxicology, 60: 306–311.
- Rijstenbil, J.W. (2005). UV- and salinity induced oxidative effects in the marine diatom Cylindrotheca closterium during simulated emersion. Marine Biology, 147: 1063–1073.
- Rimet, F. (2012). Recent views on river pollution and diatoms. Hydrobiologia, 683: 1–24.
- Satoh, A., Vudikaria, L.Q., Kurano, N. & Miyachi, S. (2005). Evaluation of the sensitivity of marine microalgal strains to the heavy metals, Cu, As, Sb, Pb and Cd. Environment International, 31: 713–722.
- Sumper, M. & Kröger, N. (2004). Silica formation in diatoms: the function of long-chain polyamines and silaffins. Journal of Material Chemistry, 14: 2059–65.
- Sunda, W.G. (1989). Trace metal interactions with marine phytoplankton. Biological Oceanography, 6: 411–442.
- Suratno, S., Puspitasari, R., Purbonegoro, T. & Mansur, D. (2015). Copper and cadmium toxicity to marine phytoplankton Chaetoceros gracilis and Isochrysis sp. Indonesian Journal of Chemistry, 15: 172–178.
- Svetličić, V., Žutić, V., Mišić Radić, T., Pletikapić, G., Hozić Zimmermann, A. & Urbani, R. (2011). Polymer networks produced by marine diatoms in the northern Adriatic Sea. Marine Drugs, 9: 666–679.
- Svetličić, V., Žutić, V., Petikapić, G. & Mišić Radić, T. (2013). Marine polysaccharide networks and diatoms at the nanometric scale. International Journal of Molecular Sciences, 14: 20064–20078.
- Tudesque, L., Grenouillet, G., Gevrey, M., Khazraie, K. & Brosse, S. (2012). Influence of small-scale gold mining on French Guiana streams: are diatom assemblages valid disturbance sensors? Ecological Indicators, 14: 100–106.
- Yang J., Cao J., Xing G. & Yuan H. (2015). Lipid production combined with biosorption and bioaccumulation of cadmium, copper, manganese and zinc by oleaginous microalgae Chlorella minutissima UTEX2341. Bioresource Technology, 175: 537–544.
- Wang, M.J. & Wang, W.X. (2008). Temperature-dependent sensitivity of a marine diatom to cadmium stress explained by subcellular distribution and thiol synthesis. Environmental Science and Technology, 42: 8603–8608.
- Wang, M.J. & Wang, W.X. (2009). Cadmium in three marine phytoplankton: accumulation, subcellular fate and thiol induction. Aquatic Toxicology, 95: 99–107.
- Wang, M.J. & Wang, W.X. (2011). Cadmium sensitivity, uptake, subcellular distribution and thiol induction in a marine diatom: exposure to cadmium. Aquatic Toxicology, 101: 377–386.