
ABSTRACT
The worldwide release of excessive nutrients (nitrogen [N], silicon [Si] and phosphorus [P]) into coastal waters is impacting phytoplankton growth and community structure. The coastal Bay of Bengal (BoB) is predicted to be 90% more eutrophic in the future; the impacts on phytoplankton are largely unknown. We present the first experimental results concerning the responses of coastal phytoplankton to changing nutrient stoichiometry (N:Si:P) in the southwest BoB. A gradual increase in Si, N and P supply resulted in exponential growth and significant nutrient depletion (Δ). The nutrients reaching the Bay are likely to possess a short residence time. We also show that any alteration in nutrient loading ratio may impact nutrient removal dynamics of N, Si and P differently. Growth-saturating concentrations for Si, N and P were ~55, 65 and 10 µM respectively, whereas luxury uptake was seen up to 20 µM for P and 65 µM for N and Si. Net consumption of N (ΔN) and P (ΔP) was decoupled from increasing Si concentrations. Gradual N enrichment under P- and Si-saturated conditions linearly increased ΔSi as well as ΔP, and diatoms dominated over cyanobacteria. The diatoms Thalassiosira spp. seemed to respond positively to N enrichment, probably due to their high nitrate uptake and storage capacity. Nitzschia spp, a pennate diatom, showed the opposite trend. Such modifications may have direct consequences on the food chain. The rates of N, Si and P removal under saturated concentrations were 1.03 ± 0.27, 1.35 ± 0.14 and 0.14 ± 0.02 µmol chlorophyll a–1 d–1, respectively and yielded a ratio of 7.5:9.8:1 (N:Si:P). The departure from the Redfield ratio (indicating eutrophication) in the Bay may potentially alter nutrient removal patterns, phytoplankton community composition and autochthonous organic matter stoichiometry.
Introduction
Coastal phytoplankton communities remove a significant amount of dissolved inorganic carbon and nutrients from coastal waters and support coastal fisheries. In general, phytoplankton growth and community composition are largely controlled by three major inorganic nutrients, nitrogen (N), phosphorus (P), silicon (Si), and trace metals such as iron (Amo & Brzezinski, Citation1999; Tyrell, Citation1999; Moor et al., Citation2013). N is mainly utilized for synthesizing structural cellular materials (amino acids, nucleic acids, proteins) including enzymes, vitamins and pigments (Cira et al., Citation2016). P is essential for synthesizing ATP, nucleic acids and lipids in all living cells (Brembu et al., Citation2017). Si is utilized by diatoms for siliceous frustule formation which contributes to removal of up to 265 × 1015 M silicon globally per annum (Yool & Tyrell, Citation2003).
The elemental ratio of carbon C, N and P (106:16:1) in marine phytoplankton was found to be uniform, known as the Redfield ratio (Redfield, Citation1958) which was modified later to C:N:P:Si = 106:16:1:15 (Brzezinski, Citation1985). In the marine environment, the concentrations of these major nutrients control phytoplankton growth and community composition, but their ratios also play a key role. However, deviation from the classical Redfield ratio is frequently seen in coastal and marine waters (Martiny et al., Citation2013). Among phytoplankton, diatoms are the most efficient scavengers of nutrients (Lomas & Gilbert, Citation2000; Lichtmann et al., Citation2007), so eutrophic marine systems such as coastal seas and upwelling waters are usually occupied by diatoms and exhibit high primary productivity. Nevertheless, the internal nutrient storage capacity of phytoplankton is highly variable among different groups, genera and species of phytoplankton and this ability largely controls community shifts in the natural environment.
In recent decades, natural N and P cycles have been perturbed due to increasing anthropogenic activities in water catchments (Rabalais et al., Citation2009). The usage of synthetic fertilizer has increased N and P drainage (eutrophication) into coastal waters (Glibert et al., Citation2014) worldwide (Turner et al., Citation2006; Gao & Zhang, Citation2010; Garnier et al., Citation2010). Aquaculture in coastal areas has been identified as one of the major contributors of aquatic N and P and has been predicted to increase considerably (Luo et al., Citation2018; Boesch, Citation2019). Conversely, river-borne Si transport into coastal seas and estuaries decreased significantly due to increasing damming (Laruelle et al., Citation2009), while accelerated land-use change is largely impacting Si loading in coastal waters (Chen et al., Citation2014). Diatom growth and cell division rates depend on Si availability so interrupted Si supply may restrict diatom growth and could promote non-siliceous phytoplankton blooms (Davidson & Gurney, Citation1999). A shift in phytoplankton community structure from a beneficial to harmful or a siliceous to non-siliceous bloom may occur due to imbalances in the N:P:Si ratio (Smayda, Citation1990; Turner et al., Citation2006; Zhou et al., Citation2008). The rapidly changing nutrient stoichiometry, i.e. a departure from the Redfield ratio, may potentially impact phytoplankton growth, community composition and organic matter stoichiometry in coastal seas (Smayda, Citation1990; Conley & Malone, Citation1992; Piehler et al., Citation2004; Martiny et al., Citation2013).
A good example can be seen in the North Sea (Burson et al., Citation2016) where Europe’s progressive efforts to control eutrophication decreased overall P loading relative to N, which led to a major shift in phytoplankton community structure and growth. Palaeoecological records showed that in the North American Great Lakes P enrichment after European settlement led to Si depletion due to massive biogenic silica (BSi) formation associated with diatom blooms (Schelske et al., Citation1983). Likewise, Martin et al. (Citation2013) noticed a significant decrease in nitrogen-fixing cyanobacterial blooms off the south-west coast of India over the last few decades associated with increased N and P inputs. Earlier studies established a strong correlation between phytoplankton stock, water quality and fisheries resources on the west coast of India (Subrahmanyan, Citation1959 and references therein) suggesting immediate consequences of phytoplankton community shift on planktivorous fish.
In India, the river input of P to coastal seas is estimated to be twice as high as other rivers in the world (Ramesh et al., Citation2015). Increasing agricultural activities associated with India’s growing population are also enhancing N input (Ramesh et al., Citation2017) in coastal areas. The coastal Bay of Bengal (BoB) receives a large amount of nutrients from numerous rivers and land runoff, influenced by the summer monsoon. N and P loadings in the BoB increased by 35–40% between 1970 and 2000, mostly related to agricultural activities. Moreover, with the growing population and developing agricultural practices, N and P loads have been predicted to double by 2050 (Sattar et al., Citation2014). Furthermore, there has been a steady increase in the number of tropical cyclones (Balaguru et al., Citation2014) which may also enhance the nutrient supply and phytoplankton blooms in the surface waters (Girishkumar et al., Citation2019). Such modifications in nutrient stoichiometry may potentially impact coastal phytoplankton growth, community composition and the elemental ratio of autochthonous organic matter. The coastal BoB is usually dominated by diatoms (Bandyopadhyay et al., Citation2017, and references therein) but a shift in phytoplankton community structure from a beneficial to harmful or a siliceous to non-siliceous bloom could occur due to imbalance in the N:P:Si ratio (Smayda, Citation1990; Turner et al., Citation2006; Zhou et al., Citation2008). There are several coastal water monitoring programmes in these regions and those studies may provide some ideas about seasonal shifts in the phytoplankton community. But, in an open system, it is difficult to link any observed trend to a single variable (such as altered nutrient stoichiometry). Controlled experiments provide the advantage of monitoring growth patterns/community shifts against one variable (e.g. specific nutrient concentration) keeping other factors unchanged. Hence, experimental studies help to develop understanding of future phytoplankton community response to the projected scenarios and are useful to formulate policies that would tackle eutrophication, allowing uninterrupted ecosystem services.
It should be noted that growth-saturating nutrient concentrations are not frequently seen in the coastal BoB, but are often reported from large estuarine systems such as the Ganges and Godavari (Biswas et al., Citation2004, Citation2010; Mukhopadhyay et al., Citation2006; Sarma et al., Citation2010; Jeffrey & Vesk, Citation1997). The average Si concentration reported in the lower stretches of these estuaries was 60.2 ± 13 µM. Further, under the projected eutrophication scenario in the coastal Bay, it is essential to understand the growth responses of phytoplankton at saturated nutrient concentrations (Glibert et al., Citation2016) which may eventually lead to ‘luxury’ uptake even under eutrophic conditions. In the present study, we altered the major nutrient supply ratios in three independent experiments. For each experiment, one key nutrient level varied, whereas the other two were supplied at saturated concentration, over multiple years. We argue that a simple nutrient enrichment experiment, altering the classical Redfield ratio within average nutrient ranges, may not provide the actual information on growth-saturating and luxury nutrient consumption levels. Therefore, we chose the growth-saturating nutrient concentrations to document the nutrient uptake potential of the phytoplankton from a coastal station (Visakhapatnam) in south-west BoB. The observed growth responses, nutrient uptake and community shift trends are discussed in terms of different physiological parameters.
Materials and methods
Stock culture
Polycarbonate (Nalgene, USA) bottles were acid cleaned followed by repeated MilliQ washes. Water was collected from ~1 m depth on the Visakhapatnam coast (17°42.108”N, 83°19.064”E; ) using clean plastic beakers, filtered with a 200 µm zooplankton mesh (to reduce grazing pressure by large mesozooplankton), and distributed into two 20 l bottles. An aliquot of seawater was transferred into a 4 l bottle and N, Si and P were added in the form of nitrate (KNO3, 100 µM NO3–, Merck, Germany), silicate (Na2SiF6, 100 µM SiO3–2, Sigma, USA) and phosphate (KH2PO4, 20 µM PO4–3, Merck, Germany). This water was equally distributed in two bottles and incubated in a water bath under a natural day:night cycle (12:12 h) on an open terrace. The water bath was screened with a nylon mesh to mimic the light penetration at 1 m water depth (for details see Biswas et al., Citation2017). The water in the bath was exchanged repeatedly to maintain the average surface water temperature of 28°C of the coastal BoB. Every day, the bottles were mixed gently (without taking them out of the mesh) to avoid biomass settlement at the bottom. After 48 h, the dense diatom culture was used as a stock culture for the main experiments. Please noticed and that the stock cultures were not the same for all experiments and were grown following the same protocol before each individual experiment. Initial nutrient concentrations were also quite different at the time of seawater collection and are mentioned in the following sections. The rest of the water (40 l) was filtered using GF/F filters (Advantec, Japan) followed by 0.22 µm filters (polycarbonate membrane, Millipore) to screen all other biomass and kept for the main experiment. Just before commencing the individual experiment, nutrients (N, P and Si) were added in different ratios and initial biomass was maintained at low concentrations (< 0.5 µg Chlorophyll a (Chl a) l–1).
Fig. 1. Map showing the sampling site on the south-west coast of Bay of Bengal
Experimental design
Altogether, three experiments () were conducted in 72 h incubations. The added nutrient concentrations were chosen based on trial experiments to determine the approximate saturation levels of N, Si and P. For each nutrient, further nutrient additions above the growth saturating concentrations did not affect nutrient depletion or growth, so these concentrations (100 µmol l–1 N and Si; 20 µmol l–1 P) were used for the experiments.
Fig. 2. Schematic representation of the experimental design. The green box represents the pre-culture phase. Experiment with variable Si had pre-set N and P concentrations. In the first part of this experiment (EXP-IA), the concentrations of N and P were 5 times higher than in the second part (EXP-IB). The second experiment investigated impacts of variable P addition under pre-set N and Si concentrations (EXP-II). The third experiment with variable N, addressed the effects of increasing N supply on phytoplankton growth and community under constant Si and P concentrations (EXP-III)
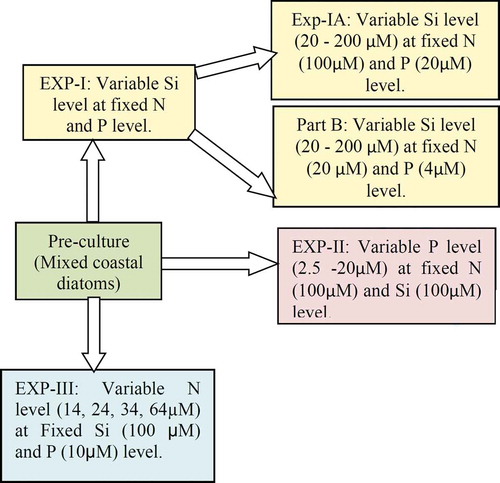
The first experiment addressed the impacts of variable Si supply on phytoplankton growth under unaltered N and P concentrations. At the time of water collection, N, Si and P concentrations were 6.91 µM, 9.57 µM and 1.15 µM, respectively. This experiment was conducted in two sub-sets; in the first set (A), N and P concentrations were five times higher than in the second set (B). In a 20 l bottle containing pre-filtered seawater, 100 µM N and 20 µM P (final concentrations) were added and mixed thoroughly before distributing in 17 l bottles. Si stock was added to make the final concentrations from 20–200 µM. An equal amount of phytoplankton biomass (5 ml) was added to each bottle from the stock culture. In another 20 l bottle (Nalgene, USA), 20 µM N and 4 µM P were added to the sterile filtered seawater and evenly distributed in seven 1 l bottles (acid cleaned; Nalgene, USA). Si stock was added to each bottle to make the final concentrations of 10 to 200 µM Si (7 sets). An equal amount of phytoplankton biomass was added to each bottle from the stock culture. A similar protocol was followed for each experiment as described for the stock culture.
The second experiment examined the growth responses of phytoplankton to variable P supply under unaltered N and Si concentrations. During this experiment, the initial nutrient concentrations were as follows: N = 11.26 µM; P = 1.9 µM; Si = 7.68 µM. Another 20 l bottle filled with the pre-filtered coastal water was enriched with 100 µM Si and 100 µM N and evenly distributed in 15 1 l bottles after thorough mixing. P concentrations varied from 2.5 µM to 20 µM (final concentrations). An equal amount of stock culture was added to each bottle and incubated under the same conditions as mentioned earlier. In addition to Chl a and BSi estimation, HPLC pigments were also analysed for this experiment. Random microscopy was used to check the stock culture before starting the experiment.
The third part of this experiment monitored the growth response and nutrient uptake potential in coastal phytoplankton under variable N concentrations and fixed Si and P concentrations. During this experiment, the initial N level was 14 µM and additional N was added (24, 34 and 64 µM) keeping the Si (100 µM) and P (10 µM) concentrations unaltered. Since we had only four N concentrations, there were replicates for each treatment. In addition to Chl a, BSi and nutrients, total protein, HPLC pigment and microscopic analyses of the phytoplankton community were also done.
Analytical methods
All dissolved inorganic nutrients were analysed using a spectrophotometer (Shimadzu UV-VIS-1800) following the standard protocol of Strickland & Parsons (Citation1972). N represents nitrate + nitrite, but ammonia was not measured. Net nutrient depletion or uptake (Δ) was quantified by subtracting the final nutrient value from its initial level. To quantify Chl a, a 100–200 ml water sample was filtered through a GF/F filter (25 mm, Advantech, Japan) using a vacuum pump (Rocker 600, pressure < 200 mmHg) under low light conditions to avoid photo-bleaching. Filters were folded, placed inside aluminium foil and frozen to −20°C. Prior to analysis, filters were soaked in 3–5 ml of 90% ice-cold acetone (HPLC grade, Merck, Germany) in a brown glass vial and kept tightly closed for 24 h at −20°C. Fluorescence values of the samples were measured in a fluorometer (Carry Eclipse, Varian), against the standard Chl a solution (Sigma Aldrich, USA). Chl a-based specific growth rate was calculated using the final and initial Chl a values using the following formula:
Specific growth rate (µChl a d–1) = [ln (final Chl a)− ln (initial Chl a)]/days
To quantify biogenic silica (BSi), a 100 ml subsample was filtered onto a 0.2 µm black polycarbonate membrane (GTTP, 47 mm, Millipore) and stored in a plastic Petri dish at 4°C until analysis. Prior to analysis, the filters were oven-dried at 60°C and then hydrolysed in 5ml 2N NaOH solution at 100°C in a temperature-controlled water bath for 1 h. Solutions were then neutralized with 5 ml of 2N HCL and 1 ml of the supernatant was made up to 25 ml with Milli-Q water. Dissolved Si was estimated using the standard protocol as stated above. Total protein was quantified using Lowry’s colorimetric method with Folin–Ciocalteu’s solution (Lowry et al., Citation1951). For phytoplankton pigment analysis, the filters were soaked in 3–5 ml of ice-cold 90% acetone (HPLC grade, Merck Chemicals) in amber glass vials overnight at −20°C followed by homogenization (Ultra Turrax, Germany) and centrifugation (−10°C) (Eppendorf, Germany). The supernatant was used to quantify phytoplankton pigments using an HPLC (Agilent Technology; Series 1200, C8 column, pore size 3.5 mm and a photodiode array detector) following the methods of Van Heukelem & Thomas (Citation2001). The contribution of different size classes of phytoplankton (micro, nano, pico; based on the concentrations of Chl a associated with different size class) were calculated from HPLC pigment data (Vidussi et al., Citation2001) using the following formula:
Micro (%) = [{1.4(fucoxanthin) + 1.4(peridinin)}/DPw] × 100
Pico (%) = [{1.01(chlorophyll b) + 0.86(zeaxanthin)}/DPw] × 100
(DP)w = Diagnostic pigment was calculated using the following formula:
(DP)w = Σ (0.86)zeaxanthin + (1.01)chlorophyll b+ (0.60)alloxanthin + (1.27)19′-hex fucoxanthin + (0.35)19′-but fucoxanthin+ (1.41)fucoxanthin + (1.41)peridinin.
Statistical analysis was performed using either one- or two-way ANOVAs (at 95% confidence level; p < 0.05) in Microsoft Excel (v 2007).
Results
All experiments were conducted in diluted batch cultures started from very low, which gives the best result for monitoring phytoplankton growth. These factors may collectively perturb the nutrient uptake and growth patterns. However, after 72 h, phytoplankton biomass increased noticeably coupled with nutrient depletion in all treatments. The results of individual experiments are described in the following sections.
Variable Si supply
Experiment A
As expected, Si addition had considerable impacts on phytoplankton growth. The community was mostly dominated by the chain-forming centric diatom Chaetoceros spp. (not shown). Chl a concentrations () and specific growth rates (µChl a d–1) () showed a linear increase with increasing Si concentrations from 20 µM to 55 µM and became non-linear after that (60–200 µM Si). The increase in BSi content () was more than three times higher at 55 µM Si than at 20 µM Si (19.8 µmol–1). The ratio of BSi:Chl a increased exponentially () with increasing Si supply. Si uptake (ΔSi) () showed a significant linear correlation with increasing Si supply up to 65 µM and reached a plateau at 150 µM Si. ΔN () was inversely correlated with increasing Si supply (p < 0.05). ΔP concentrations were not related to Si concentrations () indicating that P uptake was not directly dependent on or controlled by Si supply. The ratio of ΔSi:ΔN () increased exponentially with increasing Si concentrations and was likely to be influenced by Si rather than N uptake. Likewise, the ratios of ΔP:ΔN () and ΔSi:ΔP () were also significantly correlated with external Si levels.
Fig. 3. (a) The concentrations of Chl a, (b) Chl a based growth rate (µChl a d–1), (c) the concentrations of BSi, (d) the ratios of BSi:Chl a, (e) the concentrations of net Si uptake (ΔSi), (f) the concentration of net N uptake (ΔN)and (g) net P uptake (ΔP), (h) the ratios of ΔSi:ΔN, (i) the ratios of ΔP:ΔN, (j) the ratios of ΔSi:ΔP with increasing Si supply under stable P (20 µM) and N (100 µM) concentrations in the variable Si experiment (A)
Experiment B
In this experiment, the concentrations of N and P were one-fifth of those in experiment A. There was a positive growth response with increasing Si addition. A linear increase in Chl a content was observed with increasing Si supply up to 60 µM () and this trend disappeared (R2 = 0.001) after further Si addition. The specific growth rate showed an exponential increase up to 60 µM Si () above which the correlation with increasing Si became insignificant. BSi content () and BSi:Chl a ratios () increased exponentially (R2 = 0.881; p < 0.01) with increasing Si concentrations. Net Si uptake (ΔSi) () was correlated with Si concentrations but ΔN andΔP uptake showed no significant correlation (p > 0.05) with Si concentrations (). The ratio of ΔSi:ΔN was significantly correlated with Si concentrations () whereas ΔP:ΔN ratio () showed no such trend. ΔSi:ΔP ratios () were correlated with Si concentrations. The trends of growth and nutrient uptake from experiments A and B were compared in to understand if there was any impact of different N and P supply on Si induced growth response. Surprisingly, the differences between the correlations of ΔSi (), BSi contents (), Chl a content (), and BSi:Chl a ratios () with increasing Si supply from both A and B were all non-significant (ANOVA, p < 0.05).
Fig. 4. (a) The concentrations of Chl a, (b) Chl a based growth rate (µChl a d–1), (c) the concentrations of BSi, (d) the ratios of BSi:Chl a, (e) net consumption of silicate (ΔSi), (f) net consumption of nitrate (ΔN), (g) net consumption of phosphate (ΔP), (h) the ratios of ΔSi:ΔN, (i) the ratios of ΔP:ΔN, (j) the ratios of ΔSi:ΔP with increasing Si concentrations under constant P (4 µM) and N (20 µM) concentrations in the variable Si experiment (B)
Fig. 5. The trends of ΔSi with increasing Si supply (a) up to 200 µM Si level and (b) up to 65 µM Si level. Under 100 µM and 20 µM nitrate concentrations; the trends of BSi production with increasing Si supply (c) up to 200 µM and (d) 65 µM Si concentrations in the presence of 100 µM and 20 µM nitrate; Chl a contents in relation to increasing Si supply (e) up to 200µM Si and (f) 65µM Si concentrations in the presence of 100 and 20 µM nitrate; the ratios of BSi:Chl a in relation to increasing Si supply (g) up to 200 µM and (h) 65 µM Si level under 100 µM and 20 µM nitrate addition in the variable Si experiment (A and B)
Variable P supply
Increasing P addition showed considerable impacts on phytoplankton growth dynamics. The concentrations of Chl a () increased significantly (R2 = 0.63; p < 0.001) with increasing P supply. The highest Chl a concentration occurred at 9.9 µM P and decreased slightly after further P enrichment. Chl a based growth rate () showed an exponential increase and was always >1 in all treatments. BSi concentrations () were positively correlated with P concentrations and plateaued at 9.9 µM P treatment. The ratios of BSi:Chl a () did not show any clear trend with increasing P concentrations indicating that the magnitude of enhancement was similar for both the parameters. ΔP showed good linearity (R2 = 0.96; p < 0.001) with P concentrations (). ΔSi also showed a significant linear positive relationship with P concentrations () up to 9.9 µM but was non-linear above this (). The ratio of ΔP:ΔSi showed a significant positive correlation with P concentrations (). BSi concentrations and ΔSi values were strongly correlated.
Fig. 6. (a) The concentrations of Chl a, (b) Chl a based growth rate (µChl a d–1), (c) the concentrations of BSi, (d) the ratios of BSi:Chl a, (e) net uptake of phosphate (ΔP), net uptake of silicate (ΔSi) up to (f) 10 µM P level, (g) net uptake of Si (up to 20 10 µM P addition), (h) the ratios of ΔP:ΔSi with increasing phosphate addition in the variable P experiment
HPLC pigment analyses showed the presence of five major diagnostic pigments (fucoxanthin (Fuco), chlorophyll c2 (Chl c2), diadinoxanthin (DD), diatoxanthin (DT) and β-carotene) representing diatoms. A negligible amount of zeaxanthin (Zea) was also detected. The concentrations of total pigments (TP) (), Fuco (), DT+DD () and β-carotene () showed an exponential increase with increasing P addition between 2.4 and 4.4 µM P but not above this. The lack of correlation between P concentrations and Chl c2 (), showed that chlorophyll synthesis was not directly influenced by P addition. The concentrations of Zea were very low () compared with Fuco, indicating the dominance of diatoms. Likewise, based on the diagnostic pigment concentrations, microphytoplankton () were dominant (> 98%) relative to picophytoplankton () which represented less than 1% of the community.
Fig. 7. The concentrations of (a) total pigment (TP), (b) fucoxanthin, (c) Chl c2, (d) diatoxanthin+diadinoxanthin, (e) β-carotene, (f) zeaxanthin detected in the HPLC analysis from P enrichment experiment. The relative % of (g) microphytoplankton (represents diatom) and (h) picophytoplankton (mostly cyanobacteria) calculated based on the diagnostic pigment concentrations detected in HPLC pigment analysis
Variable N supply
Increasing N supply had a significant impact on the growth and community structure of coastal phytoplankton. Chl a concentration (), specific growth rate () and the concentrations of total protein () and BSi () increased with increasing N additions (p < 0.05). The ratio of BSi:Chl a () showed a negative exponential correlation with increasing N concentrations suggesting that the relative enhancement in Chl a was significantly higher than BSi production. ΔN concentrations showed linearity with N concentrations (). ΔP () and ΔSi () increased in response to increasing N supply. The ratio of ΔN:ΔSi () showed an exponential increase with increasing N supply, suggesting that ΔSi increased when the N supply enhanced. A positive exponential trend was noticed with increasing N concentrations and ΔP:ΔSi uptake ().
Fig. 8. The concentrations of (a) Chl a, (b) Chl a based growth rate (µChl a d–1), the concentration of (c) total protein, (d) BSi, (e) the ratios of BSi:Chl a, net depletion (Δ) of (f) nitrate (N), (g) phosphate (P) and (h) silicate (Si), the ratios of (i) ΔN:ΔSi and (j) ΔP:ΔSi in response to increasing nitrate supply (values = average ± SD; n = 2)
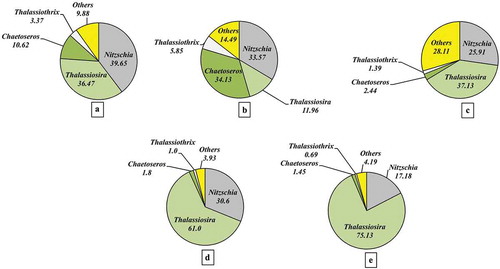
HPLC showed that Fuco was the major (>95%) diagnostic pigment with very little Zea. Total pigment (TP) (including Chl a) (), Fuco (), Chl c2 (), DD+DT (), β-carotene () and Zea () increased exponentially with increasing N supply. However, chlorophyll content (Chl a and Chl c2) increased more than carotenoid in response to increasing N supply. Based on the diagnostic pigments, micro-phytoplankton () represented 95–98% of the community and showed exponential growth enhancement with increasing nitrogen supply. Zea-containing picophytoplankton were <5% of the community () and decreased exponentially with increasing nitrogen supply. Microscopic analysis of the phytoplankton community in terms of relative abundance is presented in . The initial community (stock culture) was dominated by the centric diatoms Thalassiosira spp. (36%) and Chaetoceros spp. (10.6%) along with pennate diatoms Nitzschia spp. (≈ 40%) and Thalassiothrix spp. (3.3%). Over the experimental period, the community structure changed significantly; increasing N addition significantly impacted the community composition. The relative abundance of Thalassiosira spp. was 12% in the first treatment and increased exponentially with increasing N supply and consisted of almost 75% of the community at the highest N value. Nitzschia spp. (~30%) did not differ significantly among the three lower N concentrations and was reduced by half at the highest, 64 µm nitrate. Similarly, Chaetoceros spp. abundance increased 3-fold at the lowest level of N enrichment () and decreased to <2% at the highest level. At the highest nitrate level, Thalassiothrix spp. decreased to <1% from an initial abundance of 3.4%.
Fig. 9. The concentrations of (a) total pigment (TP), (b) fucoxanthin, (c) Chl c2, (d) diatoxanthin+diadinoxanthin, (e) β-carotene, (f) zeaxanthin detected in the HPLC analysis of the pigment extracts of nitrate enrichment experiment. The relative % of (g) micro-phytoplankton (diatoms) and (h) picophytoplankton (mostly cyanobacteria) calculated based on the diagnostic pigment concentrations detected in HPLC pigment analysis (values = average ± SD; n = 2)
Fig. 10. The relative abundance of different diatom species in nitrate enrichment experiment. (a) The community composition of the initial phytoplankton stock; the community compositions at (b) 14 µM, (c) 24 µM, (d) 34 µM and (e) 64 µM nitrate
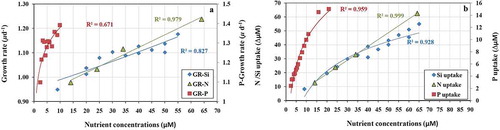
An overview of the effect of enrichment of N, Si and P on the growth and nutrient uptake of the experimental phytoplankton communities is presented as a combined plot (). The first panel () depicts the maximum growth rates under different nutrient enrichments. Nitrate enrichment of 65 µM showed the highest overall growth response and increasing linearly. Growth increased up to the maximum Si enrichment (55 µM) and growth rate increased with P enrichment up the highest level, ~10 µM. P uptake continued up to the maximum level of P ().
Fig. 11. Growth and nutrient uptake rates (Δ) from all experiments. The first panel represents (a) the maximum growth rates for all three nutrients up to the growth saturating nutrient concentrations. The second panel represents (b) the ‘luxury’ uptake for all nutrients after the growth-saturating phase before reaching the plateau. Three different colour codes have been used to denote P (red square), N (green triangle) and Si (blue diamond)
Nutrient removal potential of phytoplankton
Nutrient removal rates were calculated per unit biomass (μg Chl a) per day from all experiments (). The maximum Si removal rate noted in the first experiment was 1.51 µmol μg Chl a–1 d–1 at 65 µM Si level. This rate decreased almost 5 times at the lowest Si concentration (7.2 times lower). Increasing N and P addition (Si concentrations in both the experiments were 100 µM) revealed Si removal rates of 1.22 ± 0.29 µmol μg Chl a–1 day–1 and 1.32 ± 0.65 µmol μg Chl a–1 day–1, respectively. P removal rates were 0.11 ± 0.02 and 0.15 ± 0.02 µmol μg Chl a–1 day–1 in variable Si supply (A and B respectively), and this was corresponding to an increase of 1.36 times in response to 5 times increase in P supply. P removal rate recorded in the nitrogen enrichment experiment was 0.086 ± 0.02 µmol P μg Chl a–1 day–1 under 10 µM P. The same rate showed a value of 0.05 ± 0.01 µmol P μg Chl a–1 day–1 at 4 µM P level and increased more than 3 times (0.16 µmol P μg Chl a–1 day–1) at the last three treatments (highest concentrations). This suggested that an enhancement in P supply by 4 times correspondended to a 3-fold increase in the P removal rate by phytoplankton. The average N removal rate (0.49 ± 0.08 µmol μg Chl a–1 day–1) increased almost 2.5 times (1.22 ± 0.22 µmol μg Chl a–1 day–1) in response to 5 times increase in N supply. The maximum N removal rate in relation to increasing N addition was 0.84 µmol μg Chl a–1 d–1 seen at 34 µM N level and the other values did not differ significantly. Since Chl a synthesis is closely associated with N availability, the rate of N removal per unit Chl a may deviate from a linear trend. We have taken the maximum N, Si and P removal rates from the saturated concentrations and averaged to get a number that can be used for eutrophic condition. N, Si and P removal rates were 1.03 ± 0.27, 1.35 ± 0.14 and 0.14 ± 0.02 µmol μg Chl a–1 d–1, respectively (). These revealed a ratio of 7.5:9.8:1 for N:Si:P removal rates under a nutrient saturated condition for the coastal BoB.
Table 1. The values of maximum nutrient uptake concentrations of each nutrient, their growth saturating concentrations as noticed in the present experiment, maximum nutrient uptake rates and the average nutrient removal rates from all experiments (± SD)
Discussion
Community response
The coastal waters of BoB are usually dominated by diatoms (Bandyopadhyay et al., Citation2017; Bharathi et al., Citation2018), as was found here in the experimental communities (variable P and N supply). The coast of BoB receives a significant amount of land runoff and river discharge during the SW monsoon (>70% of annual discharge to the BoB) and diatom blooms occur in association with increased rainfall, land runoff and Si enrichment (Biswas et al., Citation2010; Shaik et al., Citation2017; Bandyopadhyay et al., Citation2017). Bharathi & Sharma (Citation2019) found that the phytoplankton biomass and community composition of 28 major and minor Indian estuaries was controlled by monsoonal river discharge. The Si enrichment is likely to be responsible for the dominance of diatoms in the coastal BoB.
The low quantity of cyanobacteria (pico-phytoplankton) we found can be related to the highly efficient nutrient storage capacity of diatoms compared with cyanobacteria. Diatoms usually dominate under nitrate replete conditions, whereas ammonia enrichment promotes cyanobacterial growth (Berg et al., Citation2003). Since Si concentrations were at saturated concentrations, non-siliceous smaller phytoplankton like cyanobacteria probably could not compete with diatoms. However, pigment-based community analysis does not provide the detail of species-specific changes in the community and hence microscopic analysis is needed.
During the first experiment, the phytoplankton community was mostly dominated by the chain-forming centric diatom Chaetoceros spp. (data are not shown here) which takes up dissolved silicate more efficiently and at a much faster rate than other large diatoms such as Rhizosolenia (Tréguer et al., Citation1991). Tantanasarit et al. (Citation2013) observed very high Si consumption along with N and P uptake in Chaetoceros calcitrans under nutrient replete conditions. This is probably why Chaetoceros is one of the most commonly occurring diatoms in coastal BoB (Bharathi et al., Citation2018). Shaik et al. (Citation2017) found that high phytoplankton biomass dominated by Chaetoceros spp. (57%) was associated with low salinity Si-enriched conditions (~12 µM) during the late post-monsoon season (December). During the pre-monsoon season (March), Si level decreased leading to a significant reduction in Chaetoceros spp. coupled with increased abundance of pennate diatoms (Nitzschia spp.), possibly related to the higher surface area to volume ratio which allows them to take up Si at very low concentrations. Burson et al. (Citation2018) observed a similar trend in a coastal phytoplankton community. Not all diatoms are equally efficient in nutrient consumption and storage so when nutrient concentrations become exhausted by plankton growth, certain species benefit from their higher nutrient storage efficiency. This characteristic feature finally shapes a community.
In shallow coastal waters, phytoplankton community structure can be linked to the N budget (Philippart et al. Citation2000). Our nitrate enrichment experiment revealed a similar trend. Biswas et al. (Citation2010) found that phytoplankton community structure in diatom-dominated assemblages from a Si enriched mangrove water (north-east coast of BoB) was significantly correlated with N:P loading (related to rainfall pattern and tidal cycles). The species-specific response of phytoplankton to certain nutrient limitation or enrichment plays a key role in configuring the community structure (Lagus et al., Citation2004). The intracellular nutrient pool for a particular nutrient can be highly variable within diatoms and shape nutrient uptake kinetics and species dominance. The increasing abundance of Thalassiosira spp. in response to nitrate enrichment coupled with decreased Chaetoceros spp. indicated that the competitive efficiency of consuming nitrate under Si and P replete conditions was higher in Thalassiosira than Chaetoceros
Diatoms can take up and store a significantly higher amount of N than their requirement (Lomas & Glibert, Citation2000). Li & Campbell (Citation2017) found that a smaller coastal diatom (Thalassiosira sp.), that grew faster and had enhanced protein content per cell in response to N enrichment, outcompeted a larger diatom with a slower growth rate. Thalassiosira showed non-saturating uptake kinetics when growing at 50 µM nitrate in a natural phytoplankton assemblage from a coastal lagoon (Colls et al., Citation1997Citation1997), whereas Chaetoceros spp. reached saturation (Michaelis–Menten type) very quickly, directly related to their internal nutrient pool capacity. This observation is in good agreement with our results and explains why there was an increasing abundance of Thalassiosira spp. with a concomitant decrease in Chaetoceros at 65 µM nitrate. The high nitrate uptake potential of Thalassiosira can provide a competitive advantage, which is probably why it is one of the most abundant diatom genera in the coastal BoB during the SW monsoon (Bharathi et al., Citation2018).
Physiological response: growth and nutrient removal
Diatoms are well known for (1) responding quickly to nutrient pulses and (2) luxury nutrient uptake (Paasche et al., Citation1973; Tilman & Kilham, Citation1976; Harrison et al., Citation1989). A similar trend was observed in the present study. The Si uptake rate at the highest Si level, 65 µM was five times greater than at the lowest concentration, suggesting that upon 7 times enhancement in Si supply in this coastal water (particularly during the monsoon), phytoplankton may increase their Si removal rate by 5 times. Moreover, as mentioned earlier, the average Si concentrations seen in the estuarine waters of Ganges and Godavari (Biswas et al., Citation2004, Citation2010; Mukhopadhyay et al., Citation2006; Sarma et al., Citation2010) were also ~60 µM and very close to the growth saturating concentration of Si (55 µM) observed in this experiment.
Chemostat experiments have predicted three types of Si uptake and Si dependent growth patterns for diatoms (Conway et al., Citation1976; Hildebrand & Wetherbee, Citation2003): (1) surge uptake when Si starved cells were resupplied with sufficient Si; (2) Si uptake controlled by the external Si concentrations; and (3) Si uptake dependent on the rate of Si incorporation in the diatom cell wall. In our experiments, the cells were not Si starved, but likely to be Si limited after the exponential growth phase in the stock culture. This may lead to a linear increase in ΔSi and Si removal rate with increasing Si supply beyond the growth-saturating Si level (55 µM). After the exponential growth phase, ΔSi reached a plateau showing the difference in Si consumption during an exponential and stabilized growth phase. This excess Si uptake after the growth-saturating phase can be attributed to ‘luxury’ consumption. According to Droop (Citation1974), ‘luxury’ consumption is the ratio of the cell quota for a particular nutrient under nutrient limitation and nutrient replete condition. The observed increase in the concentrations of Chl a and BSi along with BSi:Chl a ratios up to 65 µM Si level suggested that during this phase Si was probably used for cell division and growth, whereas further Si enrichment did not show such linearity and perhaps the uptake was ‘luxury’ at this stage. Above growth-saturating Si concentrations, the Si removal rate also stabilized. A similar trend was seen in the growth rate, ΔSi and BSi contents in response to increasing Si supply during a natural diatom bloom (Kristinasen et al., Citation2004). Further, the results also revealed that when other nutrients (P and N) are not growth-limiting, there could be a luxury uptake of the third nutrient (Si). The difference in N and P contents between the two sets of Si enrichment experiments did not impact BSi formation. This suggested that BSi production was mainly controlled by Si enrichment and the rate of silica incorporation in the cell wall was independent of nitrogen supply when N is not limiting. Unlike nitrogen metabolism, which needs a reductant from photosynthesis, Si metabolism can go ahead independently (Martin‐Jézéquel et al., Citation2000).
Si is obligatory for diatom growth (Brzezinski & Conley, Citation1994) and Si starvation results in the complete cessation of cell division (Werner, Citation1977). Si has a specific feature that dissolved Si molecules polymerize when internal Si concentrations exceed 2 mM. Thamatrakoln & Hildebrand (Citation2008) conducted a study on the Si uptake rates in multiple marine diatoms and showed that initially Si uptake was non-saturating and became saturating above a certain level. This observation is comparable to our results. Further, the authors concluded that Si uptake can be directly dependent on the intracellular Si pool capacity which varies depending on the growth phase. During the high pool capacity, the non-saturating uptake kinetics can be seen. With decreasing intracellular Si pool size, saturation occurs above a certain Si level. In our Si enrichment experiments, it was close to 50–60 µm Si concentrations where the community showed a saturating uptake and hence, a further increase in Si supply did not impact growth.
ΔP values and P removal rates per unit biomass per day were tightly coupled with increasing P concentrations and showed a non-saturating uptake kinetic. Tilman & Kilham (Citation1976) showed that diatoms can take up 6–8 times higher P than required for growth. Usually, they store P as P-rich nucleic acid. The average P removal rate at the levels usually seen in this coastal water was 0.05 µmol μg Chl a–1 day–1. This value tripled at the highest P concentration suggesting that an increase in P loading with N and Si levels are sufficient is likely to increase P removal efficiency. Enhanced growth of a coastal phytoplankton community in response to P enrichment is well known (Duarte et al., Citation2000); under N and Si replete conditions, P deficiency can hamper phytoplankton growth and efficient utilization of those nutrients. Any additional supply of P in coastal waters can be efficiently removed by phytoplankton followed by a conversion of inorganic to organic P or dissolved to particulate P. ΔSi was coupled with increasing P level within the growth-saturating level (up to 10 µM P); further, increase in ΔP was probably due to ‘luxury’ consumption and therefore ΔSi values were decoupled. Increased BSi contents with increasing P was mostly due to increased cell division rates confirmed by the non-linearity of BSi:Chl a ratio with P concentrations. ΔP:ΔSi ratios were well correlated with P concentrations and this was likely to be influenced by P uptake kinetics, rather than ΔSi. When Si is limiting, Si transport by diatoms can be active and show a correlation with P concentrations since P is utilized for ATP production. In the present study, Si was not limiting, and hence the diffusive Si uptake seemed to be the key process of Si transport inside the cell.
The types of inorganic N forms supplied to phytoplankton are a key factor that controls the phytoplankton community structure (Glibert et al., Citation2016). Nitrate was seen to be the preferred inorganic nitrogen species for diatoms, whereas cyanobacteria favoured ammonia (Berg et al., Citation2003). The observed insignificant correlation between Zea and nitrate concentrations also supports this view. However, there is a considerable knowledge gap regarding our understanding of phytoplankton response to the ‘excess N‘ supply when present at saturated concentrations (Glibert et al., Citation2014, , Citation2016). Our study revealed that like Si and P, diatoms can show ‘luxury’ uptake of nitrate even when a system is not nitrate limited. Similarly, Mackey et al. (Citation2014) noticed in the Californian upwelling system that diatoms showed significantly high nitrate (10 µM) consumption when nitrate was not limiting (13–30 µM). Interestingly, the highest N removal rate was not seen at the highest N supply and N removal rates with increasing N supply were not significantly different (<10%) between the treatments. This could be because Chl a synthesis is directly linked to N quota of the cell and therefore, normalizing Chl a with can be biased. When the magnitude of increase in N uptake and Chl a synthesis are almost similar, the rates are likely to be invariable. However, N induced growth rate can be coupled only up to the growth-saturating concentrations of nitrate, and after that the uptake seemed to be ‘luxury’.
The exponential increase in Chl a content confirms that the photosynthetic rate increased in response to increased nitrogen supply. The linearity between ΔN concentrations and protein contents confirmed that increasing N supply accelerated N metabolism in the presence of sufficient organic carbon. The ratios of ΔSi:ΔN also suggested that under N enriched condition, the relative uptake of N was higher than Si and hence a decreasing trend was noticed with increasing N addition. In a recent study by Alipanah et al. (Citation2015), it was noticed that when N starved diatom cells were supplemented with N, the gene expressions responsible for photosynthesis, carbohydrate metabolism, protein and chlorophyll synthesis were enhanced. In the first part of the Si enrichment experiment, the inverse correlation between ΔN and Si concentrations explains higher Si uptake rates over N in response to increasing Si addition. However, unlike Si, the growth-saturating and the highest N uptake concentrations occurred at ~65 µM. High requirement of N in cellular metabolism is likely to be responsible for such a trend.
The observed enhancement in Chl a and Chl c2 in response to N enrichment suggested close coupling between N supply and chlorophyll synthesis (Harvey, Citation1953). But the carotenoids such as Fuco, Zea and DD+DT did not show linearity with increasing N supply, because their syntheses is independent of N supply. Decreased value of BSi:Chl a ratios were probably due to the higher magnitude of enhancement in Chl a relative to BSi in response to N enrichment. In the P enrichment experiment, an initial exponential increase in Chl a, β-carotene and Fuco was mostly correlated to general growth enhancement. This trend was not seen after 4.4 µM P addition and suggested that probably after this concentration, P was not used in pigment synthesis related processes.
The coast of BoB is likely to become more eutrophic with increasing population density and agricultural activities, and more tropical cyclones in this Bay may potentially impact its nutrient stoichiometry (Balaguru et al., Citation2014). Nutrient removal efficiencies of coastal phytoplankton are high and justify their role as a filter for eutrophicated coastal waters. In case of any additional nutrient pulse in this coastal water, diatoms will be the major group to respond immediately and may consume nutrients without following the Redfield ratio. If N is added to this coastal water in the form of nitrate under Si replete conditions, diatoms will be the winners and may efficiently suppress cyanobacterial growth. Reduction in Si supply and an increase in ammonia may reverse the situation. Any such change in the phytoplankton community in response to nutrient stoichiometry will have immediate impacts on the food chain. Considering the future scenario it is likely that aggressive nutrient consumption by coastal phytoplankton will also alter the elemental stoichiometry of organic matter and this may be further transmitted to higher trophic levels. Moreover, organic matter sinking to the sediment will also have impacts on the benthic community. However, the lack of microscopic analyses from Si and P enrichment experiments limits comments on phytoplankton species-specific responses. More experimental studies are essential in order to predict future changes in the phytoplankton community and their consequences for coastal water health and ecosystem services. Finally, coastal waters are also experiencing warming and low pH, which may exert further impacts on the phytoplankton community. Therefore, a multi-stressor approach should be considered in any future study.
Author contributions
D. Bandyopadhyay: experimenting, all laboratory analyses, preparing the figures and drafting the manuscript; H. Biswas: original idea of the experiments, experimenting, editing and finalizing the manuscript.
Acknowledgements
The first author is grateful to the Council of Scientific and Industrial Research (CSIR) for financial support. The kind support and cooperation provided by the Director, CSIR-NIO, and Scientist-In-Charge, Regional Centre, NIO, Visakhapatnam is also acknowledged. All colleagues from Regional Centre, Visakhapatnam are gratefully acknowledged for their active cooperation and help during the study. (NIO contribution number for this publication is 6585.
Disclosure statement
No potential conflict of interest was reported by the authors
Additional information
Funding
References
- Alipanah, L., Rohloff, J., Winge, P., Bones, A.M. & Brembu, T. (2015). Whole-cell response to nitrogen deprivation in the diatom Phaeodactylum tricornutum. Journal of Experimental Botany, 66: 6281–6296.
- Amo, Y.D. & Brzezinski, M.A. (1999). The chemical form of dissolved Si taken up by marine diatoms. Journal of Phycology, 35: 1162–1170.
- Balaguru, K., Taraphdar, S., Leung, L.R. & Foltz, G.R. (2014). Increase in the intensity of postmonsoon Bay of Bengal tropical cyclones. Geophysical Research Letters, 41: 3594–3601.
- Bandyopadhyay, D., Biswas, H. & Sarma, V.V.S.S. (2017). Impacts of SW monsoon on phytoplankton community structure along the western coastal BOB: an HPLC approach. Estuaries and Coasts, 40: 1066–1081.
- Berg, G.M., Balode, M., Purina, I., Bekere, S., Béchemin, C. & Maestrini, S.Y. (2003). Plankton community composition in relation to availability and uptake of oxidized and reduced nitrogen. Aquatic Microbial Ecology, 30: 263–274.
- Bharathi, M.D., & Sarma, V.V.S.S. (2019). Impact of monsoon-induced discharge on phytoplankton community structure in the tropical Indian estuaries. Regional Studies in Marine Science, 31: 100795.
- Bharathi, M.D., Sarma, V.V.S.S., Ramaneswari, K. & Venkataramana, V. (2018). Influence of river discharge on abundance and composition of phytoplankton in the western coastal Bay of Bengal during peak discharge period. Marine Pollution Bulletin, 133: 671–683.
- Biswas, H., Dey, M., Ganguly, D., De, T.K., Ghosh, S. & Jana, T.K. (2010). Comparative analysis of phytoplankton composition and abundance over a two-decade period at the land–ocean boundary of a tropical mangrove ecosystem. Estuaries and Coasts, 33: 384–394.
- Biswas, H., Mukhopadhyay, S.K., De, T.K., Sen, S. & Jana, T.K. (2004). Biogenic controls on the air–water carbon dioxide exchange in the Sundarban mangrove environment, northeast coast of Bay of Bengal, India. Limnology and Oceanography, 49: 95–101.
- Biswas, H., Shaik, A.U.R., Bandyopadhyay, D. & Chowdhury, N. (2017). CO2 induced growth response in a diatom dominated phytoplankton community from SW Bay of Bengal coastal water. Estuarine and Continental Shelf Research, 198: 29–42.
- Boesch, D.F. (2019). Barriers and bridges in abating coastal eutrophication. Frontiers in Marine Science, 6: 123.
- Brembu, T., Mühlroth, A., Alipanah, L. & Bones, A.M. (2017). The effects of phosphorus limitation on carbon metabolism in diatoms. Philosophical Transactions of the Royal Society B: Biological Sciences, 372: 20160406.
- Brzezinski, M.A. (1985). The Si: C: N ratio of marine diatoms: Interspecific variability and the effect of some environmental variables, Journal of Phycology, 21: 347–357.
- Brzezinski, M.A. & Conley, D.J. (1994). Silicon deposition during the cell cycle of Thalassiosira weissflogii (Bacillariophyceae) determined using dual rhodamine and propidiumiodide. Journal of Phycology, 30: 45–55.
- Burson, A., Stomp, M., Akil, L., Brussaard, C.P. & Huisman, J. (2016). Unbalanced reduction of nutrient loads has created an offshore gradient from phosphorus to nitrogen limitation in the North Sea. Limnology and Oceanography, 61: 869–888.
- Burson, A., Stomp, M., Greenwell, E., Grosse, J., & Huisman, J. (2018). Competition for nutrients and light: testing advances in resource competition with a natural phytoplankton community. Ecology, 99: 1108–1118.
- Chen, N., Wu, Y., Wu, J., Yan, X. and Hong, H. (2014). Natural and human influences on dissolved silica export from watershed to coast in Southeast China. Journal of Geophysical Research: Biogeosciences, 119: 95–109.
- Cira, E.K., Paerl, H.W. & Wetz, M.S. (2016). Effects of nitrogen availability and form on phytoplankton growth in a eutrophied estuary (Neuse River Estuary, NC, USA). PLoS ONE, 11: e0160663.
- Collos, Y., Vaquer, A., Bibent, B., Slawyk, G., Garcia, N., & Souchu, P. (1997). Variability in nitrate uptake kinetics of phytoplankton communities in a Mediterranean coastal lagoon. Estuarine, coastal and shelf science, 44(3): 369–375.
- Conley, D.J. & Malone, T.C. (1992). Annual cycle of dissolved silicate in Chesapeake Bay: implications for the production and fate of phytoplankton biomass. Marine Ecology Progress Series, 81: 121–128.
- Conway, H.L., Harrison, P.J. & Davis, C.O. (1976). Marine diatoms grown in chemostats under silicate or ammonium limitation. II. Transient response of Skeletonema costatum to a single addition of the limiting nutrient. Marine Biology, 35: 187–199.
- Davidson, K. & Gurney, W.S.C. (1999). An investigation of non steady state algal growth II. Mathematical modelling of co-nutrient limited algal growth. Journal of Plankton Research, 21: 839–858.
- Droop, M.R. (1974). The nutrient status of algal cells in continuous culture. Journal of the Marine Biological Association of the United Kingdom, 54: 825–855.
- Duarte, C.M., Agusti, S. and Agawin, N.S. (2000). Response of a Mediterranean phytoplankton community to increased nutrient inputs: a mesocosm experiment. Marine Ecology Progress Series, 195: 61–70.
- Gao, C. & Zhang, T. (2010). Eutrophication in a Chinese context: understanding various physical and socio-economic aspects. Ambio, 39: 385–393.
- Garnier, J., Beusen, A., Thieu, V., Billen, G. & Bouwman, L. (2010). N: P: Si nutrient export ratios and ecological consequences in coastal seas evaluated by the ICEP approach. Global Biogeochemical Cycles, 24: GB0A05, 1–12.
- Girishkumar, M.S., Thangaprakash, V.P., Udaya Bhaskar, T.V.S., Suprit, K., Sureshkumar, N., Baliarsingh, S.K., Jofia, J., Vimlesh P., Vishnu, S., George, G., Abhilash, K.R., Shivaprasad, S. & Abhilash, K.R. (2019). Quantifying tropical cyclone’s effect on the biogeochemical processes using profiling float observations in the Bay of Bengal. Journal of Geophysical Research: Oceans, 124: 1945–1963.
- Glibert, P.M., Maranger, R., Sobota, D.J. & Bouwman, L. (2014). The Haber Bosch–harmful algal bloom (HB–HAB) link. Environmental Research Letters, 9: 105001.
- Glibert, P.M., Wilkerson, F.P., Dugdale, R.C., Raven, J.A., Dupont, C.L., Leavitt, P.R. & Kana, T.M. (2016). Pluses and minuses of ammonium and nitrate uptake and assimilation by phytoplankton and implications for productivity and community composition, with emphasis on nitrogen‐enriched conditions. Limnology and Oceanography, 61: 165–197.
- Harrison, P.J., Parslow, J.S. & Conway, H.L. (1989). Determination of nutrient uptake kinetic parameters: a comparison of methods. Marine Ecology Progress Series, 52: 301–312.
- Harvey, H.W. (1953). Synthesis of organic nitrogen and chlorophyll by Nitzschiaclosterium. Journal of the Marine Biological Association of the United Kingdom, 31: 477–487.
- Hildebrand, M. & Wetherbee, R. (2003). Components and control of silicification in diatoms. In Silicon Biomineralization, 11–57. Springer, Berlin.
- Jeffrey, S.W. & Vesk, M. (1997). Introduction to marine phytoplankton and their pigment signature. In Plankton Pigment in Oceanography (Jeffrey, S.W., Mantoura, R.F.C. & Wright, S.W., editors), 37–84. UNESCO, Geneva.
- Kristiansen, S., Farbrot, T. & Naustvoll, L.J. (2004). Production of biogenic silica by spring diatoms. Limnology and Oceanography, 45: 472–478.
- Lagus, A., Suomela, J., Weithoff, G., Heikkilä, K., Helminen, H. & Sipura, J. (2004). Species-specific differences in phytoplankton responses to N and P enrichments and the N: P ratio in the Archipelago Sea, northern Baltic Sea. Journal of Plankton Research, 26: 779–798.
- Laruelle, G.G., Roubeix, V., Sferratore, A., Brodherr, B., Ciuffa, D., Conley, D.J., Dürr, H.H., Garnier, J., Lancelot, C., Le Thi Phuong, Q. & Meunier, J.D. (2009). Anthropogenic perturbations of the silicon cycle at the global scale: Key role of the land‐ocean transition. Global Biogeochemical Cycles, 23: GB4031, 1–17.
- Li, G. & Campbell, D.A. (2017). Interactive effects of nitrogen and light on growth rates and RUBISCO content of small and large centric diatoms. Photosynthesis Research, 131: 93–103.
- Litchman, E., Klausmeier, C.A., Schofield, O.M. and Falkowski, P.G. (2007). The role of functional traits and trade-offs in structuring phytoplankton communities: scaling from cellular to ecosystem level. Ecology Letters, 10(12): 1170–1181
- Lomas, M.W. & Glibert, P.M. (2000). Comparisons of nitrate uptake, storage, and reduction in marine diatoms and flagellates. Journal of Phycology, 36: 903–913.
- Lowry, O.H., Rosebrough, N.J., Farr, A.L., & Randall, R. J. (1951). Protein measurement with the Folin phenol reagent. Journal of Biological Chemistry, 193, 265–275
- Luo, Z., Hu, S., & Chen, D. (2018). The trends of aquacultural nitrogen budget and its environmental implications in China. Scientific Reports, 8(1): 1–9.
- Mackey, K.R., Chien, C.T. & Paytan, A. (2014). Microbial and biogeochemical responses to projected future nitrate enrichment in the California upwelling system. Frontiers in Microbiology, 5: 632.
- Martin, G.D., Jyothibabu, R., Madhu, N.V., Balachandran, K.K., Nair, M., Muraleedharan, K.R., Arun, P.K., Haridevi, C.K. and Revichandran, C. (2013). Impact of eutrophication on the occurrence of Trichodesmium in the Cochin backwaters, the largest estuary along the west coast of India. Environmental Monitoring and Assessment, 185(2): 1237–1253.
- Martin‐Jézéquel, V., Hildebrand, M. and Brzezinski, M.A. (2000). Silicon metabolism in diatoms : implications for growth. Journal of Phycology, 36(5): 821–840.
- Martiny, A.C., Pham, C.T., Primeau, F.W., Vrugt, J.A., Moore, J.K., Levin, S.A. & Lomas, M.W. (2013). Strong latitudinal patterns in the elemental ratios of marine plankton and organic matter. Nature Geoscience, 6: 279–283.
- Moore, C.M., Mills, M.M., Arrigo, K.R., Berman-Frank, I., Bopp, L., Boyd, P.W., Galbraith, E.D., Geider, R.J., Guieu, C., Jaccard, S.L. and Jickells, T.D., (2013). Processes and patterns of oceanic nutrient limitation. Nature Geoscience, 6(9): 701–710.
- Mukhopadhyay, S.K., Biswas, H., De, T.K. & Jana, T.K. (2006). Fluxes of nutrients from the tropical River Hooghly at the land–ocean boundary of Sundarbans, NE Coast of Bay of Bengal, India. Journal of Marine Systems, 62: 9–21.
- Paasche, E. (1973). Silicon and the ecology of marine plankton diatoms. II. Silicate-uptake kinetics in five diatom species. Marine Biology. 19(3): 262–269.
- Philippart, C.J., Cadée, G.C., van Raaphorst, W. and Riegman, R. (2000). Long-term phytoplankton-nutrient interactions in a shallow coastal sea: Algal community structure, nutrient budgets, and denitrification potential. Limnology and Oceanography, 45(1): 131–144.
- Piehler, M.F., Twomey, L.J., Hall, N.S. and Paerl, H.W. (2004). Impacts of inorganic nutrient enrichment on phytoplankton community structure and function in Pamlico Sound, NC, USA. Estuarine, Coastal and Shelf Science, 61(2): 197–209.
- Rabalais, N.N., Turner, R.E., Díaz, R.J., & Justić, D. (2009). Global change and eutrophication of coastal waters. ICES Journal of Marine Science, 66(7): 1528–1537.
- Ramesh, R., Robin, R.S. and Purvaja, R. (2015). An inventory on the phosphorus flux of major Indian rivers. Current Science, (00113891): 108(7).
- Ramesh, R., Selvam, A.P., Robin, R.S., Ganguly, D., Singh, G. and Purvaja, R. (2017). Nitrogen Assessment in Indian Coastal Systems. In The Indian nitrogen assessment: Sources of reactive nitrogen, environmental and climate effects, management options, and policies, 361–379. Elsevier, Netherlands.
- Redfield, A.C. (1958). The biological control of chemical factors in the environment. American Scientist, 46: 230A–221.
- Sarma, V.V.S.S., Prasad, V.R., Kumar, B.S.K., Rajeev, K., Devi, B.M.M., Reddy, N.P.C., Sarma, V.V. & Kumar, M.D. (2010). Intra-annual variability in nutrients in the Godavari estuary, India. Continental Shelf Research, 30: 2005–2014.
- Sattar, M.A., Kroeze, C. & Strokal, M. (2014). The increasing impact of food production on nutrient export by rivers to the Bay of Bengal 1970–2050. Marine Pollution Bulletin, 80: 168–178.
- Schelske, C.L., Stoermer, E.F., Conley, D.J., Robbins, J.A. & Glover, R.M. (1983). Early eutrophication in the lower Great Lakes. Science, 222: 320–322.
- Shaik, A.U.R., Biswas, H., Babu, N.S., Reddy, N.P.C., & Ansari, Z.A. (2017). Investigating the impacts of treated effluent discharge on coastal water health (Visakhapatnam, SW coast of Bay of Bengal, India). Environmental Monitoring and Assessment, 189(12): 643.
- Smayda, T.J. (1990). Novel and nuisance phytoplankton blooms in the sea: evidence for a global epidemic. In Toxic Marine Phytoplankton (Granéli, E., Sundström, B., Edler, L. & Andorson, D.M., editors), 29–40. Elsevier, New York.
- Strickland, J.D. & Parsons, T.R. (1972). A Practical Handbook of Seawater Analysis. Fisheries Research Board of Canada, Ottawa.
- Subramanyan, R. (1959). Studies on the phytoplankton of west coast of India. Part II. Proceedings of Indian Academy of Science, 50, 189–252.
- Tantanasarit, C., Englande, A.J., & Babel, S. (2013). Nitrogen, phosphorus and silicon uptake kinetics by marine diatom Chaetoceros calcitrans under high nutrient concentrations. Journal of Experimental Marine Biology and Ecology, 446: 67–75.
- Thamatrakoln, K., & Hildebrand, M. (2008). Silicon Uptake in Diatoms Revisited: A Model for Saturable and Nonsaturable Uptake Kinetics and the Role of Silicon Transporters. Plant physiology, 146(3), 1397–1407.
- Tilman, D. & Kilham, S.S. (1976). Phosphate and silicate growth and uptake kinetics of the diatoms Astorionella formosa and Cyclotella meneghiniana in batch and semicontinous culture. Journal of Phycology, 12: 375–383.
- Tréguer, P. & Van Bennekom, A.J. (1991). The annual production of biogenic silica in the Antarctic Ocean. Marine Chemistry, 35: 477–487.
- Turner, R.E., Rabalais, N.N. & Justic, D. (2006). Predicting summer hypoxia in the northern Gulf of Mexico: riverine N, P, and Si loading. Marine Pollution Bulletin, 52: 139–148.
- Tyrrell, T. (1999). The relative influences of nitrogen and phosphorus on oceanic primary production. Nature, 400: 525–531.
- Van Heukelem, L. & Thomas, C.S. (2001). Computer-assisted high-performance liquid chromatography method development with applications to the isolation and analysis of phytoplankton pigments. Journal of Chromatography A, 910: 31–49.
- Vidussi, F., Claustre, H., Manca, B.B., Luchetta, A. & Marty, J.C. (2001). Phytoplankton pigment distribution in relation to upper thermocline circulation in the eastern Mediterranean Sea during winter. Journal of Geophysical Research: Oceans, 106: 19939–19956.
- Werner, D. (1977). Silicate metabolism. The Biology of Diatoms, 13: 111–149.
- Yool, A. & Tyrrell, T. (2003). Role of diatoms in regulating the ocean’s silicon cycle. Global Biogeochemical Cycles, 17: 1–14.
- Zhou, M.J., Shen, Z.L. & Yu, R.C. (2008). Responses of a coastal phytoplankton community to increased nutrient input from the Changjiang (Yangtze) River. Continental Shelf Research, 28: 1483–1489.