Abstract
We studied whether regulated exocytosis affects the glutamate transporter density in cultured astrocytes, in which the expression of a fluorescently labeled excitatory amino acid transporter 2 (EAAT2-EGFP) predominantly labeled the plasma membrane. The addition of ionomycin that elevates cytosolic Ca2+ strongly increased the fluorescence of FM 4-64 membrane area dye, confirming the presence of regulated exocytosis in transfected astrocytes. However, concomitant with Ca2+-dependent FM 4-64 fluorescence increase, ionomycin induced a significant steady-state decrease in EAAT2-EGFP fluorescence. This is likely due to a secondary inner filter effect since,(i) in the absence of FM 4-64, ionomycin stimulation was ineffective in changing the EAAT2-EGFP fluorescence, and (ii) fluorescence changes in FM 4-64 and EAAT2-EGFP were inversely correlated. To test whether subcellular EAAT2-EGFP structures are translocated from the cytoplasm to the plasma membrane during ionomycin stimulation, EAAT2-EGFP fluorescence was monitored locally at the plasma membrane and a few microns away in the adjacent cytoplasm. Measurements revealed sites with an increase in EAAT2-EGFP plasma membrane fluorescence correlated with a fluorescence decrease beneath the plasma membrane, and sites with plasma membrane fluorescence decrease correlated with fluorescence increase within the adjacent cytoplasm. The sites of rapid translocation/retrieval of EAAT2-EGFP structures to/from the plasma membrane appeared to be distributed in a punctuate pattern around the cell perimeter. The density of EAAT2-EGFP was regulated in a Ca2+-dependent manner, since in the absence of extracellular Ca2+ local translocation/retrieval events were absent, revealing rapid surface density regulation of EAAT2 in astrocytes by regulated exo/endocytosis.
Introduction
Astrocytes play a key role in the uptake of glutamate that is released into the extracellular space from astrocytes themselves (Parpura et al. [Citation1994]) and from glutamatergic neurons during synaptic transmission (Magistretti & Pellerin [Citation1999], Vesce et al. [Citation1999], Gallo & Chittajallu [Citation2001], Amara & Fontana [Citation2002]). Glutamate is removed from the synaptic cleft mainly through two glial glutamate transporters: GLAST (EAAT1) and GLT1 (EAAT2) (Rothstein et al. [Citation1994], Danbolt, [Citation2001]). In physiological conditions, glutamate uptake into astrocytes is driven by the electrochemical gradient of sodium (O'Kane et al. [Citation1999]). The flux of transported glutamate molecules is crucially determined also by the density of transporters in the cell plasma membrane (Rusakov & Kullmann [Citation1998], Huang & Bergles [Citation2004], Robinson [Citation2002]). Specifically, the density of astrocyte transporters determines whether synaptic independence is compromised by synaptic transmitter cross-talk. Rapid glutamate uptake by glial transporters located near release sites (Chaudhry et al. [Citation1995], Bergles et al. [Citation1997], Clark & Barbour [Citation1997], Dzubay & Jahr, [Citation1999]) will remove transmitter and thus help to terminate the excitatory postsynaptic potential, but will also prevent glutamate diffusing to nearby synapses.
Trafficking of glutamate transporters to the plasma membrane has been considered recently (Robinson [Citation2002], Fournier et al. [Citation2004]), but the mechanisms by which the density of glutamate transporters in glial plasma membrane is regulated are still poorly understood. As for other transporters, such as the GLUT4 glucose transporters, it is likely that glutamate transporters get incorporated into the plasma membrane by exocytosis (Cheng et al. [Citation2002], Chowdhury et al. [Citation2002], Karylowski et al. [Citation2004], Zeigerer et al. [Citation2004]). Astrocytes possess several essential components of regulated exocytosis (Jahn & Sudhof [Citation1999]) such as synaptobrevin II, cellubrevin, syntaxin, SNAP-23, synaptotagmin IV (Parpura et al. [Citation1995], Hepp et al. [Citation1999], Zhang et al. [Citation2004]). Moreover, it was recently reported that peptide hormones are released from astrocytes via regulated exocytosis (Kržan et al. [Citation2003]) and that ∼20 µM [Ca2 + ]i is required for a half maximal increase in membrane surface area due to regulated exocytosis (Kreft et al. [Citation2004]). Therefore, Ca2 + -dependent exocytosis may well be a mechanism to affect the density of glutamate transporters in the astrocyte plasma membrane.
To study the putative involvement of regulated exocytosis in glutamate transporter density changes, we have transfected astrocytes with a construct to express excitatory amino acid transporter 2-tagged with enhanced green fluorescent protein (EAAT2-EGFP). This construct predominantly labeled the astrocyte plasma membrane. To measure cumulative exocytosis in transfected cells we stained the plasma membrane with the FM 4-64 (Cochilla et al. [Citation1999], Kilic et al. [Citation2001], Rizzoli et al. [Citation2003]). To test whether EAAT2-EGFP positive structures are translocated from the cell interior to the plasma membrane following elevation of cytosolic [Ca2 + ] by ionomycin we monitored EAAT2-EGFP fluorescence at the plasma membrane and a few micrometers away in the cytoplasm. We observed plasma membrane sites exhibiting a Ca2 + -dependent increase in EAAT2-EGFP intensity correlated with a fluorescence decrease beneath the plasma membrane, and sites displaying a negative correlation between fluorescence from respective locations.
Materials and methods
Astrocyte culture
Astrocyte cultures were prepared from cortex of neonatal rats (3 days old) and cultured as previously described (Schwartz & Wilson [Citation1992]). The care for experimental animals was in accordance with the International Guiding Principles for Biomedical Research Involving Animals developed by the Council for International Organizations of Medical Sciences and the Directive on Conditions for Issue of License for Animal Experiments for Scientific Research Purposes (Official Gazette of the Republic of Slovenia 40/85 and 22/87). Cells were grown in high glucose Dulbecco's modified Eagle's medium (DMEM), containing 10% fetal bovine serum, 1 mM pyruvate, 2 mM glutamine and 25 µg/ml penicillin/streptomycin in 95% air /5% CO2. Confluent cultures were shaken at 225 rpm overnight and the medium changed the next morning; this was repeated a total of three times. After the third overnight shaking, the cells were trypinsinized and cultured for 24 h in 10 µM cytosine arabinoside. After reaching confluence again, the cells were subcultured onto 22 mm diameter circular poly-L-lysine-coated coverslips.
Evaluation of cell viability
An independent set of assays was undertaken to evaluate viability of non-stimulated cells and cells exposed to transient (2 min) stimulation by 4 µM ionomycin. Viability was fluorometrically assessed within 2 h following particular cells treatment by application of 2 µM calcein-AM and 4 µM ethidium homodimer-1 (Invitrogen, Carlsbad CA, USA). Live cells were labelled by calcein-AM, a fluorogenic esterase substrate that is hydrolyzed intracellulary to a green fluorescent product, while dead cells were stained by ethidium homodimer-1, a high-affinity, red fluorescent nucleic acid stain that is only able to pass through the compromised membranes of dead cells. Both labels were applied in PBS for 30 min at room temperature (RT). Confocal and DIC images of live (green fluorescent) and dead (red fluorescent) cells were acquired, and the fraction of live cells calculated for each set of images (238 to 263 cells). The statistical significance between the fractions of live cells following particular treatment was tested using the Student's t-test.
Lipofection
The plasmid encoding excitatory amino acid transporter 2 tagged with enhanced green fluorescent protein (EAAT2-EGFP), a gift of Dr S. Amara (Portland OR, USA), was introduced into the astrocytes by lipofection using the Invitrogen protocol (Carlsbad CA, USA). Briefly, DNA was mixed with 6 µl Plus Reagent, diluted in 100 µl serum-free DMEM and incubated for 15 min at room temperature (RT). 4 µl LipofectaineTM was diluted in 100 µl serum-free DMEM. After incubation both solutions were mixed and incubated further for 15 min at RT. In the mean time, the astrocytes were washed once with serum-free DMEM and supplemented with 800 µl DMEM. 200 µl of lipofection mixture was pipetted onto the cells. Alternatively, DNA was diluted in 50 µl serum-free DMEM. 3 µl Lipofectamine 2000 (Carlsbad CA, USA) was diluted in 50 µl serum-free DMEM and incubated for 5 min at room temperature (RT). After incubation, both solutions were mixed and incubated further for 20 min at RT. The astrocytes were washed once with serum-free DMEM and supplemented with 900 µl DMEM. 100 µl of lipofection mixture was pipetted onto the cells that were further incubated for 3 h at 95% air/5% CO2, 37°C. After that 30 µl of Ultroser G (Gibco, Grand Island, NY, USA) was added, DMEM was exchanged on the next day.
Confocal microscopy
Astrocyte-loaded coverslips were transferred into the recording chamber on a confocal microscope (Zeiss LSM 510, Jena, Germany) and supplied with 400 µl of extracellular solution containing FM 4-64 (4 µM, Molecular Probes, Leiden, The Netherlands), which initially stained the plasma membrane. Once exocytosis was triggered and the vesicles fused to the plasma membrane, the fluorescence intensity increased, as FM 4-64 gained access to this newly exposed membrane. The cumulative exocytosis was measured by FM 4-64 fluorescence increase (Betz et al. [Citation1992], Smith & Betz [Citation1996], Kilic et al. [Citation2001]). The FM 4-64 fluorescence increase is reported as a percent change of the initial fluorescence determined prior to stimulus application. A gravity feed perfusion system (1 to 2 ml/min) was used to apply ionomycin (5 or 10 µM) dissolved in extracellular solution containing 4 µM FM 4-64. Fluorescent images were acquired by a plan-apochromatic oil immersion objective (63×, 1.4 NA) using 488 nm Ar-Ion laser excitation. EAAT2-EGFP and FM 4-64 fluorescence were separated using BP 505–530 nm and LP 585 nm emission filters, respectively. Images were stored on IBM-PC compatible computer (Siemens Nixdorf, Germany) and quantitatively analyzed using LSM 510 software (Zeiss, Jena, Germany) and software subroutines written in MATLAB 6.5 (Math Works, Natick MA, USA). The time-dependent changes in fluorescence intensity were measured either in the whole image relative to the resting fluorescence level recorded in arbitrary units (A.U.) 30 s prior to the stimulus application or in the squared regions of interest (ROI) (x = 20 pixels, 3.4×3.4 µm) placed over the plasma membrane or over the cell interior. All fluorescence changes were measured relative to the baseline fluorescence and are statistically presented in the form of mean±SE. To avoid potential bias in the determination of relative fluorescence changes due to noise fluctuations, the fluorescence signals were digitally filtered with linear-phase filter with normalized cutoff frequency 0.1 Hz. The criterion used to identify significant EAAT2-EGFP fluorescence change measured 60 sec after the onset of ionomycin stimulation was set following the analysis of filtered signals in paired cellular locales. Any relative steady-state fluorescence change exceeding the baseline fluorescence level by ±4% was considered significant, if detected in both locales, at the plasma membrane and in the cell interior.
Solutions
Extracellular solution contained (in mM) NaCl 130, KCl 5, CaCl2 2, MgCl2 1, D-Glucose 10, HEPES [N-2-hydroxyethylpiperazine-N′-2-ethanesulfonic acid] 10, and pH 7.2/NaOH. DMEM contained (in mM): HEPES 4, Tricine 5, L-Glutamine 2, 10% newborn calf serum, 0.01% bovine serum albumin. If not stated otherwise, all chemicals were obtained from Sigma (Darmstadt, Germany) and were of highest grade of purity available.
Results
EAAT2-EGFP molecules reside mainly in the plasma membrane
Cultured cells were immunocytochemically identified as astrocytes by antibodies against glial fibrilary acidic protein (GFAP, data not shown), a molecule expressed in differentiated astrocytes (Kennedy et al. [Citation1980]). To study the regulation of glutamate transporter density in the plasma membrane, cultured astrocytes were transfected with a construct to express excitatory amino acid transporter 2 – tagged with enhanced green fluorescent protein (EAAT2-EGFP). As shown previously (Huggett et al. [Citation2002], Cheng et al. [Citation2002]), transfected rat astrocytes displayed green fluorescence predominantly in their plasma membrane (), although some faint diffuse fluorescence was observed also within the cell interior ( and ). The fluorescence signals likely represent EAAT2-EGFP molecules residing mainly in the plasma membrane.
Figure 1. EAAT2-EGFP predominately labels astrocyte plasma membrane. Confocal image of a cultured rat astrocyte transfected with the EAAT2-EGFP construct. The fluorescence is mainly distributed in nonuniform pattern in the astrocyte plasma membrane. Note many thin processes that emerge from the astrocyte surface. Scale bar = 20 µm.
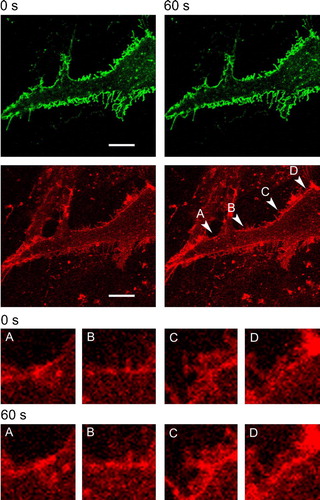
Figure 2. Exocytotic response in astrocyte triggered by ionomycin. Confocal images of double-labeled astrocyte before (left, 0 sec) and 60 sec after (right) bath application of 10 µM ionomycin in the presence of 2 mM extracellular Ca2 + . Top panels show EAAT2-EGFP fluorescence (green), the bottom panels show FM 4-64 stain (red). The average pixel intensity of the EAAT2 fluorescence in the image of the whole cell is 6.6 arbitrary units (A.U.) at 0 s and 6.2 A.U. at 60 sec, while for the FM 4-64 fluorescence the values are 20.7 A.U. at 0 sec and 27.8 A.U. at 60 sec. The increase in FM 4-64 fluorescence intensity is evident at particular locales of the plasma membrane pinpointed by arrowheads (A–D), 60 sec after ionomycin application. Scale bar = 10 µm. Insets below show the selected membrane locales stained by FM 4-64 before (0 s) and 60 sec after ionomycin stimulation. This Figure is reproduced in colour in Molecular Membrane Biology online.
Ca2 + -dependent exocytosis triggered in cells transfected with EAAT2-EGFP
If EAAT2-EGFP, localized in the cytoplasm, is translocated to the astrocyte plasma membrane via regulated Ca2 + -dependent exocytosis, then the intensity of the green fluorescent probe in the plasma membrane should increase after elevating cytosolic [Ca2 + ], while it should remained unchanged in the whole cell image. In contrast, application of ionomycin to cells maintained in bath containing 2 mM Ca2 + and 4 µM FM 4-64, appeared to have induced a small reduction in the EAAT2-EGFP fluorescence intensity by 7% (, top panels). Concomitant with EAAT2-EGFP fluorescence changes in astrocytes we monitored the fluorescence intensity of FM 4-64, a marker of cumulative exocytosis (, bottom panels; Betz et al. [Citation1992], Smith & Betz [Citation1996], Kilic et al. [Citation2001], Kržan et al. [Citation2003]), which increased by 34%, from 20.7±0.1 to 27.8±0.1 A.U., 1-minute after ionomycin application (compare bottom panels A-D of the ), showing that under these conditions Ca2 + -dependent exocytosis can be triggered in cells transfected with EAAT2-EGFP, consistent with previous reports (Kržan et al. [Citation2003]). Short-term (2 min) exposure to 4 µM ionomycin did not significantly alter cell viability, the fraction of surviving cells was 94.6±1.6% (mean±SE) in nonstimulated vs. 95.7±1.5% in ionomycin stimulated cells (p=0.62, Student t-test).
Biphasic time-course of EAAT2-EGFP fluorescence in ionomycin-stimulated cells
To further examine the effect of ionomycin application on EAAT2-EGFP fluorescence intensity we monitored time-dependent fluorescence changes of the whole images. As shown on A, the EAAT2-EGFP fluorescence intensity transiently increased to a peak within 10 to 20 sec after onset of ionomycin application. After the initial increase the EAAT2-EGFP fluorescence intensity decreased to a steady-level that was below the resting value determined prior to the ionomycin application (A, top left). To quantify the fluorescence intensity changes, we measured the peak of the transient fluorescence increase (fp), within 20 sec following the ionomycin application, and the amplitude of the steady-state decrease in EAAT2-EGFP fluorescence intensity (f60), 1-minute following the ionomycin application. Both parameters were measured in percents relative to the resting fluorescence intensity recorded in arbitrary units (A.U.), 30 sec prior to ionomycin application. In the presence of extracellular Ca2 + the average ionomycin-induced fp of the EAAT2-EGFP was around 5% (5.0±0.7%; n=10), significantly different from zero (B, filled bar on the left, p<0.01).
Figure 3. Changes in EAAT2-EGFP fluorescence intensity in whole astrocyte image are associated with an increase in FM 4-64 fluorescence that indicates Ca2 + -dependent exocytotic addition of vesicle membrane into the plasma membrane. (A) Transient increase in EAAT2-EGFP fluorescence intensity is followed by a steady-state decrease (top), but an FM 4-64 fluorescence increase (bottom) is obtained in a single astrocyte after 10 µM ionomycin application in Ca2 + -containing solution (2 mM, left). Note that there are no changes in fluorescence of both signals in Ca2 + -free extracellular solution (right). The parameters measured in each individual record are displayed on EAAT2-EGFP and FM 4-64 fluorescence traces; fp=peak fluorescence increase (%), f60=fluorescence change 60 sec following ionomycin stimulation (%). The thin solid line represents basal fluorescence level, the adjacent numbers report average grayscale level of basal fluorescence in arbitrary units (A.U.). (B) The relative (in%) peak fluorescence increase in EAAT2-EGFP fluorescence (left) (mean±SE), and the relative (in%) changes in FM 4-64 and EAAT2-EGFP fluorescence (right) 60 sec after bath application of ionomycin obtained in different cells stimulated with 5 or 10 µM ionomycin in extracellular solution containing 2 mM Ca2 + (n=12) and in Ca2 + -free extracellular solution (n=7). In the presence of extracellular Ca2 + , the fluorescence changes were statistically different from zero as indicated by the asterisks (fp, EAAT2-EGFP, p<0.001; f60, FM 4-64, p=0.015; f60, EAAT2-EGFP, p=0.005, t-test).
This transient increase in EAAT2-EGFP fluorescence likely reflects a change in local pH following ionomycin incorporation into the plasma membrane. Ionomycin Ca2 + -2H+ antiport exchanger activity (Nicholls & Budd [Citation2000]) influenced the EGFP fluorescence intensity, which increases rapidly above pH 7.0 (Patterson et al. [Citation1997]). Moreover, if the transient increase in EAAT2-EGFP intensity is due to a change in pH upon the application of a Ca2 + -2H+ exchanger, then one would expect an abolishment of the transient fluorescence increase in the absence of extracellular Ca2 + , as was observed (A top trace to the right). However, it is more challenging to explain the reduction of EAAT2-EGFP fluorescence in whole images recorded 60 s after ionomycin stimulation in the presence of Ca2 + and FM 4-64 molecules. As shown on B, in the presence of extracellular Ca2 + , the total average FM 4-64 fluorescence intensity increased by ∼30% 1-min after ionomycin application, whereas the total EAAT2-EGFP fluorescence decreased on average by ∼13% (n=12, B, filled bars). The responses were Ca2 + -dependent, since in the absence of extracellular Ca2 + , the FM 4-64 and the EAAT2-EGFP fluorescence intensities before and after ionomycin application were not significantly different from zero (n=7, B, open bars).
FM 4-64 in the plasma membrane affects the EAAT2-EGFP fluorescence
We considered that the f60 steady-state EAAT2-EGFP fluorescence intensity decrease is likely due to an optical and not due to a physiological phenomenon since it is difficult to reconcile that EAAT2-EGFP molecules get simply lost from the plasma membrane (). To verify that the intensity decline of EAAT2-EGFP fluorescence in the plasma membrane represents an optical phenomenon, we exposed astrocytes to ionomycin in the absence of FM 4-64 molecules. The total EAAT2-EGFP fluorescence change was under such conditions only −0.4±2.4% (n=9, A), not significantly different from zero, but significantly smaller in comparison to the results obtained in the presence of FM 4-64. These results are consistent with the idea that the incorporation of FM 4-64 molecules into the newly added membrane following Ca2 + -regulated exocytosis influences the fluorescence of EAAT2-EGFP molecules, already residing in the plasma membrane. The results obtained in whole images clearly show a significant difference between the mean relative EAAT2-EGFP fluorescence decrease measured in the absence (n=9) of FM 4-64 and in the presence (n=12) of FM 4-64 (−0.4±2.4% vs. −12.7±3.6%, p=0.017; Student's t-test) (B). Moreover, the putative effect of FM 4-64 molecules on the EAAT2-EGFP fluorescence is further supported by the significant negative correlation between the ionomycin-induced fluorescence change of EAAT2-EGFP and FM 4-64 (R = -0.66, p=0.0022, n=19) (C). The data obtained in stimulated cells kept in the presence of Ca2 + and FM 4-64 thus mainly indicate an artifactual reduction in the density of EAAT2-EGFP molecules residing in the plasma membrane due to ionomycin triggered Ca2 + -dependent exocytosis reported by FM 4-64 fluorescence increase ( and C).
Figure 4. The amplitude of EAAT2-EGFP fluorescence steady state change following Ca2 + -dependent exocytosis is influenced by FM 4-64 in the astrocyte plasma membrane. (A) Ionomycin-induced changes in EAAT2-EGFP fluorescence intensity in whole image obtained in a single astrocyte maintained in bath with 2 mM Ca2 + but in the absence of FM 4-64. Note, that the small transient increase is followed by a very small steady state decrease in EAAT2-EGFP fluorescence intensity following ionomycin application (compare the calibration with that on A), at the end of the trace. The thin solid line represents basal fluorescence level; the adjacent number reports the average grayscale level of basal fluorescence in arbitrary units (A.U.). (B) The mean relative (in%) change in steady-state EAAT2-EGFP fluorescence intensity recorded 60 sec after ionomycin application (EAAT2-EGFP f 60 (%)) to cells maintained in bathing solution devoid of FM 4-64 (n=9), in control cells stimulated by extracellular solution alone (n=7) and in ionomycin-stimulated cells (n=12), both maintained in the bath with FM 4-64 (4 µM). The amplitude of the mean steady-state-EAAT2-EGFP fluorescence diminution in ionomycin-stimulated cells significantly differs from the EAAT2-EGFP fluorescence diminution in control cells as indicated by the p-value (Student's t-test). The signs indicate presence (+) or absence (-) of 5 µM ionomycin (Iono) and 4 µM FM 4-64. (C) The relative amplitude of steady state EAAT2-EGFP fluorescence intensity decrease, determined 60 s after the addition of ionomycin (EAAT2-EGFP f 60 (%)) correlates with the amplitude of steady-state FM 4-64 fluorescence intensity increase (FM 4-64 f 60 (%)), determined at the same time point as the EAAT2-EGFP signal (correlation coefficient R = -0.66, p=0.0022, n=19). Data from the control cells stimulated by extracellular solution alone (open symbols) and from the cells stimulated by extracellular solution containing 5 µM ionomycin (filled symbols) are displayed.
Data obtained in 6 stimulated cells maintained in the absence of FM 4-64 molecules additionally revealed rapid exocytotic translocation of EAAT2-EGFP from the cell interior to the plasma membrane (A). At the bottom of there is a sequence of images indicating the trafficking of an EAAT2-positive particle to the plasma membrane (Supplementary movie 1 – online version only).
Figure 5. Ionomycin-induced exocytotic translocation of EAAT2-EGFP from the cell interior to the plasma membrane and endocytotic retrieval of EAAT2-EGFP from the plasma membrane. Top panel shows a confocal image of an astrocyte obtained before application of ionomycin in the bath containing 2 mM Ca2 + . Scale bar = 10 µm. (A) Detailed views of EAAT2-EGFP fluorescence intensity in the portion of the same astrocyte delineated by the open frame A (top image) before (0 sec) and 60 sec after bath application of ionomycin. Filled arrowheads point to increases in EAAT2-EGFP fluorescence intensity at the plasma membrane following ionomycin stimulation, likely due to apparent exocytotic addition of EAAT2-EGFP positive material from the cell interior. Small rectangles indicate regions (11.6 µm2) that were used to monitor EAAT2-EGFP fluorescence at the plasma membrane and in the cell interior. (B) Detailed views of decrease in EAAT2-EGFP fluorescence intensity at the locales of plasma membrane 60 sec after ionomycin stimulation, marked by the open arrowhead, which indicates the sites of apparent retrieval of EAAT2-EGFP positive material from the plasma membrane. Image sequence below (0–31 sec) displays rapid translocation of the EAAT2-EGFP positive, vesicle-like structure from cell interior to the astrocyte plasma membrane (see Supplementary movie 1 – online version only). Arrowhead indicates position of the EAAT2-EGFP positive structure within each image.
Further quantitative detailed analysis of EAAT2-EGFP fluorescence signals in 60 pairs of ROIs (each pair consisting of a ROI covering the plasma membrane and an adjacent ROI covering the cell interior bellow the plasma membrane (, top panel), revealed cellular regions with different types of trafficking activity including exocytotic translocation of EAAT2-EGFP to the plasma membrane (A), endocytotic retrieval of EAAT2-EGFP from the plasma membrane (B) and regions with no apparent trafficking activity (C). Many locales at the plasma membrane exhibited an increase in EAAT2-EGFP fluorescence intensity, with a concomitant decrease in fluorescence in the cytoplasm below the plasma membrane, representing 28% of cases observed (n=17) (A). A similar proportion of the plasma membrane locales exhibited a decrease in EAAT2-EGFP fluorescence intensity, with a concomitant increase in fluorescence in the cytoplasm below the plasma membrane, representing 35% of cases (n=21) (B). Some plasma membrane locales (28%, n=17) were devoid of a significantly correlated (R = 0.21, p=0.42) increase or decrease in EAAT2-EGFP fluorescence intensity associated with a change in the cytoplasm below the plasma membrane, which may indicate that only distinct regions in the plasma membrane are capable of incorporating/retrieving EAAT2-EGFP molecules to/from the plasma membrane upon a stimulus. Few locales (8%, n=5) exhibited simultaneous increase or decrease in EAAT2-EGFP fluorescence intensity in the plasma membrane and in the adjacent cytoplasm, reflecting redistribution of fluorescent structures due to localized cell movements as confirmed by visual inspection. Taken together these data indicate a complex, highly dynamic and localized regulation of EAAT2-EGFP surface density in astrocytes.
Figure 6. Types of time-dependent EAAT2-EGFP fluorescence intensity changes obtained at the plasma membrane (MEMBRANE) and in an adjacent position in the cytoplasm (INTERIOR) recorded in randomly selected regions of the astrocyte in response to stimulation by ionomycin. The positions of localities MEMBRANE and INTERIOR are depicted in by the smallest squares covering 11.6 µm2 (3.4×3.4 µm). (A) The incorporation of EAAT2-EGFP into the plasma membrane indicated by EAAT2-EGFP fluorescence increase at the plasma membrane that is accompanied by a fluorescence decrease in the cell interior. The dotted line represents basal fluorescence level, the adjacent numbers report average grayscale level of the basal fluorescence in arbitrary units (A.U.), the gray solid lines indicate filtered EAAT2-EGFP fluorescence (see methods) used to estimate relative fluorescence change (%) 60 seconds (filled arrowhead) after bath application of ionomycin (open arrowhead). (B) The retrieval of EAAT2-EGFP from the plasma membrane indicated by EAAT2-EGFP fluorescence decrease at the plasma membrane, which is accompanied by the EAAT2-EGFP fluorescence increase in the region below the plasma membrane in the cell interior. (C) No changes in EAAT2-EGFP fluorescence at the plasma membrane and in the cell interior. (D) The graph displays the relationship between the relative fluorescence intensities obtained at the plasma membrane (abscissa) with those obtained in the cytoplasm (ordinate, n=38), which were fitted to the linear equation: y = 5.82-0.44*x [y – relative EAAT2-EGFP fluorescence change in cell interior (%); x – relative EAAT2-EGFP fluorescence change at the plasma membrane (%)] (solid line). The relative fluorescence changes indicating either EAAT2 incorporation into the plasma membrane (n=17, filled circles) or retrieval from the plasma membrane (n=21, open circles) were significantly negatively correlated, R = 0.75, p<0.0001. Paired locales (n=17, dark gray squares) of relative fluorescence intensity changes at the plasma membrane and in the adjacent cytoplasm were uncorrelated (R = 0.21, p=0.42). In 5 paired locales (open triangles) the relative fluorescence change at the plasma membrane was positively correlated with fluorescence change in the cell interior, R = 0.94, p<0.05. These data were fitted to the linear equation: y = 0.92 + 0.57*X (dashed line). The dotted crosshair indicates zero fluorescence change; the axisymmetric light gray area around x- and y-axis indicates the region of 4% fluorescence change used to discriminate between the exocytotic addition to and endocytotic retrieval of the EAAT2-EGFP from the plasma membrane.
![Figure 6. Types of time-dependent EAAT2-EGFP fluorescence intensity changes obtained at the plasma membrane (MEMBRANE) and in an adjacent position in the cytoplasm (INTERIOR) recorded in randomly selected regions of the astrocyte in response to stimulation by ionomycin. The positions of localities MEMBRANE and INTERIOR are depicted in Figure 5 by the smallest squares covering 11.6 µm2 (3.4×3.4 µm). (A) The incorporation of EAAT2-EGFP into the plasma membrane indicated by EAAT2-EGFP fluorescence increase at the plasma membrane that is accompanied by a fluorescence decrease in the cell interior. The dotted line represents basal fluorescence level, the adjacent numbers report average grayscale level of the basal fluorescence in arbitrary units (A.U.), the gray solid lines indicate filtered EAAT2-EGFP fluorescence (see methods) used to estimate relative fluorescence change (%) 60 seconds (filled arrowhead) after bath application of ionomycin (open arrowhead). (B) The retrieval of EAAT2-EGFP from the plasma membrane indicated by EAAT2-EGFP fluorescence decrease at the plasma membrane, which is accompanied by the EAAT2-EGFP fluorescence increase in the region below the plasma membrane in the cell interior. (C) No changes in EAAT2-EGFP fluorescence at the plasma membrane and in the cell interior. (D) The graph displays the relationship between the relative fluorescence intensities obtained at the plasma membrane (abscissa) with those obtained in the cytoplasm (ordinate, n=38), which were fitted to the linear equation: y = 5.82-0.44*x [y – relative EAAT2-EGFP fluorescence change in cell interior (%); x – relative EAAT2-EGFP fluorescence change at the plasma membrane (%)] (solid line). The relative fluorescence changes indicating either EAAT2 incorporation into the plasma membrane (n=17, filled circles) or retrieval from the plasma membrane (n=21, open circles) were significantly negatively correlated, R = 0.75, p<0.0001. Paired locales (n=17, dark gray squares) of relative fluorescence intensity changes at the plasma membrane and in the adjacent cytoplasm were uncorrelated (R = 0.21, p=0.42). In 5 paired locales (open triangles) the relative fluorescence change at the plasma membrane was positively correlated with fluorescence change in the cell interior, R = 0.94, p<0.05. These data were fitted to the linear equation: y = 0.92 + 0.57*X (dashed line). The dotted crosshair indicates zero fluorescence change; the axisymmetric light gray area around x- and y-axis indicates the region of 4% fluorescence change used to discriminate between the exocytotic addition to and endocytotic retrieval of the EAAT2-EGFP from the plasma membrane.](/cms/asset/84bf9ad2-d050-4d01-86aa-311b97b2ed9a/imbc_a_279129_f0006_b.gif)
Discussion
The dynamics of glutamatergic synaptic transmission is affected in mice devoid of the GLT1 glutamatergic transporter mainly expressed by astrocytes (Marcaggi et al. [Citation2003]). Thus it is possible that glutamatergic transmission is modulated by the density of glutamate transporters in the plasma membrane of astrocytes facing the synapse. Therefore, we here studied the regulation of glutamate transporter density in the astrocyte plasma membrane by triggering calcium-dependent exocytosis, which was previously demonstrated in cultured astrocytes (Parpura et al. [Citation1994], Kržan et al. [Citation2003], Kreft et al. [Citation2004], Bezzi et al. [Citation2004], Pangršič et al. [Citation2007]).
EAAT2-EGFP is localized unevenly at the astrocyte plasma membrane
We have transfected cells with a construct to express excitatory amino acid transporter 2-tagged with enhanced green fluorescent protein (EAAT2-EGFP). Two days after transfection, the astrocytes exhibited green fluorescence that was predominantly distributed in their plasma membrane that formed thin processes of variable sizes (). The majority of fluorescing molecules presumably incorporated into the plasma membrane, likely indicate inserted glutamate transporters. The surface localization of transporter molecules is consistent with previous reports (Rothstein et al. [Citation1994], Huggett et al. [Citation2002], Cheng et al. [Citation2002], Rothstein et al. [Citation2005]); their subcellular location is consistent with their major physiological role – removal of extracellular glutamate (Magistretti & Pellerin [Citation1999], Vesce et al. [Citation1999], Gallo & Chittajallu [Citation2001]). Moreover, the uneven plasma membrane distribution of the EAAT2-EGFP signal likely indicates that distinct plasma membrane locales may exhibit distinct densities of these molecules, assuming that fluorescence intensity of EAAT2-EGFP is associated with the density of transporter molecules.
Ionomycin application likely alters pH of astrocyte cytoplasm
Regulated exocytosis requires a stimulus that results in an increase in cytoplasmic Ca2 + concentration (Burgoyne & Morgan [Citation1995], Calakos & Scheller [Citation1996]), also in astrocytes (Kreft et al. [Citation2004]). In our experiments, the cytosolic Ca2 + was elevated by bath application of ionomycin to the transfected cells, which induces and increases in cytosolic calcium (Potokar et al. [Citation2007]). Following ionomycin application, the EAAT2-EGFP fluorescence transiently increased when Ca2 + and FM 4-64 were present in the bath (). The transient increase in EAAT2-EGFP fluorescence probably reflects a change of cytosolic pH since EGFP is also a fluorescent pH probe (Patterson et al. [Citation1997]). The transient EAAT-EGFP fluorescence increase thus likely reports alkalinization of the cytosolic pH, which resulted from Ca2 + -2H+ antiport activity of ionomycin (Nicholls & Budd [Citation2000]). In agreement with this, pH changes ranging from 0.2 units by as much as 0.5 units were reported when ionomycin was used to elevate cytosolic Ca2 + (Llopis et al. [Citation1998], Ou-Yang et al. [Citation1994]).
FM 4-64 influences the fluorescence of EAAT2-EGFP residing in the plasma membrane
Consistent with the presence of a regulated exocytotic pathway in astrocytes (Kreft et al. [Citation2004], Pangršič et al. [Citation2006]), addition of ionomycin stimulated a calcium-dependent increase in FM 4-64 fluorescence intensity (). Interestingly, this increase was associated with a steady-state decline in EAAT2-EGFP fluorescence intensity, recorded 1 min following the addition of ionomycin (). To verify that EAAT2-EGFP fluorescence changes obtained in the presence of Ca2 + and FM 4-64 potentially reflect a reduction of the EAAT2-EGFP surface density due to Ca2 + -dependent exocytosis, and are not merely an optical phenomenon of the assay, further experiments were done on transfected cells maintained in the absence of FM 4-64. In these conditions, the ionomycin application triggered only minor and insignificant changes in EAAT2-EGFP fluorescence intensity (A). These results indicate a substantial impact of FM 4-64 molecules on the fluorescence of EAAT2-EGFP already residing at the plasma membrane. Apparently, the incorporation of FM 4-64 molecules following Ca2 + -dependent addition of vesicle membrane into the plasma membrane, significantly influences the ability of EAAT2-EGFP molecules to either absorb excitation light and/or to emit fluorescence light, and is likely attributable to the secondary inner filter effect (Lakowicz [Citation1999]) a phenomenon whereby fluorophores that are somewhat separated in the space can transfer energy through an emission and re-absorption process. Since extracellulary applied FM dyes partition only into the outer leaflet of plasma membranes, without diffusing through the membrane and entering the cytoplasm (Betz et al. [Citation1992], Schote & Seelig [Citation1998]), and the EGFP, covalently linked to the EAAT2, faces only the thin layer of cytosol below the inner leaflet of plasma membrane, it appears likely that EAAT2-EGFP emission fluorescence was partially re-absorbed by FM 4-64 molecules.
Monitoring local membrane domains revealed that EAAT2-EGFP is rapidly translocated to and retrieved from the astrocyte plasma membrane following stimulation
The observation that EAAT2-EGFP is unevenly distributed within the plasma membrane () prompted us to study the fluorescence intensity changes of EAAT2-EGFP at distinct membrane locales, by comparing EAAT2-EGFP fluorescence intensity with the adjacent cytoplasmic regions below the plasma membrane. If EAAT2-EGFP positive subcellular structures are translocated to the plasma membrane upon stimulation, one would expect a local increase in EAAT2-EGFP fluorescence intensity at the plasma membrane with a concomitant decrease of the signal below the plasma membrane. Indeed, in 28% of randomly selected membrane regions we have observed local EAAT2-EGFP fluorescence intensity increases following stimulation, with a concomitant fluorescence reduction in regions below the plasma membrane (A and 6A). At the bottom of several frames of a movie are displayed in which an EAAT2-EGFP particle is transported to the plasma membrane, supporting the idea, that structures carrying EAAT2-EGFP fluorescence are trafficking towards the plasma membrane where they end their pathway. The idea of Ca2 + -dependent translocation resulting in increased density of EAAT2-EGFP molecules at the plasma membrane, likely due to exocytosis, is supported not only by the fluorescence increase at the plasma membrane but also by the simultaneous fluorescence decrease in the region below the plasma membrane (A). This translocation may in part result from the reorganization of the cytoskeletal elements following elevation in free cytosolic Ca2 + , as observed in cortical actin network in adrenal chromaffin cells (Burgoyne et al. [Citation1993]), if it is not entirely due to exocytotic incorporation into the plasma membrane. The existence of calcium-dependent exocytotic increase in these transfected cells is supported by the experiment shown in , where FM 4-64 signal is increased due to membrane area increase, consistent with previous report (Kržan et al. [Citation2003]).
Interestingly, in 35% of cases observed (B) the plasma membrane exhibited a decrease in EAAT2-EGFP fluorescence intensity, with a concomitant increase in fluorescence in the cytoplasm below the plasma membrane. These changes likely represent the retrieval of EAAT2-EGFP positive structures, potentially endocytotic vesicles. The absence of a clear increase or decrease in fluorescence intensity in many plasma membrane locales (28%) may indicate that only distinct regions in the plasma membrane are capable of incorporating/retrieving EAAT2-EGFP molecules to/from the plasma membrane upon a stimulus. Since changes in EAAT2-EGFP fluorescence intensity are occurring at distinct plasma membrane regions, it is likely that they were undetected in previously reported slow translocation of glutamate transporters (Blakely & Bauman [Citation2000], Robinson [Citation2002]).
Functional implications of local EAAT2 density alteration in the astrocyte plasma membrane
This study demonstrates that an increase in cytoplasmic [Ca2 + ] causes the exocytotic response in astrocytes (see ) that is accompanied by local increases or decreases in EAAT2-EGFP transporter density in the plasma membrane (). It is unlikely that these changes are due to an impairment of cell function by ionomycin application, since short term cell viability did not change after ionomycin application. The rapid changes in glutamate transporter density observed here suggest that astrocytes may partially regulate uptake of extracellular glutamate at distinct locales in a much more rapid fashion than previously considered (Robinson [Citation2002]), where changes in transporter density were observed in several minutes (González & Robinson [Citation2004]). Glutamate transporter density changes have been considered to affect synaptic transmission. In knock out mice lacking the GLT1 transporter in astrocyte membranes that enwrap glutamatergic synapses it was shown that synaptic transmission is affected, exhibiting an increased probability of glutamate diffusion to the nearby synapses or to the extrasynaptic receptor sites (Marcaggi et al. [Citation2003]). Furthermore, kinetic simulations of extrasynaptic glutamate uptake confirmed sharp dependence of extracellular glutamate concentration on density of transporters (Rusakov & Kullmann [Citation1998]). It was considered that the regulation of glial glutamate transporter density on longer term remains essential for maintaining low extracellular glutamate concentration and prevention of chronic glutamate neurotoxicity (Rothstein et al. [Citation1996]).
Acknowledgements
We thank Dr Susan G. Amara for the generous donation of the EAAT2-EGFP construct. This work was supported by grants P3 310 381 and Z3 7476 1683 from the Ministry of Higher Education, Sciences and Technology of the Republic of Slovenia and the EU grants #QLG3 2001-2004 and #DECG, CLG3-CT-2001-02004.
References
- Amara SG, Fontana AC. Excitatory amino acid transporters: keeping up with glutamate. Neurochem Int 2002; 41: 313–318
- Bergles DE, Dzubay JA, Jahr CE. Glutamate transporter currents in bergmann glial cells follow the time course of extrasynaptic glutamate. Proc Natl Acad Sci USA 1997; 94: 14821–14825
- Betz WJ, Mao F, Smith CB. Activity-dependent fluorescent staining and destaining of living vertebrate motor nerve terminals. J Neurosci 1992; 12: 363–375
- Bezzi P, Gundersen V, Galbete JL, Seifert G, Steinhauser C, Pilati E, Volterra A. Astrocytes contain a vesicular compartment that is competent for regulated exocytosis of glutamate. Nat Neurosci 2004; 7: 613–620
- Blakely RD, Bauman AL. Biogenic amine transporters: regulation in flux. Curr Opin Neurobiol 2000; 10: 328–336
- Burgoyne RD, Morgan A, Robinson I, Pender N, Cheek TR. Exocytosis in adrenal chromaffin cells. J Anat 1993; 183: 309–314
- Burgoyne RD, Morgan A. Ca2+ and secretory dynamics. Trends Neurosci 1995; 18: 191–196
- Calakos N, Scheller RH. Synaptic vesicle biogenesis, docking, and fusion: molecular description. Physiol Rev 1996; 76: 1–29
- Chaudhry FA, Lehre KP, van Lookeren Campagne M, Ottersen OP, Danbolt NC, Storm-Mathisen J. Glutamate transporters in glial plasma membranes: highly differentiated localizations revealed by quantitative ultrastructural immunocytochemistry. Neuron 1995; 15: 711–720
- Cheng C, Glover G, Banker G, Amara SG. A novel sorting motif in the glutamate transporter excitatory amino acid transporter 3 directs its targeting in Madin-Darby canine kidney cells and hippocampal neurons. J Neurosci 2002; 22: 10643–10652
- Chowdhury HH, Kreft M, Zorec R. Rapid insulin-induced exocytosis in white rat adipocytes. Eur J Physiol 2002; 445: 352–356
- Clark BA, Barbour B. Currents evoked in Bergmann glial cells by parallel fibre stimulation in rat cerebellar slices. J Physiol 1997; 502: 335–350
- Cochilla AJ, Angleson JK, Betz WJ. Monitoring secretory membrane with FM1-43 fluorescence. Annu Rev Neurosci 1999; 22: 1–10
- Danbolt NC. Glutamate uptake. Prog Neurobiol 2001; 65: 1–105
- Dzubay JA, Jahr CE. The concentration of synaptically released glutamate outside of the climbing fiber-Purkinje cell synaptic cleft. J Neurosci 1999; 19: 5265–5274
- Fournier KM, Gonzalez MI, Robinson MB. Rapid trafficking of the neuronal glutamate transporter, EAAC1: evidence for distinct trafficking pathways differentially regulated by protein kinase C and platelet-derived growth factor. J Biol Chem 2004; 279: 34505–34513
- González MI, Robinson MB. Neurotransmitter transporters: why dance with so many partners?. Curr Opin Pharmacol 2004; 4: 30–35
- Gallo V, Chittajallu R. Unwrapping glial cells from the synapse: what lies inside?. Science 2001; 292: 872–873
- Hepp R, Perraut M, Chasserot-Golaz S, Galli T, Aunis D, Langley K, Grant NJ. Cultured glial cells express the SNAP-25 analogue SNAP-23. Glia 1999; 27: 181–187
- Huang YH, Bergles DE. Glutamate transporters bring competition to the synapse. Curr Opin Neurobiol 2004; 14: 346–352
- Huggett JF, Mustafa A, O'Neal L, Mason DJ. The glutamate transporter GLAST-1 (EAAT-1) is expressed in the plasma membrane of osteocytes and is responsive to extracellular glutamate concentration. Biochem Soc Trans 2002; 30: 890–893
- Jahn R, Sudhof TC. Membrane fusion and exocytosis. Annu Rev Biochem 1999; 68: 863–911
- Karylowski O, Zeigerer A, Cohen A, McGraw TE. GLUT4 is retained by an intracellular cycle of vesicle formation and fusion with endosomes. Mol Biol Cell 2004; 15: 870–882
- Kennedy PG, Lisak RP, Raff MC. Cell type-specific markers for human glial and neuronal cells in culture. Lab Invest 1980; 43: 342–351
- Kilic G, Angelson JK, Cochilla AJ, Nussinovitch I, Betz WJ. Sustained stimulation of exocytosis triggers continuous membrane retrieval in rat pituitary somatotrophs. J Physiol (Lond. 2001; 532: 771–783
- Kreft M, Stenovec M, Rupnik M, Grilc S, Kržan M, Potokar M, Pangršič T, Haydon PG, Zorec R. Properties of Ca(2 + )-dependent exocytosis in cultured astrocytes. Glia 2004; 46: 437–445
- Kržan M, Stenovec M, Kreft M, Pangršič T, Grilc S, Haydon PG, Zorec R. Calcium-dependent exocytosis of atrial natriuretic peptide from astrocytes. J Neurosci 2003; 23: 1580–1583
- Lakowicz JR. Principles of fluorescence spectroscopy. 2nd edn. Springer, New York 1999
- Llopis J, McCaffery JM, Miyawaki A, Farquhar MG, Tsien RY. Measurement of cytosolic, mitochondrial, and Golgi pH in single living cells with green fluorescent proteins. Proc Natl Acad Sci USA 1998; 95: 6803–6808
- Magistretti PJ, Pellerin L. Astrocytes couple synaptic activity to glucose utilization in the brain. News Physiol Sci 1999; 14: 177–182
- Marcaggi P, Billups D, Attwell D. The role of glial glutamate transporters in maintaining the independent operation of juvenile mouse cerebellar parallel fibre synapses. J Physiol 2003; 552: 89–107
- Nicholls DG, Budd SL. Mitochondria and neuronal survival. Physiol Rev 2000; 80: 315–360
- O'Kane RL, Martinez-Lopez I, DeJoseph MR, Vina JR, Hawkins RA. Na(+)-dependent glutamate transporters (EAAT1, EAAT2, and EAAT3) of the blood-brain barrier. A mechanism for glutamate removal. J Biol Chem 1999; 274: 31891–31895
- Ou-Yang Y, Kristian T, Mellergard P, Siesjo BK. The influence of pH on glutamate- and depolarization-induced increases of intracellular calcium concentration in cortical neurons in primary culture. Brain Res 1994; 646: 65–72
- Pangršič T, Potokar M, Haydon PG, Zorec R, Kreft M. Astrocyte swelling leads to membrane unfolding, not membrane insertion. J Neurochem 2006; 99: 514–523
- Pangršič T, Potokar M, Stenovec M, Kreft M, Fabbretti E, Nistri A, Pryazhnikov E, Khiroug L, Giniatullin R, Zorec R. Exocytotic release of ATP from cultured astrocytes. J Biol Chem 2007; 282: 28749–28758
- Parpura V, Basarsky TA, Liu F, Jeftinija K, Jeftinija S, Haydon PG. Glutamate-mediated astrocyte–neuron signalling. Nature 1994; 369: 744–747
- Parpura V, Fang Y, Basarsky T, Jahn R, Haydon PG. Expression of synaptobrevin II, cellubrevin and syntaxin but not SNAP-25 in cultured astrocytes. FEBS Lett 1995; 377: 489–492
- Patterson GH, Knobel SM, Sharif WD, Kain SR, Piston DW. Use of the green fluorescent protein and its mutants in quantitative fluorescence microscopy. Biophys J 1997; 73: 2782–2790
- Potokar M, Kreft M, Li L, Andersson JD, Pangršič T, Chowdhury HH, Pekny M, Zorec R. Cytoskeleton and vesicle mobility in astrocytes. Traffic 2007; 1: 12–20
- Rizzoli S O, Richards DA, Betz WJ. Monitoring synaptic vesicle recycling in frog motor nerve terminals with FM dyes. J Neurocytol 2003; 32: 539–549
- Robinson MB. Regulated trafficking of neurotransmitter transporters: common notes but different melodies. J Neurochem 2002; 80: 1–11
- Rothstein JD, Martin L, Levey AI, Dykes-Hoberg M, Jin L, Wu D, Nash N, Kuncl RW. Localization of neuronal and glial glutamate transporters. Neuron 1994; 13: 713–725
- Rothstein JD, Dykes-Hoberg M, Pardo CA, Bristol LA, Jin L, Kuncl RW, Kanai Y, Hediger MA, Wang Y, Schielke JP, Welty DF. Knockout of glutamate transporters reveals a major role for astroglial transport in excitotoxicity and clearance of glutamate. Neuron 1996; 16: 675–686
- Rothstein JD, Patel S, Regan MR, Haenggeli C, Huang YH, Bergles DE, Jin L, Dykes Hoberg M, Vidensky S, Chung DS, Toan SV, Bruijn LI, Su ZZ, Gupta P, Fisher PB. Beta-lactam antibiotics offer neuroprotection by increasing glutamate transporter expression. Nature 2005; 433: 73–77
- Rusakov DA, Kullmann DM. Extrasynaptic glutamate diffusion in the hippocampus: ultrastructural constraints, uptake, and receptor activation. J Neurosci 1998; 18: 3158–3570
- Schote U, Seelig J. Interaction of the neuronal marker dye FM1-43 with lipid membranes. Thermodynamics and lipid ordering. Biochim Biophys Acta 1998; 1415: 135–146
- Schwartz JP, Wilson DJ. Preparation and characterization of type 1 astrocytes cultured from adult rat cortex, cerebellum and striatum. Glia 1992; 5: 75–80
- Smith CB, Betz WJ. Simultaneous independent measurement of endocytosis and exocytosis. Nature 1996; 380: 531–534
- Vesce S, Bezzi P, Volterra A. The active role of astrocytes in synaptic transmission. Cell Mol Life Sci 1999; 56: 991–1000
- Zeigerer A, McBrayer MK, McGraw TE. Insulin stimulation of GLUT4 exocytosis, but not its inhibition of endocytosis, is dependent on RabGAP AS160. Mol Biol Cell 2004; 15: 4406–4415
- Zhang Q, Fukuda M, Van Bockstaele E, Pascual O, Haydon PG. Synaptotagmin IV regulates glial glutamate release. Proc Natl Acad Sci USA 2004; 101: 9441–9446