Abstract
Artificial transformation of Escherichia coli with plasmid DNA in presence of CaCl2 is a widely used technique in recombinant DNA technology. However, exact mechanism of DNA transfer across cell membranes is largely obscure. In this study, measurements of both steady state and time-resolved anisotropies of fluorescent dye trimethyl ammonium diphenyl hexatriene (TMA-DPH), bound to cellular outer membrane, indicated heat-pulse (0°C→42°C) step of the standard transformation procedure had lowered considerably outer membrane fluidity of cells. The decrease in fluidity was caused by release of lipids from cell surface to extra-cellular medium. A subsequent cold-shock (42°C→0°C) to the cells raised the fluidity further to its original value and this was caused by release of membrane proteins to extra-cellular medium. When the cycle of heat-pulse and cold-shock steps was repeated, more release of lipids and proteins respectively had taken place, which ultimately enhanced transformation efficiency gradually up to third cycle. Study of competent cell surface by atomic force microscope showed release of lipids had formed pores on cell surface. Moreover, the heat-pulse step almost depolarized cellular inner membrane. In this communication, we propose heat-pulse step had two important roles on DNA entry: (a) Release of lipids and consequent formation of pores on cell surface, which helped DNA to cross outer membrane barrier, and (b) lowering of membrane potential, which facilitated DNA to cross inner membrane of E. coli.
Introduction
In gene technology, transformation is known as a basic technique. The process involves binding of extra-cellular DNA to cell surface followed by uptake across wall-membrane complex into cell cytoplasm. Transformation occurs naturally in bacterial genus such as Micrococcus, Haemophilus and Bacillus Citation[1], Citation[2]; all these organisms have proteins on their exterior surface whose function is to bind DNA in their environment and transport it into the cell. However, it is still a rare event for most bacteria to naturally uptake DNA from environment.
The discoveries of transferring phage Citation[3] and plasmid Citation[4] DNAs into Escherichia coli cells set the stage for molecular cloning of recombinant DNAs. According to this transfer process, E. coli cells are made competent for DNA uptake by suspending in ice-cold CaCl2 (50–100 mM) and applying a brief heat-shock at 42°C. Even after generation of competence, efficiency of transformation is quite low; majority of DNA cannot enter any cell and majority of cells receive no DNA. Therefore, above original method has been improved with time to different high-transformation-efficiency protocols, employing magnesium ions, manganese ions, dimethyl sulfoxide etc. together with the calcium ions Citation[5], Citation[6]. Besides chemical methods, physical treatment like brief electroshock of high voltage is applied for DNA uptake in E. coli and other bacteria Citation[7].
Even after all such developments, exact mechanism of CaCl2-mediated artificial transformation process is still largely obscure. It is only believed that CaCl2 helps DNA adsorption to cell surface and the heat-shock step facilitates penetration of adsorbed DNA into cell cytosol. Our previous findings Citation[8], Citation[9] show in artificial transformation of E. coli, DNA is bound to lipopolysaccharide (LPS) receptor molecules on cell surface; divalent cation Ca2 + is suggested to form coordination complex with the two negatively charged macromolecules – DNA and LPS. However, it is still unknown how a macromolecule like DNA enters cell cytosol, when molecular weight exclusion limit of outer membrane porins to hydrophilic molecules is approximately 500 daltons Citation[10]. In this context our earlier communication Citation[11] reports the heat-pulse step depolarizes membrane of CaCl2-treated competent cells, which consequently lowers the potential barrier for movement of negatively charged DNA molecules into cell interior. As, membrane potential exists across inner cytoplasmic membrane, question still remains how DNA penetrates across outer membrane of E. coli. The present study suggests the release of lipids from E. coli cell surface by heat-pulse step creates pores, through which the adsorbed plasmid DNA crosses outer membrane barrier.
Of other gram negative bacteria, only Salmonella typhimurium has been characterized with regard to different factors that can influence transformation Citation[12]. Other bacteria are quite unexplored; moreover, there are many other organisms which are very difficult to transform. Therefore, as importance of the present study it can be emphasized that once the hidden mechanism of DNA transfer is understood in E. coli system, the concept can be utilized to explore transformation in other organisms, which are still difficult to transform.
Materials and methods
A genetically engineered highly transformable strain E. coli XL1-Blue Citation[13] and a cloning vector plasmid pUC19 Citation[14] were used in this study. The fluorescent dyes trimethyl-ammonium-diphenyl-hexatriene (TMA-DPH), diphenyl-hexatriene (DPH) and 3,3′-diphenylthiocarbocyanine iodide were purchased from Sigma-Aldrich, USA.
Preparation of competent cells and their transformation with plasmid DNA
Cells were grown to log phase [up to (OD)600nm=0.10 i.e., ∼5×10⁷ cells/ml] in LB-medium, washed with and ultimately concentrated 25 times in ice-cold 100 mM CaCl2 and kept at 0°C for 30 min to make the cells competent for DNA upake Citation[9], Citation[15]. For transformation, pUC19 DNA (no more than 50 ng in a volume of 10 µl) was added to 200 µl competent cell suspension and incubated at 0°C for 30 min. DNA-adsorbed cell suspension was transferred to 42°C for 90 s and was rapidly chilled in ice for 5 min. A volume of 800 µl LB was added to the cells and subsequent incubation at 37°C was allowed for 45 min. Cells were then serially diluted in chilled tryptone broth [TB] Citation[9]. 100 µl cells from properly diluted samples were spread on agar-LB medium with ampicillin (50 µg/ml), to obtain colonies of the transformed cells. Transformation efficiency (TR)E was calculated as the number of transformants per µg of added DNA
Measurement of steady state anisotropy of TMA-DPH bound to outer membrane of competent cells
Steady state anisotropy of fluorescent dye TMA-DPH, bound to outer membrane of intact competent cells, was measured as described in Citation[16]. TMA-DPH (stock solution prepared in DMF) was added to 200 µl competent cells at final concentration of 1.0×10⁻⁶ M. The cell suspension was finally diluted 15 times by adding 2.8 ml of 100 mM ice-cold CaCl2 and was incubated in dark at 0°C for 45 min to allow steady incorporation of dye. Fluorescence intensity and anisotropy were measured in a spectrofluoropolarimeter (LS 50B, Perkin Elmer) and during measurement, temperature was controlled by attaching a circulating water-bath to the instrument. The sample was illuminated with vertically polarized light (340±5 nm) and the steady state anisotropy rs=(III−GI⊥)/(III+2GI⊥) and total intensity I = III+2I⊥ were simultaneously measured at an emission wavelength of 425±5 nm; G is sensitivity factor of the instrument. Corrections for scatted light for both intensity and anisotropy were done according to:
where f (a balanced fluorescence intensity factor) = Ifluo/(Ifluo+Iscatter). Scattered light intensity (Iscatter) and anisotropy (rscatter) were determined by measuring an unlabelled control under the same conditions as that of sample.
Measurement of fluorescence life-time and time-resolved anisotropy of TMA-DPH bound to outer membrane of competent cells
For measurement of fluorescence life-time and time-resolved fluorescence anisotropy, TMA-DPH-labeled cells were excited at 375 nm using a picosecond diode laser (IBH nanoleds) in an IBH Fluorocube apparatus Citation[17], Citation[18]. The emission was collected at a magic angle polarization using a Hamamatsu MCP photomultiplier (5000U-09). Time-correlated single photon counting (TCSPC) setup consisted of an Ortec 9327 CFD and a Tennelec TC 863 TAC. The data was collected with a PCA 3 card (Oxford) as a multi-channel analyzer. The typical full width at half-maxima of the system response using a liquid scatterer was about 90 ps. The fluorescence decays were deconvoluted using IBH DAS6 software. The experiments were done at 0°C and 42°C. To study fluorescence anisotropy decay, analyzer was rotated at regular intervals to get perpendicular (I⊥) and parallel (I||) components and anisotropy function r(t) was calculated using the formula r(t) = I||(t) − GI⊥(t)/I||(t) + 2GI⊥(t); the G value of the picosecond set up was determined to be 1.5, using a probe of very fast rotational relaxation (e.g., coumarin 480 in methanol).
Assay of lipid by measuring fluorescence of embedded DPH
Lipid was assayed by measuring fluorescence of embedded DPH as described in Citation[19]. According to this method, lipid content was directly proportional to intensity of DPH fluorescence. Competent cells were centrifuged to collect the supernatant. In 200 µl of cell supernatant, 2 µl of DPH (from a stock of 0.5 mM in DMF) was added. The mixture was then diluted 15 times by adding 2.8 ml of 100 mM CaCl2 and was incubated in dark for 40 min to allow proper binding of DPH with phospholipid molecules, if any, in the cell supernatant. The intensity of fluorescence of bound DPH was measured in Perkin Elmer LS50B spectrofluorimeter with excitation and emission wavelengths at 350 nm and 440 nm, respectively, keeping both slits at 10 nm.
Assay of protein by Bradford method
Protein was assayed according to Bradford method, described in Citation[20]. Competent cells were centrifuged to collect the supernatant. In 200 µl cell supernatant, 800 ?µl Bradford reagent was added, mixed thoroughly and incubated for 5 min. The absorbance of the mixed solution was measured at 595 nm in Shimadzu UV-1601 spectrophotometer. The protein content in cell supernatant, if any, was proportional to the value of (absorbance)595nm.
Induction and assay of E. coli periplasmic protein Alkaline Phosphatase (AP)
For induction of AP, cells of E. coli XL1Blue were initially grown at 37°C to log phase [up to (OD)600nm=0.2, i.e., ∼108 cells/ml] in tris-glucose medium Citation[21]. The grown cells were washed with and finally suspended in phosphate-free tris-glucose medium to grow further at 37°C for 90 min, when high pool of AP had been induced and stored at the periplasmic space of cell membrane. The induced culture was then washed with and finally re-suspended in 1/25th volume of 100 mM ice-cold CaCl2 to make them competent. Such competent cells were used to study the release of AP at different steps of transformation. AP was assayed according to method of Schlesinger and Levinthal Citation[22]. Competent cells were centrifuged to collect the supernatant. In 1.0 ml of cell supernatant, 2.0 ml of substrate solution (0.2% paranitrophenyl phosphate in 1 M tris-HCl, pH 8.2) was added and subsequent incubation at 37°C was allowed for 15 min to develop yellow colour of paranitrophenol. The enzyme-substrate reaction was terminated by adding 0.5 ml of 13% w/v K2HPO4 and the absorbance was measured at 420 nm. One unit of enzyme was defined as that amount, which led to a change of absorbance of 0.1 per 6.0 min Citation[21].
2D gel electrophoresis of proteins
Competent cells, after subjecting the cold shock step (42°C→0°C), were centrifuged to collect the supernatant. The supernatant were precipitated with four volumes of cold acetone, washed two times with 80% cold acetone and finally suspended in sample buffer Citation[23]. The IPG strips (pH 4.0–7.0) were re-hydrated in a mixture of 200 µl re-swelling solution Citation[23] and 50 µl protein sample. After 12 h in-gel re-hydration, iso-electric focusing was performed with Ettan IPGphor 3 unit (GE Healthcare) employing the voltage profile as described in Citation[23]. The IPG strips were then equilibrated in two steps, each for 15 min, with 10 ml SDS equilibration buffer solution [6 M urea, 75 mM tris-HCl (pH 8.8), 29.3% glycerol, 2% SDS and 0.002% bromophenol blue]; the buffer additionally contained 100 mg DTT in the first step and 250 mg iodoacetamide in the second step. Electrophoresis in second dimension was carried out on 12% SDS-polyacrylamide gels Citation[24] in Hoefer SE 600 Ruby (GE Healthcare), first 1 h in 25 mA and second 4 h in 50 mA. The gel was stained with silver nitrate, according to the method described in Citation[24], scanned by Typhoon 9210 (GE Healthcare) and the image was analyzed by the ‘2-D Image Master’ software (GE Healthcare). 2D protein spots were finally matched with E. coli protein databank.
Study of competent cell surface by Atomic Force Microscope (AFM)
Surface morphology of competent cells was studied, as described in Citation[25], using a scanning probe microscope (Veeco, AP 0100) equipped with a scanner having a maximum XY range of 10 µm by 10 µm. At different steps of transformation, 100 µl of cell aliquot was taken in microfuge tube and any further change of surface morphology was quenched by centrifugation and fixing the cells at 4°C with 2.5% gluteraldehyde for overnight. The fixed cells were washed twice and finally suspended in water. The drop and dry method was used to transfer the bacteria from suspension to a solid support (cover slip), so that a mono-layer of cells is formed. To enhance adhesion of bacterial cells, the cover slip was pretreated with Piranha solution (1:3 ratio of 30% H2O2/concentrated H2SO4) and was washed copiously with de-ionized water before adding the cells. For each specimen, 20 µl bacterial suspension (total no. of cells ∼9×10⁶) was placed on 1 cm2 region of cover slip. After placing the cells, surface was washed thrice with 40 µl distilled water and allowed to dry in air. Height and phase data were captured using tapping mode AFM with standard Vecco phosphorus doped silicon cantilevers having resonance frequencies of 245–284 kHz. Root mean square (RMS) values of roughness were calculated for plane-fitted, flattened images and were used to measure the standard deviation of the height of a given line. All the measurements were done using Vecco ProScan 1.8 software.
Measurement of membrane potential of intact competent cell
Membrane potential was assayed spectrofluorimetrically by measuring fluorescence quenching by intact competent cells as described in Citation[11], Citation[26], Citation[27], using fluorescent dye 3,3′-diphenylthiocarbocyanine iodide. Competent cells were diluted five times by ice-cold 100 mM CaCl2 and a 2.0 µl amount of 1.0 mM fluorescent dye (dissolved in methanol) was added to 3.0 ml of cell suspension in a cuvette with continuous stirring at 4°C. After signal stabilization, fluorescence was measured in spectrofluoropolarimeter (Perkin Elmer – LS50B) with excitation and emission at 556 nm and 575 nm, respectively, keeping both slits at 5.0 nm. The protonophore CCCP (carbonyl cyanide m-chloro phenylhydrazone) was then added to the dye-bound cells (in the cuvette) at a final concentration of 70 µM and after a brief vortexing, fluorescence was measured again as above. Relative membrane potential was calculated as: 100[1-(b-a)/(c-a)], where ‘a’ was the fluorescence intensity with cells only, ‘b’ was that with (cells + dye) and ‘c’ with (cells + dye + CCCP).
The data points in each figure correspond to the average of at least five independent experiments.
Results and discussion
The sequence of steps involved in standard transformation procedure was: (a) Generation of competence for DNA uptake by suspending exponentially growing cells in 100 mM CaCl2 at 0°C for 30 min; (b) addition of plasmid DNA to competent cells and allowing adsorption of DNA to cell surface for 30 min; (c) administration of a heat-pulse (0°C→42°C) to the DNA-adsorbed cells for 90 s; (d) bringing back the cells further in ice (equivalent to a cold-shock) and incubating there for 5 min; (e) allowing growth of the cells at 37°C for 45 min for phenotypic expression of antibiotic resistant gene(s) of plasmid; and (f) serial dilution and subsequent plating under selection pressure of antibiotic(s). Of the above steps, the first four were believed to be responsible, through unknown mechanisms, for adsorption and penetration of plasmid DNA into the cell. In this study, to understand the mechanism of DNA penetration through competent cell membranes, experiments were carried out to observe change in characteristics of cell membranes after each of the following three steps – competence generation, heat-pulse and cold shock.
In order to study membrane fluidity/rigidity, ice-cold competent cells were labeled with fluorophore TMA-DPH and steady state fluorescence anisotropy was measured at different steps of transformation. shows for competent cells initially kept at 0°C, the value of steady state anisotropy of TMA-DPH was 0.239 (±0.014). After shifting the cells from 0–42°C and keeping there for 90 s, anisotropy increased to the value of 0.336 (±0.021). When heat-pulsed cells were further brought back to 0°C, anisotropy had decreased to 0.241 (±0.013), i.e., almost to its initial value. Steady state anisotropy of a fluorophore in any fluid environment was known to be inversely proportional to fluidity of the environment. Therefore, increase of anisotropy signified heat-pulse step of transformation process had rigidified outer membrane of competent cells. The result also shows subsequent cold-shock step fluidized membrane again to its initial state. further shows when the cycle of heat-pulse and cold-shock steps was repeatedly administered on competent cells, rigidification and fluidization of outer membrane had occurred alternatively, and almost similar extent of changes in steady state anisotropy implied heat-pulse and cold shock steps had complete reversible effect on cellular outer membrane.
Figure 1. Steady state anisotropy of TMA-DPH bound to outer membrane of CaCl2-treated competent cells of E. coli XL1Blue, when the cells were subjected to repetitive heat-pulse (0°C→42°C) and cold-shock (42°C→0°C) steps of the transformation process.
In order to get more detailed information about microenvironment of outer membrane of competent cells, fluorescence life-time and time-resolved fluorescence anisotropy of TMA-DPH were measured after each of the competence generation, heat-pulse and cold-shock steps of transformation procedure. The fluorescence intensity decay of TMA-DPH could be satisfactorily recovered in terms of a double exponential decay model, I(t) = A1 exp (−t/τ1) + A2 exp (−t/τ2). A shows the bi-exponential decays of TMA-DPH fluorescence comprised of two components – one with life-time of faster decay rate τ2=500–900 picoseconds (ps) and other with life-time of slower decay rate τ1=3–5 nanoseconds (ns). A signifies when competent cells were transferred from 0–42°C for 90 s, life-times of both the components had been increased, and when the same cells were brought back to 0°C and kept there for 5 min, the life-time of each component had been decreased to a value, slightly lower than its initial value. This result implied heat-pulse step of transformation process had made the microenvironment of the fluorescent probe so rigid that fluorescence decay rate of the probe had been slowed down. On other hand, subsequent cold-shock step reverted back the microenvironment nearly to its initial state, i.e., the cold-shock fluidized cell membrane, which consequently made fluorescence decay rate faster. Thus the result of fluorescence life-time measurement of TMA-DPH, bound to outer membrane of intact competent E. coli cells, corroborated the result obtained from measurement of steady state anisotropy.
Figure 2. Pulse excitation fluorescence of TMA-DPH bound to outer membrane of E. coli XL1Blue cells after the steps of competence generation (at 0°C), heat-pulse (0°C→42°C) and cold-shock (42°C→0°C). (A) Fluorescence life-times of TMA-DPH; (B) Time-resolved anisotropies of TMA-DPH.
Study of time-resolved fluorescence anisotropy was carried out in such a way that zero time anisotropy (r0) had been fixed to the value 0.4 (the fluorescence anisotropy of TMA-DPH in frozen medium). B shows time-resolved decays of anisotropy at different steps of transformation. For competent cells, initially kept at 0°C, r0 value decayed with a time constant of 1.34×10⁻¹⁰. When such competent cells were administered heat pulse of 42°C for 90 s, anisotropy had decayed down at a slower rate with time constant of 2.35×10⁻⁹. Shifting of heat-pulsed cells further to 0°C made decay of anisotropy again faster, lowering down the value of time constant to 1.59×10⁻¹⁰. In all three cases, anisotropy did not decay to zero, rather had a residual value (rα). The value of rα at 42°C was greater than both the values – that at initial 0°C before heat-pulse and that at final 0°C after heat-pulse. However, residual anisotropy at final 0°C was greater than that at initial 0°C. The existence of limiting anisotropy (rα) could be interpreted as the hindrance in rotational motion of TMA-DPH in membrane microenvironment of competent cells. If the rotation of TMA-DPH molecule in membrane remained unhindered up to a certain angle (θc), then rα, r0 and θc were known to be related as: rα/r0=[(3 Cos2θ − 1)/2]2. At each of the three steps of transformation process, value of θc was determined to be 22.9°C (at initial 0°C), 21.8°C (90 s after heat-pulse) and 22.1°C (5 min after cold-shock). The values of θc signified rotational motion of fluorophore had been maximally hindered at 42°C, or in other words, heat-pulse step made outer membrane of competent cell qualitatively rigid. Moreover, values of θc for cells kept at 0°C, before and after heat-pulse step, implied fluidization of cell membrane.
For intact E. coli cells, membrane fluidity was reported to be directly proportional to the lipid to protein ratio of membrane Citation[28]; i.e., the more was the value of the ratio, the more was the membrane fluidity and vice versa. Therefore, in order to find out the reason behind rigidification and fluidization of outer membrane of transformation-competent E. coli cells due to heat-pulse and cold-shock steps respectively, studies were performed to investigate if any changes in lipid and protein profiles of intact cell membrane had taken place by the said steps of transformation process. Instead of direct measurement of lipid and protein contents of membrane, extra-cellular medium was assayed for presence of lipid and protein molecules, if any, that had been released from membrane. The lipid was monitored by measuring DPH fluorescence and the protein was assayed using Bradford method. A and 3B represent the profiles of lipid and protein release respectively. Both Figures show after competence generation (i.e., after incubation of cells in 100 mM CaCl2 at 0°C for 30 min), release of both lipids and proteins took place from competent cells to extra-cellular medium. When heat-pulse (0°C→42°C) was applied to competent cells for 90 s, further release of lipids (A), but no protein (B), had occurred. On other hand, application of cold-shock (42°C→0°C) to the cells for 5 min had released proteins only (B), but no lipid (A). These results implied release of lipid molecules by heat-pulse step had decreased lipid to protein ratio, ultimately rigidifying cell membrane; in contrast, release of protein molecules by cold-shock step had apparently increased lipid to protein ratio, causing fluidization of cell membrane. When the cycle of heat- and cold-shocks was repeatedly applied on competent cells, release of lipid and protein molecules respectively, had occurred in every cycle (), and cumulative effect of release had caused alternate rigidification and fluidization of outer membrane in every cycle, as was observed from the results of steady state anisotropy experiment ().
Figure 3. (A) DPH fluorescence, as a measure of lipid release from competent cell surface. (B) Result of Bradford assay, as a measure of protein release from competent cell surface, when cells were subjected to repetitive heat-pulse (0°C→42°C) and cold-shock (42°C→0°C) steps.
In order to check whether released proteins were membrane bound or cytoplasmic in nature, studies were concentrated over three proteins of E. coli – inducible periplasmic protein alkaline phosphatase (AP), inducible cytoplasmic protein D-serine deaminase and inner membrane protein F0/F1 ATPase. A shows when previously induced AP-containing cells were made competent by suspending them in 100 mM ice-cold CaCl2 for 30 min, AP had been secreted out to extra-cellular medium. The application of heat-pulse to competent cells did not further increase the extent of AP secretion, whereas subsequent application of cold-shock to the heat-pulsed cells had increased the level of AP secretion. When the experiment was carried out on previously induced D-serine deaminase-containing cells (prepared as described in Sarkar et al. Citation[8]), neither of competence generation, heat-pulse nor cold-shock steps had released any D-serine deaminase (result not shown). Similarly, when cell supernatant was assayed for the presence of F0/F1 ATPase, as described in Citation[29], no release of the enzyme had occurred in any of the three steps of transformation process (data not shown). The above results implied artificial transformation process had disintegrated outer membrane of E. coli cells, for which release of periplasmic AP took place; however, inner cytoplasmic membrane had remained intact, for which no release of either the cytoplasmic protein D-serine deaminase or the inner membrane protein F0/F1 ATPase took place. Moreover, disintegration of outer membrane caused release of many other periplasmic/outer membrane proteins, like that of AP. This was observed when cell supernatants, collected at different steps of transformation, were electrophoresed in SDS-polyacrylamide gel Citation[24]. Multiple protein bands in lane A of B signified release of proteins had occurred at the initial steps of competence generation. Protein bands in lane B were equally intense as those in lane A, which indicated no additional release of proteins had taken place after heat pulse step on competent cells. On other hand, enhanced intensity of bands in lane C implied further release of proteins after the cold shock step.
Figure 4. (A) Release of AP from the surface of E. coli XL1Blue cells after the steps of competence generation (at 0°C), heat-pulse (0°C→42°C) and cold-shock (42°C→0°C). (B) SDS-Polyacrylamide gel (12%) electrophoretic pattern of cell supernatants. Lane a: supernatant of cells suspended in 100 mM CaCl2 and kept at 0°C for 30 min; lane b: supernatant of CaCl2-treated competent cells after heat-pulse step and lane c: supernatant of competent cells after cold-shock step. (C) 2D gel electrophoresis pattern of the supernatant of competent cells after the cold-shock step.
Furthermore, the 2D gel electrophoresis pattern of the supernatant of the competent cells, after the cold shock step, showed the presence of the outer membrane proteins like Ag43 (1), OmpA (2, 3), OmpC (4), OmpF (5), NmpC (6), Tsx (7), TeaF (8), OmpW (9) and the periplasmic proteins like malE (10), rbsB (11), dsbA (12), OsmY (13), yjbP (14).
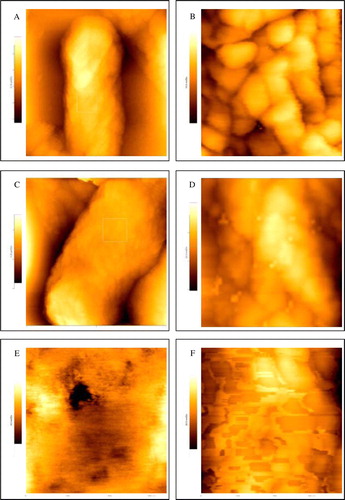
The release of lipid and protein molecules was expected to produce pores on competent cell surface. The surface morphology of E. coli XL1 Blue cell was, therefore, studied using AFM at different steps of artificial transformation. To observe the effect of CaCl2-mediated competence generation on cell morphology, control experiment was done with cells, suspended in ice-cold phosphate buffer. In order to select desired cells for higher resolution imaging, a large scan area (2×2 µm2) was first done. For cells suspended in ice-cold phosphate buffer, individual bacterium, represented by image A of , contained its rod-shaped character with a typical length of 2–3 µm; the corresponding width and height were 1 and 0.8 µm respectively. The two-dimensional image (B) of A, at nanometer resolution (0.35×0.35 µm2), exhibited bumps with lateral dimension of 40–80 nm and average surface roughness of 5.8±0.14 nm on outer membrane of cells. The bumps were reported to be due to LPS assembly in outer membrane and difference in heights of the bumps was suggested to be due to different O-antigen units at the termini of LPS molecules Citation[25]. In comparison to control cells in phosphate buffer (A), the shape and size of competent cells in 100 mM CaCl2 remained unchanged (C); however, packing of LPS of competent cells changed considerably (D). Image D shows after generation of competence, average surface roughness increased to 7.9±0.19 nm. The heat-pulse step made cell surface more rough (8.5±0.43) with appearance of pores (E); average width and depth of pores were 70 nm and 7 nm, respectively. When the heat-pulsed cells were subsequently subjected to cold-shock step, average roughness of cell surface further increased to 11.4±0.62, but pores disappeared (F); a large area of outer membrane had decreased in height. Fludization of outer membrane (due to release of proteins) by cold-shock step was perhaps responsible for disappearance of the pores. The result of this study indicated that in the artificial transformation process of E. coli, plasmid DNA crossed outer membrane barrier possibly through the pores formed by heat-pulse step.
Figure 5. AFM images of the native E. coli XL1 Blue cell in phosphate buffer (images A & B), after generation of competence in 100 M CaCl2 at 0°C (images C & D), after heat pulse at 42°C for 90 s (image E) and after cold shock at 0°C for 5 min (image F). The scanning area of the images A and C of entire bacteria were 2×2 µm2. Two dimensional images B, D, E and F were acquired by zooming into the boxed area (0.7×0.7 µm2) of the images A and C. In every case 15 individual cells were studied. This Figure is reproduced in colour in Molecular Membrane Biology online.
When the cycle of heat- and cold-shocks was repeated on competent cells, release of lipids and proteins had taken place in each cycle (). Therefore, with gradual increase of the number of cycles, the pore formation on outer membrane had also increased. In the process of transformation, if these pores truly made the passage for DNA penetration across outer membrane, transformation efficiency (TR)E of cells with plasmid DNA should have been increased with repetition of alternate heat-pulse and cold-shock steps. The experimental results, shown in , corroborated this proposition, i.e., with repetition of cycles, (TR)E increased at least up to third cycle, above which saturation in (TR)E appeared. shows when DNA-adsorbed competent cells at 0°C, without applying heat- and cold-shock steps, was directly brought to the next step of transformation, i.e., shifted to LB for allowing growth at 37°C, the cells had shown certain value of (TR)E. This result apparently implied heat-pulse step had no exclusive role on DNA entry rather, pores on competent cell surface were sufficient to uptake DNA. However, even after the omission of heat-pulse (0°C→42°C) step, cells experienced a considerable heat-shock when shifted from 0–37°C (to allow growth for phenotypic expression of antibiotic resistance marker on plasmid) and this step had perhaps facilitated transfer of adsorbed DNA into cell cytosol. In support of this view, it would be justified to refer our earlier communication Citation[11], where we reported membrane depolarization by the heat-pulse step had facilitated DNA entry into the cell and the depolarization had occurred nearly to the same extent by shifting competent cells from 0–42°C or 37°C. also shows the value of (TR)E after heat-pulse step was nearly twice of that under no heat-pulse condition and the cold-shock step, by which the pores were found to disappear (F), had no additional effect on (TR)E. Moreover, when the cycle of heat-pulse and cold-shock was repeated on DNA-adsorbed competent cells, (TR)E at second cycle was almost double of that at first cycle and (TR)E at third cycle was slightly greater than that at second cycle, indicating a saturation effect. Excessive pore formation after third cycle perhaps made the (TR)E to attain its maximum saturation value.
Figure 6. (TR)E of the CaCl2-treated competent cells of E. coli XL1Blue, when the cells were subjected to repetitive heat-pulse (0°C→42°C) and cold-shock (42°C→0°C) steps.
The original method of competence induction by CaCl2 treatment was a low transformation-efficiency-protocol, where (TR)E was found to be ∼106 transformants per µg of DNA. In order to improve the order of efficiency, different chemical methods had been developed later on. One of the high transformation efficiency chemical methods was developed by Inoue et al. Citation[30], where (TR)E was ∼108 transformants per µg of DNA. The standard transformation buffer of 100 mM CaCl2 was replaced, in the Inoue method, by a buffer containing 15 mM CaCl2, 55 mM MnCl2, 250 mM KCl and 10 mM PIPES (pH 7.6). Here also, rigidification of outer membrane of competent cells due to exclusive release of lipids by heat-pulse step and fluidization of the membrane due to exclusive release of proteins by cold-shock step had taken place (data not shown).
There is a report Citation[5] showing (TR)E to be maximum when cells were made competent with CaCl2 of strength 40–100 mM; with lowering of the concentration of CaCl2 below 40 mM, gradual decrease of (TR)E took place. In order to investigate the reason, the steady state anisotropy study was carried out at each step of transformation process by treating cells with CaCl2 of different molarities. shows that in between 40 and 100 mM CaCl2, the extent of changes of steady state anisotropy by heat-pulse and cold-shock steps were nearly the same at every molarity of CaCl2. The measure of release of lipids and proteins (data not shown) also corroborated this result. However, at 10 mM CaCl2, anisotropy increased by heat-pulse step; but the extent of increase was much less compared to that in case of 40–100 M CaCl2 (). This was due to proportional fall of lipid release at 10 mM CaCl2 (data not shown) and thus less rigidification of outer membrane caused less (TR)E. also shows at 1 mM CaCl2, a reversal of change of anisotropy had taken place, i.e., the membrane had been fluidized by heat-shock step and rigidified by cold-shock step. Similar changes of anisotropy was also observed when, instead of 1 mM CaCl2, cells had been suspended in ordinary phosphate buffer. Moreover, in case of 1 mM CaCl2 or phosphate buffer, even after change of anisotropy, no release of lipids or proteins were found to occur (data not shown), which ultimately made the (TR)E to be nil in either of the cases. In these cases, transfer of cells from 0°C to a temperature 42°C, higher than the lipid transition temperature, perhaps made the lipids more fluid, which had caused outer membrane fluidization by the heat-pulse step, even after no release of lipid or protein from cell surface.
Figure 7. Steady state anisotropy of TMA-DPH bound to outer membrane of E. coli XL1Blue cells (suspended in CaCl2 of different molarities) after the steps of competence generation (at 0°C), heat-pulse (0°C→42°C) and cold-shock (42°C→0°C).
Our results indicated the more was the extent of rigidification of outer membrane of E. coli cell, the more was its (TR)E. For more evidential support of this phenomenon, experiments like measurement of steady state anisotropy and (TR)E were carried out on cells previously treated separately with two chemicals such as: (i) ethanol, an agent known to rigidify Citation[28], and (ii) benzyl alcohol, an agent known to fluidize Citation[31] E. coli outer membrane. For the studies, CaCl2-treated competent cells were separately incubated with 5% v/v ethanol and 30 µM benzyl alcohol for 30 min at 0°C. Cells were then centrifuged down and were re-suspended in fresh 100 mM CaCl2. A part of each cell suspension was subjected to heat-pulse (0°C→42°C) and cold-shock (42°C→0°C) steps and steady state anisotropy of TMA-DPH was measured at each of the steps; whereas residual parts of the cells were used to measure (TR)E. A shows at each different temperature (0°C→42°C→0°C), the value of steady state anisotropy in case of ethanol-pretreated cells was greater than that in case of untreated control cells; on other hand, the values in case of benzyl alcohol-pretreated cells were less than those in case of untreated control cells. This result indicated ethanol-pretreated cells were more rigid, where as benzyl alcohol-pretreated cells were more fluid than control cells at every temperature between 0°C and 42°C. B shows (TR)E of control cells was lower than that of ethanol-pretreated cells, but higher than that of benzyl alcohol-pretreated cells. The result of this study clearly implied that in case of E. coli cells, transformation efficiency increased with rigidification of outer membrane.
Figure 8. (A) Steady state anisotropy of TMA-DPH bound to outer membrane of E. coli XL1Blue cells (previously treated with 5% (v/v) ethanol and 30 µM benzyl alcohol separately) after the steps of competence generation (at 0°C), heat-pulse (0°C→42°C) and cold-shock (42°C→0°C). (B) (TR)E of E. coli XL1Blue cells previously treated with 5% (v/v) ethanol and 30 µM benzyl alcohol separately.
In an earlier communication Citation[11] we reported that by heat-pulse step (0°C→42°C for 90 s) of transformation process, membrane potential of intact competent cells suddenly dropped down from (-) 120 mV to (-) 10 mV; and by subsequent cold-shock step (42°C→0°C for 5 min), potential further increased to its original value. Here, we report that when CaCl2-treated competent cells were subjected to repeated cycles of heat-pulse and cold-shock steps, alternate depolarization (decrease of potential) and polarization (increase of potential) of plasma membrane of intact competent cells had taken place (). Therefore, a close look on the results of the studies on steady state anisotropy, membrane potential and (TR)E indicated heat-pulse step of standard transformation procedure had simultaneously caused: (a) rigidification of outer membrane () by releasing lipids from cell surface (A), (b) depolarization of inner membrane (), and (c) enhancement of (TR)E () or in other words facilitation of DNA entry in intact competent E. coli cells. The subsequent cold-shock step although fluidized outer membrane and polarized inner membrane, however, this step had no significant role on change of (TR)E, i.e., on DNA entry.
Figure 9. Membrane potential of competent cells of E. coli XL1Blue, when the cells were subjected to repetitive heat-pulse (0°C→42°C) and cold-shock (42°C→0°C) steps.
The results of this study led us to propose the following model to explain the obscure mechanism of DNA entry during artificial transformation of E. coli with plasmid DNA. According to our proposition – the heat-pulse step of standard CaCl2-mediated transformation process rigidified outer membrane by releasing lipids and thus produced pores on cell surface through which previously adsorbed plasmid DNA molecules crossed outer membrane barrier; moreover, the heat-pulse-mediated depolarization of inner plasma membrane eventually lowering the negativity of cell inside potential, decreased the potential barrier for movement of negatively charged DNA molecules into cell interior.
Acknowledgements
For financial assistance, we are indebted to the Department of Biotechnology, (project no. BT/PR3418/BRB/10/287/2002) and the Department of Science and Technology (FIST programme, 2001–2011), Govt. of India. We also acknowledge the Indian Association for the Cultivation of Sciences (IACS), Kolkata, for providing us the pico-second laser facility procured from the grant no. IR/I-1/CF-01/2002 of the Department of Science and Technology, Govt. of India. Declaration of interest: The authors report no conflicts of interest. The authors alone are responsible for the content and writing of the paper.
References
- Michod RM, Wojciechowski M, Hoelzer M. DNA repair and the evolution of transformation in the bacterium Bacillus subtilis. Genetics 1988; 118: 31–39
- Redfield RJ. Evolution of bacterial transformation: is sex with dead cells ever better than no sex at all?. Genetics 1988; 119: 213–221
- Mandel M, Higa A. Calcium dependent bacteriophage DNA infection. J Mol Biol 1970; 53: 159–162
- Cohen S, Chang A, Hsu L. Nonchromosomal antibiotic resistance in bacteria. Proc Natl Acad Sci USA 1972; 69: 2110–2114
- Hanahan D. Studies on transformation of E. coli with plasmids. J Mol Biol 1983; 166: 557–580
- Hanahan D, Jessee J, Bloom FR. Plasmid trasformation of E. coli and other bacteria. Meth Enzymol 1991; 204: 63–113
- Neumann E, Schaefer-Ridder M, Wang W, Hofschneidr P. Gene transfer in mouse lyoma cells by electroporation in high electric fields. EMBO J 1982; 7: 841–845
- Sarkar S, Choudhuri S, Basu T. Ethanol-induced enhancement of the transformation of E. coli by plasmid DNA. Ind J Biotechnol 2002; 1: 209–211
- Sarkar S, Choudhuri S, Basu T. Mechanism of artificial transformation of E. coli with plasmid DNA – clues from the influence of ethanol. Curr Sci 2002; 83: 1376–1380
- Nikaido H, Vaara M. Outer membrane. Escherichia coli and Salmonella typhimurium. Cellular and molecular biology, FC Neidhardt. American Society for Microbiology, Washington, DC 1987; 7–22
- Panja S, Saha S, Jana B, Basu T. Role of membrane potential on artificial transformation of E. coli with plasmid DNA. J Biotech 2006; 127: 14–20
- MacLachian PR, Sanderson KE. Transformation of Salmonella typhimurium with plasmid DNA: differences between rough and smooth strains. J Bacteriol 1985; 161: 442–445
- Sambrook J, Rusell DW. Working with bacteriophage M13 vectors. Molecular cloning3rd ed, J Sambrook, DW Rusell. Cold Spring Harbor Laboratory Press, New York 2001; 1: 3.12
- Sambrook J, Rusell DW. Vectors and bacterial strains. Molecular cloning3rd ed, J Sambrook, DW Rusell. Cold Spring Harbor Laboratory Press, New York 2001; 3: A3.3
- Sambrook J, Rusell DW. Plasmids and their usefulness in molecular cloning. Molecular cloning3rd ed, J Sambrook, DW Rusell. Cold Spring Harbor Laboratory Press, New York 2001; 1: 1.116–1.118
- Kuhry JG, Duportail G, Bronner C, Laustriat G. Plasma membrane fluidity measurement on whole living cells by fluorescence anisotropy of trimethylammoniumdiphenylhexatriene. Biochim Biophys Acta 1985; 845: 60–67
- Ghosh S, Adhikari A, Mandal U, Dey S, Bhattacharyya K. 2007. Excitation wavelength dependence of solvation dynamics in a gel. (PEO)20-(PPO)70-(PEO)20 triblock copolymer. J Phys Chem ( in press).
- Herman P, Konopasek I, Plasek J, Svobodova. 1994. Time-resolved polarized fluorescence studies of the temperature adaptation in Bacillus subtilis using DPH and TMA-DPH fluorescent probe. Biochim Biophys Acta 1190:1–8.
- Waschuk SA, Elton EA, Darabie AA, Fraser PE, McLaurin J. Cellular membrane composition defines Aj3-lipid interactions. J Biol Chem 2001; 276: 33561–33568
- Bradford MM. A rapid and sensitive method for the quantitation of microgram quantities of protein utilizing the principle of protein-dye binding. Anal Biochem 1976; 72: 248–254
- Basu T, Poddar RK. Over expression of inducible proteins in Escherichia coli by treatment with ethanol. Biochem Mol Biol Int 1997; 41: 1093–1100
- Schlesinger MJ, Levinthal C. Hybrid protein formation of E. coli alkaline phosphatase leading to in vitro complementation. J Mol Biol 1963; 7: 1–12
- Tebbe A, Klein C, Bisle B, Siedler F, Scheffer B, Garcia-Rizo C, Wolfertz J, Hickmann V, Pfeiffer F, Oesterhelt D. Analysis of the cytosolic proteome of Halobacterium salinarum and its implication for genome annotation. Proteomics 2005; 5: 168–179
- Sambrook J, Rusell DW. SDS-polyacrylamide gel electrophoresis of proteins. Molecular cloning3rd ed, J Sambrook, DW Rusell. Cold Spring Harbor Laboratory Press, New York 2001; 3: A8.40–A8.51
- Amro NA, Kotra LP, Mesthrige KW, Bulychev A, Mobashery S, Liu GY. High-resolution atomic force microscopy studies of the Escherichia coli outer membrane: structural basis for permeability. Langmuir 2000; 16: 2789–2796
- Hiraoka S, Nukui K, Uetake N, Ohta A, Shibuya I. Amplification and substantial purification of cardiolipin synthase of E. coli. J Biochem 1991; 110: 443–449
- O'Keefe DO, Coolier RJ. Cloned diptheria toxin with the periplasm of E. coli causes lethal membrane damage. Proc Natl Acad Sci USA 1989; 86: 343–346
- Dombek KM, Ingram LO. Effects of ethanol on the Escherichia coli plasma membrane. J Bacteriol 1984; 157: 233–239
- Riondet C, Cachon R, Wache Y, Alcaraz G, Divies C. Changes in the proton-motive force in Escherichia coli in response to external oxidoreduction potential. Eur J Biochem 1999; 262: 595–599
- Inoue H, Nojima H, Okayama H. High efficiency transformation of Escherichea coli with plasmids. Gene 1990; 96: 23–28
- Horvath I, Glatz A, varvasovszki V, Torok Z, Pali T, Balogh G, Kavocs E, Nadasdi L, Benko S, Joo F, Vigh L. Membrane physical state controls the signaling mechanism of the heat shock response in Synechocystis PCC 6803: Identification of hsp 17 as a ‘fluidity gene’. Proc Natl Acad Sci USA 1998; 95: 3513–3518