Abstract
Membrane protein function and stability has been shown to be dependent on the lipid environment. Recently, we developed a high-throughput computational approach for the prediction of membrane protein/lipid interactions. In the current study, we enhanced this approach with the addition of a new measure of the distortion caused by membrane proteins on a lipid bilayer. This is illustrated by considering the effect of lipid tail length and headgroup charge on the distortion caused by the integral membrane proteins MscS and FLAP, and by the voltage sensing domain from the channel KvAP. Changing the chain length of lipids alters the extent but not the pattern of distortion caused by MscS and FLAP; lipid headgroups distort in order to interact with very similar but not identical regions in these proteins for all bilayer widths investigated. Introducing anionic lipids into a DPPC bilayer containing the KvAP voltage sensor does not affect the extent of bilayer distortion.
Introduction
In the majority of genomes ∼25% of open reading frames code for membrane proteins Citation[1], which underlines their importance for cellular function. Membrane proteins function in the lipid environment of the membrane, and their insertion into the membrane must occur without compromising its effectiveness as a permeability barrier. It is therefore unsurprising that membrane proteins’ structure and function is dependent on interactions with lipids. A number of different properties of the lipid bilayer have been shown experimentally to affect the activity of membrane proteins, including hydrophobic width, lipid phase and lipid headgroup structure Citation[2–10]. A full understanding of membrane protein function therefore requires an understanding of the effect that the protein has on a lipid bilayer.
Molecular dynamics (MD) simulations can be used to model protein-lipid interactions, providing detailed information at the molecular level to complement experimental structural studies Citation[11], Citation[12]. Atomistic approaches, which explicitly represent all atoms in a system, provide considerable detail Citation[13], Citation[14] but with current computational resources are limited to time scales of ∼100 ns, which limits the extent to which protein/lipid interactions may be sampled Citation[15]. Meanwhile, coarse-grained (CG) methods provide access to longer time scales, and allow the simulation of larger systems Citation[16–18]. A number of methods which treat the lipid bilayer as a hydrophobic slab have produced predictions of the position of membrane proteins in the bilayer Citation[19–24]. However, these do not fully reproduce the complexity of the bilayer, particularly its deformability. Recently, we published a high-throughput self-assembly CGMD approach to predicting membrane protein position in the bilayer, allowing comparative analyses of protein/lipid interactions Citation[25], Citation[26]. This paper presents an extension to this analysis focusing on how membrane lipid type affects the degree of bilayer deformation around the protein. This is relevant in the context of a number of experimental studies (reviewed in e.g., Citation[8], Citation[27]; also see, e.g., Citation[28]) of protein/lipid interactions and their functional relevance.
The effect of lipid tail length on the degree of distortion in the lipid bilayer is considered for two example proteins: the 5-lipoxygenase activating protein (FLAP) is involved in the synthesis of leukotrienes, which binds to a lipid-soluble substrate (arachidonic acid) which is subsequently transferred to 5-lipoxygenase Citation[29], Citation[30]; and the mechanosensitive channel of small conductance (MscS) Citation[31], which is a well-characterized mechanosensitive channel which protects Escherichia coli from osmotic shock by opening in response to a sudden increase in transmembrane pressure Citation[32]. FLAP was chosen owing to an unusual position of the binding site in the transmembrane region Citation[33]; previous work (unpublished) on MscS had indicated that it caused notable distortion on a dipalmitoylphosphatidylcholine bilayer. In a third example, the voltage-sensor from the voltage-gated potassium channel KvaP was considered Citation[34], by examining the effect of changing the lipid headgroup charge on the degree of bilayer distortion. The voltage sensor consists of four transmembrane segments and is unusual in that the fourth segment (S4) contains several basic amino acids, which act as primary elements of voltage sensing Citation[35], Citation[36]. Both atomistic and CG simulations have suggested that the S4 contributes to local bilayer deformation which allows the charged residues to interact with polar headgroups and water Citation[37–41].
Methods
The CG parameters for lipid and water molecules and Na+ and Cl− counterions have been described previously Citation[16]. The CG parameters for amino acids were as described Citation[42]. Briefly, one CG particle represents approximately four atoms and the protein backbone is represented by one particle with 0–3 side chain particles, depending on residue type. The CG representation of the protein was generated from the atomistic model obtained from X-ray diffraction or NMR crystallography. The proteins used were FLAP (pdb code 2Q7R), MscS (2OAU), and the voltage sensor (1ORS). The protein structure was maintained using an elastic network model with harmonic restraints applied between all backbone particles closer than 7 Å in the starting configuration. The lipids used to vary the bilayer width were dilauroylphosphatidylcholine (DLPC), dipalmitoylphosphatidylcholine (DPPC), and distearylphosphatidylcholine (DSPC), which have the same headgroup structure but have 12, 16 and 20 carbon atoms in each tail, respectively. The lipids used to vary the headgroup charge were DPPC and dipalmitoylphosphatidylglycerol (DPPG); these have identical tail lengths but DPPC has a zwitterionic headgroup whereas DPPG is anionic.
Following generation of the CG protein representation the system was prepared for simulation by the addition of randomly positioned CG lipid molecules followed by water and sufficient CG ions to ensure that the overall charge of the system was zero. Box sizes and the number of lipids used are listed in . The system was subjected to fewer than 1000 steps of energy minimisation to relax any steric clashes.
Table I. Lipid types, lipid numbers and box sizes used in simulations.
All simulations were performed using GROMACS Citation[43] (www.gromacs.org). Lennard-Jones interactions were smoothly shifted to zero between 9 and 12 Å, and electrostatic interactions were shifted to zero between 0 and 12 Å. Simulations were performed at constant pressure, temperature and number of particles; the pressure was 1 bar and the temperature 323 K. The temperature of the protein, lipid and solvent were coupled separately using the Berendsen algorithm Citation[44]. A coupling constant of τp=1 ps was used, with compressibility of 5×10⁻⁶ bar−1. Timesteps were 20–40 fs.
Analysis was performed only on the last 100 ns of each simulation to allow for equilibration. In the analysis of bilayer distortion the position of the protein was fixed in the x-y plane allowing identification of the areas of the protein which caused specific distortion. 5×5 Å2 bins were defined relative to the centre of mass of the protein. The distance of the phosphate headgroups above or below the bilayer centre of mass was recorded for each bin every 400 ps, and the average for each bin was taken over the period analysed (described above). Analysis was performed using tools that are part of the GROMACS package and in-house software.
Results
The coarse-grain database
An overview of the data in the coarse-grain database (CGDB, http://sbcb.bioch.ox.ac.uk/cgdb/index.php) has been presented elsewhere Citation[25], Citation[26]. The aim of this paper is to describe an extension of the analysis focusing on the perturbation of the lipid bilayer seen with a number of different lipids. Briefly, we discuss the data set available in the CGDB, and illustrate how it may be used by considering the effect of changing the lipid tail length on two example proteins, FLAP and MscS. We also consider the effect of changing the lipid headgroup charge on the distortion caused by the voltage sensor.
The CGDB contains predictions of the position of membrane proteins in the lipid bilayer, currently for 126 protein structures. For each simulation the following data is provided: (i) An image of the final snapshot of each simulation showing the protein's backbone structure and the lipid headgroups; (ii) the coordinates of the final frame in the simulation; (iii) graphs showing the root mean square deviation of the backbone C-alpha particles from the starting structure as a function of time; graphs showing the root mean square fluctuation of each residue away from its average position over the simulation; (iv) a graphical representation of the protein with each residue coloured according to the amount of the simulation time it interacts with the lipid headgroups; and (v) a table containing data for each residue, including the fraction of the simulation time the residue interacts with lipid headgroups and tails, the total number of contacts each residue makes with lipid headgroups and tails and the height of the residue in the plane of the bilayer (). In addition, contour plots are calculated to illustrate the distance of the phosphate headgroups above and below the bilayer centre of mass in the upper and lower leaflets, allowing identification of the regions of the protein that cause significant distortion of the lipid bilayer. The data are available for download, allowing further analysis and comparison of sets of proteins.
Figure 1. The Coarse-Grain Database. This Figure shows a screen shot of the database entry for a ligand gated ion channel from E. chrysanthemi Citation[50] pdb code 2VL0. Each of the picture ‘tabs’ provides a link to downloadable data files.
![Figure 1. The Coarse-Grain Database. This Figure shows a screen shot of the database entry for a ligand gated ion channel from E. chrysanthemi Citation[50] pdb code 2VL0. Each of the picture ‘tabs’ provides a link to downloadable data files.](/cms/asset/5d484bbd-ab21-4a0e-b403-d069526eac5b/imbc_a_344821_f0001_b.jpg)
The effect of lipid tail length on bilayer perturbation
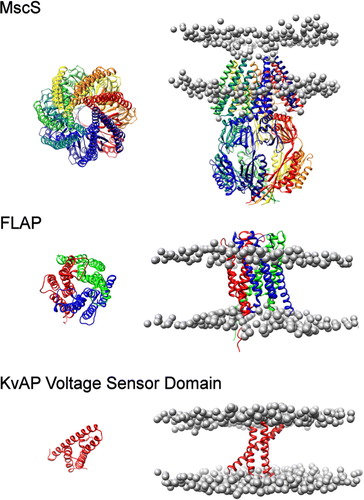
To investigate the effect of lipid tail length on distortion we ran simulations of MscS and FLAP () with three different lipids: DLPC, which has three particles in each tail in the CG model, DPPC, which has four, and DSPC, which has five tail particles.
Figure 2. Positions and orientations of MscS, FLAP and the KvAP sensor domain. The position of MscS (top), FLAP (middle) and KvAP voltage sensor (bottom) in a DPPC bilayer. The protein structure is shown as a ribbon diagram generated from the original pdb structure following superposition with the simulated coarse-grained structure. Phosphate particles are shown as grey spheres.
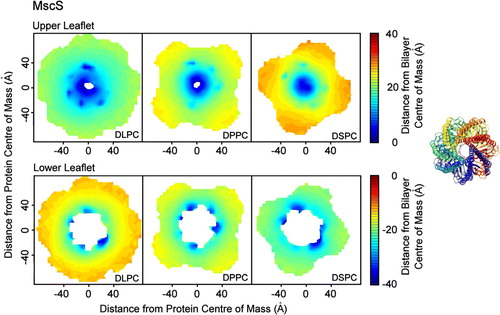
For the simulations involving MscS, the patterns of distortion were the same for all lipid types (). In the upper leaflet, the distortion is seen at radial distances up to ∼70 Å away from the protein's centre of mass. The phosphate headgroups are approximately 5 Å away from the bilayer centre of mass for DLPC, DPPC and DSPC, with the headgroup height above the bilayer centre away from the protein ∼22 Å, ∼25 Å and ∼28 Å for DLPC, DPPC and DSPC respectively. This is largely due to a ring of seven tyrosine residues (Tyr 27 from the inside tip of each monomer of the MscS heptamer) which interacts with DPPC headgroups for 97% of the simulation. It has been suggested that tyrosine interacts with the linking glycerol particles in lipid bilayers, acting as anchors in the interfacial region of membrane proteins Citation[45]. An adjacent ring of arginine residues (Arg 88) are somewhat less exposed to the lipid headgroups (interact with DPPC headgroups for 48% of the analysed simulation). In the lower leaflet, the phosphate headgroups are drawn down to interact with the protein to approximately 30 Å away from the bilayer centre of mass. This is due to a ring of seven arginine residues (Arg 59); of these, six interact strongly with the DLPC headgroups, five with the DPPC headgroups and four with the DSPC headgroups (for 96%, 98% and 99% of the analysed simulation time, respectively).
Figure 3. Bilayer perturbation around MscS. Contour plots (on the left hand side) illustrating the change in the extent of the perturbation of the lipid bilayer around MscS with lipid tail length. The right hand side shows the orientation of the protein. The data were calculated using a set of structures with the protein superposed in the x-y plane such that the protein had the same orientation in all cases. The data were split into 5×5 Å bins for analysis. Smoothed contour plots are coloured according to the mean distance of the phosphate headgroups from the bilayer centre of mass in each bin. The variation in the data was similar in each bin, with standard deviation values typically in the range of 2–3 Å. The data show that the pattern of bilayer distortion is similar for different lipid types with the extent depending upon the hydrophobic mismatch. The upper leaflets for each lipid show isotropic distortion. The lower leaflets for each lipid show distinct areas of distortion caused by Arg 59.
Radial plots of phosphate distance away from the bilayer centre indicate that the headgroups interact with similar, though not identical, areas of the protein for all lipid tail lengths (). For the longer lipid tails the degree of distortion is higher than for the shorter tail lengths, although the areas of the protein with which the DSPC headgroups interact are ∼2–3 Å further away from the bilayer centre than the areas with which the DLPC headgroups interact. This suggests that the adjustment for hydrophobic mismatch is greater with longer lipid tail lengths, but is not complete.
Figure 4. Bilayer distortion as a function of distance from the protein. The upper four panels show the mean phosphate radial distance from the bilayer centre of mass in the upper and lower leaflets as a function of the distance from the protein centre of mass of MscS and FLAP. In each case the pattern of bilayer distortion is similar irrespective of lipid tail length. The lower two panels give the bilayer thickness as function of the distance from the protein centre of mass.
For FLAP the areas of distortion extend to ∼50 Å radially away from the protein's centre of mass (). The protein is located relatively high in the upper leaflet, which is associated with a high density of charged residues, particularly arginines, in the upper third of the protein. Some of these arginine side chains are ‘snorkelling’: reaching up to interact with the lipid headgroup/water interface region. The lower leaflet indicates two main areas of distortion, although FLAP is a trimer. One subunit in the structure is missing eight residues; it is this space into which the lipid headgroups are drawn. In the upper leaflet, two residues in each subunit (Lys 116 and Arg 117) interact heavily with the DPPC headgroups (for 96% and 94% of the analysed simulation, respectively), drawing them down while four residues (Phe 25, Lys 96, Gln 95, Phe 92) interact with the glycerol backbone of the lipids (for 85%, 84%, 83% and 79%, respectively), ensuring that the lipids interact slightly higher with the rest of the protein.
Figure 5. Bilayer perturbation around FLAP. Contour plots (on the left hand side) showing the change in the extent of the perturbation of the lipid bilayer around FLAP with lipid tail length. The right hand side shows the orientation of the protein. The analysis was performed as described for MscS. The patterns of distortion are similar for all lipid types, with the extent dependent on the bilayer width. The upper leaflets for each lipid show three areas where the headgroups are drawn up (red sections). The lower leaflets for each lipid show only two areas where the headgroups are drawn up (red sections) as one chain in the structure of FLAP is missing eight residues.
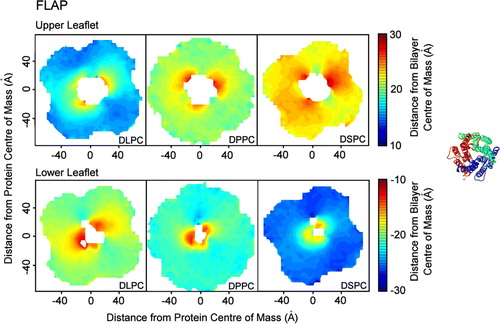
The radial plots of phosphate distance away from the bilayer centre indicate that in the upper leaflet of the DLPC bilayer the average phosphate height changes from ∼16 Å around 60 Å away from the protein to ∼21 Å at around 20 Å from the protein (). In contrast, the phosphate headgroups of DSPC remain at ∼23 Å above the bilayer centre. In the lower leaflet there is significant distortion in all simulations, with the headgroups ∼18 Å below the bilayer centre at 60 Å away from the protein in the DLPC simulation but only ∼12 Å below at 5 Å from the protein. In the DSPC simulation the phosphate headgroups are on average ∼25 Å below the bilayer centre at 60 Å from the protein, but only ∼16 Å below at 5 Å away from the protein. This is a larger adjustment than in the DLPC simulation, although the adjustment in the upper leaflet was larger for DLPC than DSPC. These results suggest that is the optimal bilayer thickness for FLAP is ∼41 Å wide, similar to DPPC.
The effect of lipid headgroup charge on bilayer distortion
A number of simulation studies (see above) have indicated interactions between the voltage sensor of Kv channels and lipid headgroups. These are likely to be of functional importance Citation[36] and have subsequently been seen in a crystal structure of a Kv channel Citation[46]. To date, most simulation studies have focussed on zwitterionic lipids (i.e., phosphatidylycholines). To investigate the effect of lipid headgroup charge on bilayer distortion, five simulations were run of the voltage sensor in lipid bilayers, using DPPC:DPPG lipid molar ratios of 1:0, 9:1, 6:1, 3:1 and 1:1. The patterns of distortion for all simulations were the same for all simulations. The extent of the distortion was not affected by changing the charge of the lipid headgroup (). In the upper leaflet, the phosphate particles move from ∼20 Å above the bilayer centre at 60 Å away from the protein to ∼16–18 Å above the bilayer centre at 8 Å away from the protein. While the DPPC-only bilayer shows the least distortion, the 9:1 DPPC:DPPG mixed bilayer shows the largest distortion, all variation being within typical standard deviations of the data set (∼5 Å). In the lower leaflet, the average position of the phosphate headgroups shifts from ∼21 Å below the bilayer centre of mass at 60 Å away from the protein to ∼18 Å below at 8 Å away from the protein. Therefore, as a whole, each simulation shows a very similar level of distortion and there is no correlation between the extent of the distortion caused by the voltage sensor and the concentration of anionic lipids in the bilayer. This suggests that the voltage sensor interaction is relatively insensitive to the lipid headgroup, provided there is a negatively charged phosphate group present. This correlates well with reconstitution experiments Citation[36].
Figure 6. Bilayer distortion by the KvAP voltage sensor. The mean phosphate distance from the bilayer centre of mass in the (A) upper and (B) lower leaflets is shown as a function of distance from the protein surface for the voltage sensor (pdb code 1ORS). The bilayer (phosphate-phosphate) thickness is shown in (C). Five simulations were run, with a DPPC:DPPG ratio of 1:0, 9:1, 6:1, 3:1 and 1:1. The extent of the distortion is similar in all simulations, with no correlation between the extent of the distortion and the concentration of anionic lipids.
Discussion and conclusion
Interactions with lipids have been shown to be important for the structure and function of a variety of membrane proteins. The insertion of membrane proteins into a bilayer can therefore cause significant distortion to the bilayer, and investigating this distortion can shed light on the function of the protein. The data in the CGDB are enhanced by consideration of this distortion. The CGMD simulation approach used to generate CGDB entries can be completed for a new membrane protein structure within hours/days, thus providing a model of protein/lipid interactions which can form a starting point for more detailed atomistic MD simulations and/or detailed biophysical investigations.
The investigation of the impact of different widths of bilayer on two example proteins showed that the extent of the distortion is dependent on lipid tail length, as the bilayer adapts to allow the headgroups to interact with the same areas of the protein. Comparable behaviour has also been seen in CG simulations of rhodopsin Citation[47]. The lipid headgroups interact with very similar, yet non-identical regions of the protein despite having bilayer widths varying from ∼35 Å to ∼45 Å. This suggests that the energetic cost of distorting the bilayer is generally less than the energetic cost of unfavourable interactions between lipid headgroups and the protein surface. Investigation into the effect of introducing anionic lipids on the distortion caused by the voltage sensor indicates that the level of distortion is unaffected by the presence or concentration of DPPG in a DPPC bilayer, despite the presence of a number of basic residues in the centre of the bilayer.
It has been proposed that, in the case of significant hydrophobic mismatch, some proteins may distort to match the hydrophobic length of the bilayer, rather than the bilayer distorting to match the hydrophobic length of the protein (for a recent study, see e.g., Citation[48]). Our results indicate that the bilayer can distort to match the hydrophobic length of the protein at a range of bilayer thicknesses. Nevertheless, an elastic network model Citation[49] was used in the current study in order to restrain the protein to ensure its stability during the simulation, which may prevent it from distorting unduly to adapt to the hydrophobic length of the lipid bilayer. An extension to this work would be to consider similar systems with unrestrained proteins in atomistic simulations.
Acknowledgements
This work was supported by the BBSRC, via the Membrane Protein Structure Initiative, and the Oxford Centre of Integrative Systems Biology. A.C. is a Medical Research Council student. Declaration of interest: The authors report no conflicts of interest. The authors alone are responsible for the content and writing of the paper.
References
- Wallin E, von Heijne G. Genome-wide analysis of integral membrane proteins from eubacterial, archean, and eukaryotic organisms. Prot Sci 1998; 7: 1029–1038
- Cornelius F. Modulation of Na,K-ATPase and Na-ATPase activity by phospholipids and cholesterol. I. Steady-state kinetics. Biochemistry 2001; 40: 8842–8851
- Starling AP, Khan YM, East JM, Lee AG. Characterization of the single Ca2 + -binding site on the Ca2 + -ATPase reconstituted with short-chain or long-chain phosphatidylcholines. Biochem J 1994; 304: 569–575
- Sunshine C, McNamee MG. Lipid modulation of nicotinic acetylcholine-receptor function – the role of membrane lipid-composition and fluidity. Biochim Biophys Acta 1994; 1191: 59–64
- Baldwin PA, Hubbell WL. Effects of lipid environment on the light-induced conformational-changes of rhodopsin.1. Absence of metarhodopsin-II production in dimyristoylphosphatidylcholine recombinant membranes. Biochemistry 1985; 24: 2624–2632
- Baldwin PA, Hubbell WL. Effects of lipid environment on the light-induced conformational-changes of rhodopsin. 2. Roles of lipid chain-length, unsaturation, and phase state. Biochemistry 1985; 24: 2633–2639
- Caffrey M, Feigenson GW. Fluorescence quenching in model membranes. 3. Relationship between calcium adenosine-triphosphatase enzyme-activity and the affinity of the protein for phosphatidylcholines with different acyl chain characteristics. Biochemistry 1981; 20: 1949–1961
- Lee AG. How lipids affect the activities of integral membrane proteins. Biochim Biophys Acta 2004; 1666: 62–87
- Lange C, Nett JH, Trumpower BL, Hunte C. Specific roles of protein-phospholipid interactions in the yeast cytochrome bc(1) complex structure. EMBO J 2001; 20: 6591–6600
- Fyfe PK, Isaacs NW, Cogdell RJ, Jones MR. Disruption of a specific molecular interaction with a bound lipid affects the thermal stability of the purple bacterial reaction centre. Biochim Biophys Acta 2004; 1608: 11–22
- Fyfe PK, McAuley KE, Roszak AW, Isaacs NW, Codgell RJ, Jones MR. Probing the interface between membrane proteins and membrane lipids by X-ray crystallography. Trends Biochem Sci 2001; 26: 106–112
- Hunte C, Richers S. Lipids and membrane protein structures. Curr Opin Struct Biol 2008; 18: 406–411
- Feller SE, Gawrisch K, Woolf TB. Rhodopsin exhibits a preference for solvation by polyunsaturated docosohexaenoic acid. J Am Chem Soc 2003; 125: 4434–4435
- Grossfield A, Feller SE, Pitman MC. A role for direct interactions in the modulation of rhodopsin by omega-3 polyunsaturated lipids. Proc Natl Acad Sci USA 2006; 103: 4888–4893
- Grossfield A, Feller SE, Pitman MC. Convergence of molecular dynamics simulations of membrane proteins. Proteins: Struct Func Bioinf 2007; 67: 31–40
- Marrink SJ, de Vries AH, Mark AE. Coarse grained model for semiquantitative lipid simulations. J Phys Chem B 2004; 108: 750–760
- Marrink SJ, Risselada J, Yefimov S, Tieleman DP, de Vries AH. The MARTINI forcefield: coarse grained model for biomolecular simulations. J Phys Chem B 2007; 111: 7812–7824
- Monticelli L, Kandasamy SK, Periole X, Larson RG, Tieleman DP, Marrink SJ. The MARTINI coarse grained force field: extension to proteins. J Chem Theor Comp 2008; 4: 819–834
- Basyn F, Charloteaux B, Thomas A, Brasseur R. Prediction of membrane protein orientation in lipid bilayers: a theoretical approach. J Mol Graphics Modelling 2001; 20: 235–244
- Basyn F, Spies B, Bouffioux O, Thomas A, Brasseur R. Insertion of X-ray structures of proteins in membranes. J Mol Graphics Modelling 2003; 22: 11–21
- Ducarme P, Rahman N, Brasseur R. IMPALA: a simple restraint field to simulate the biological membrane in structure studies. Prot Struct Func Genet 1998; 30: 357–371
- Im W, Feig M, Brooks CL. An implicit membrane generalized Born theory for the study of structure, stability, and interactions of membrane proteins. Biophys J 2003; 85: 2900–2918
- Ulmschneider MB, Sansom MSP, Di Nola A. Properties of integral membrane protein structures: derivation of an implicit membrane potential. Proteins: Struct Funct Bioinf 2005; 59: 252–265
- Ulmschneider MB, Sansom MSP, Di Nola A. Evaluating tilt angles of membrane-associated helices: comparison of computational and NMR techniques. Biophys J 2006; 90: 1650–1660
- Sansom MSP, Scott KA, Bond PJ. Coarse grained simulation: a high throughput computational approach to membrane proteins. Biochem Soc Transac 2008; 36: 27–32
- Scott KA, Bond PJ, Ivetac A, Chetwynd AP, Khalid S, Sansom MSP. Coarse-grained MD simulations of membrane protein-bilayer self-assembly. Structure 2008; 16: 621–630
- Andersen OS, Koeppe RE. Bilayer thickness and membrane protein function: an energetic perspective. Ann Rev Biophys Biomol Struct 2007; 36: 107–130
- Powl AM, East JM, Lee AG. Different effects of lipid chain length on the two sides of a membrane and the lipid annulus of MscL. Biophys J 2007; 93: 113–122
- Dixon RAF, Diehl RE, Opas E, Rands E, Vickers PJ, Evans JF, Gillard JW, Miller DK. Requirement of a 5-lipoxygenase-activating protein for leukotriene synthesis. Nature 1990; 343: 282–284
- Miller DK, Gillard JW, Vickers PJ, Sadowski S, Leveille C, Mancini JA, Charleson P, Dixon RAF, Fordhutchinson AW, Fortin R, Gauthier JY, Rodkey J, Rosen R, Rouzer C, Sigal IS, Strader CD, Evans JF. Identification and isolation of a membrane-protein necessary for leukotriene production. Nature 1990; 343: 278–281
- Steinbacher S, Bass R, Strop P, Rees DC. 2007. Structures of the prokaryotic mechanosensitive channels MscL and MscS. In: Mechanosensitive Ion Channels, Part A pp 1–24.
- Edwards MD, Booth IR, Miller S. Gating the bacterial mechanosensitive channels: MscS a new paradigm?. Curr Opin Microbiol 2004; 7: 163–167
- Ferguson AD, McKeever BM, Xu SH, Wisniewski D, Miller DK, Yamin TT, Spencer RH, Chu L, Ujjainwalla F, Cunningham BR, Evans JF, Becker JW. Crystal structure of inhibitor-bound human 5-lipoxygenase-activating protein. Science 2007; 317: 510–512
- Jiang Y, Lee A, Chen J, Ruta V, Cadene M, Chait BT, Mackinnon R. X-ray structure of a voltage-dependent K+ channel. Nature 2003; 423: 33–41
- Ramsey IS, Moran MM, Chong JHA, Clapham DE. A voltage-gated proton-selective channel lacking the pore domain. Nature 2006; 440: 1213–1216
- Schmidt D, Jiang QX, MacKinnon R. Phospholipids and the origin of cationic gating charges in voltage sensors. Nature 2006; 444: 775–779
- Freites JA, Tobias DJ, von Heijne G, White SH. Interface connections of a transmembrane voltage sensor. Proc Natl Acad Sci USA 2005; 102: 15059–15064
- Treptow W, Tarek M. Environment of the gating charges in the Kv1.2 Shaker potassium channel. Biophys J 2006; 90: L64–66
- Bond PJ, Sansom MSP. Bilayer deformation by the Kv channel voltage sensor domain revealed by self-assembly simulations. Proc Natl Acad Sci USA 2007; 104: 2631–2636
- Sands ZA, Sansom MSP. How does a voltage-sensor interact with a lipid bilayer? Simulations of a potassium channel domain. Structure 2007; 15: 235–244
- Jogini V, Roux B. Dynamics of the Kv1.2 voltage-gated K+ channel in a membrane environment. Biophys J 2007; 93: 3070–3082
- Bond PJ, Sansom MSP. Insertion and assembly of membrane proteins via simulation. J Amer Chem Soc 2006; 128: 2697–2704
- Lindahl E, Hess B, van der Spoel D. GROMACS 3.0: a package for molecular simulation and trajectory analysis. J Molec Model 2001; 7: 306–317
- Berendsen HJC, Postma JPM, van Gunsteren WF, DiNola A, Haak JR. Molecular dynamics with coupling to an external bath. J Chem Phys 1984; 81: 3684–3690
- Granseth E, von Heijne G, Elofsson A. A study of the membrane-water interface region of membrane proteins. J Mol Biol 2005; 346: 377–385
- Long SB, Tao X, Campbell EB, MacKinnon R. Atomic structure of a voltage-dependent K+ channel in a lipid membrane-like environment. Nature 2007; 450: 376–382
- Periole X, Huber T, Marrink SJ, Sakmar TP. G protein-coupled receptors self-assemble in dynamics simulations of model bilayers. J Am Chem Soc 2007; 129: 10126–10132
- Yeagle PL, Bennett M, Lemaitre V, Watts A. Transmembrane helices of membrane proteins may flex to satisfy hydrophobic mismatch. Biochim Biophys Acta 2007; 1768: 530–537
- Atilgan AR, Durell SR, Jernigan RL, Demirel MC, Keskin O, Bahar I. Anisotropy of fluctuation dynamics of proteins with an elastic network model. Biophys J 2001; 80: 505–515
- Hilf RJC, Dutzler R. X-ray structure of a prokaryotic pentameric ligand-gated ion channel. Nature 2008; 452: 375–379