Abstract
A 2-dimensional aggregate of C6 neural cells was formed rapidly (within 30 s) in suspension in a recently developed 1.5 MHz ultrasound standing wave trap. A typical 1 mm diameter aggregate contained about 3,500 cells. Spreading of membrane occurred between the aggregated cells. The rate of spreading of the tangentially developing intercellular contact area was 0.19 µm/min. The form of the suspended aggregate changed from one of a hexagonal arrangement of cells to one of a cell-monolayer-like continuous sheet of mostly quadrilateral and pentagonal cells as in a cell monolayer on a solid substratum. A range of fluorescent indicators showed that the >99% viability of the cells did not change during 1 h exposures; therefore cell viability was not compromised during the monolayer development. The average integral intensities from stained actin filaments at the spreading cell-cell interfaces after 1, 8 and 30 min were 14, 25 and 46 µm2 respectively. The cells in this work progressed from physical aggregation, through molecular adhesion, to displaying the intracellular consequences of receptor interactions. The ability to form mechanically strong confluent monolayer structures that can be monitored in situ or harvested from the trap provides a technique with general potential for monitoring the synchronous development of cell responses to receptor-triggered adhesion.
Introduction
Intercellular adhesion is a fundamental biological property in multicellular organisms and plays a key role in processes such as tissue construction Citation[1], embryonic development Citation[2], differentiation Citation[3] and wound healing Citation[4]. The cadherin superfamily of homophilic adhesive membrane glycoproteins has been implicated in many processes such as cell segregation, proliferation Citation[1] and invasive behaviour Citation[5]. Functional cadherin receptors can influence the reorganization of the actin cytoskeleton as well as the formation of adhesive structures such as adherens junctions Citation[6,7]. Cadherin association with the actin cytoskeleton is mediated Citation[8] by the intracellular proteins α-catenin, β-catenin, plakoglobin and p120-cadherin. The actin cytoskeleton brings about cell movements and morphological interactions that underlie normal cell shape Citation[9].
Studies of cell-cell adhesion and spreading have often been carried out on solid substrata, whereas less work has been done with cells in suspension culture Citation[10]. Cell attachment, molecular expression, proliferation and differentiation can be strongly dependent on the physical properties Citation[11] and molecular coatings of substrata Citation[12]. Operational approaches to reducing the influence of such substratum effects on cell studies include culture on substrata such as agar, agarose, Methocell or Matrigel Citation[13] that maintain cells away from, and thus inhibit attachment to, culture vessel surfaces. Difficulties associated with temporal monitoring of cell-cell adhesion in suspension include identifying cells that are about to interact and maintaining those cells in focus for a significant period of time. A solution to this problem, when quantifying adhesion kinetics of abiotic particles, involves studying aggregation in a microscopically focused plane air-water interface Citation[14]. The associated partitioning of particles into the air-water interface is not appropriate for study of animal cell surface interactions. Optical Citation[15], dielectrophoretic Citation[16] and ultrasonic Citation[17,18] traps can, on the other hand, hold cells in suspension for microscopic observations. Optical traps capable of manipulating a number of cells at once have recently been created by forming light intensity patterns in a sample Citation[15]. However these optical fields do not act as sinks towards which many particles migrate and aggregate nor can they simultaneously arrange a collection of cells in close (ca. 50 nm) proximity for non-intrusive study of cell interactions. In contrast, cells can move spontaneously into a microscope-focused concentration region in acoustic or dielectrophoretic traps. A chip has recently been described that offers over 104 individual dielectrophoretic traps as part of an approach to the ‘essential manipulation requirement for the investigation of complex interactions among cells’ Citation[19]. Discrete aggregates of Saccharomyces cerevisiae were formed in adjacent traps Citation[19]. The exemplar cells were suspended in low-conductivity sugar solution rather than in an electrolytic physiological medium more appropriate for animal cell studies.
An ultrasound standing wave trap (USWT) to form and levitate a 2-D aggregate of particles or cells suspended away from the influence of substrata in the focal plane of a light microscope has recently been described Citation[17,18]. The trap is a single half wavelength resonator with a pressure node plane at its centre. Collection and retention of cells arises because particles in an USWT field are subjected to an axial direct acoustic radiation force that drives them towards the single pressure node plane. They then move, within that plane, to accumulate at the centre of the field ().
Figure 1. (a) Particle distribution at time (i) 0, (ii) ‘short’, (iii) ‘long’: (b) (i) Particle movement in node plane (ii) interacting particle at separation h. This Figure is reproduced in colour in Molecular Membrane Biology online.
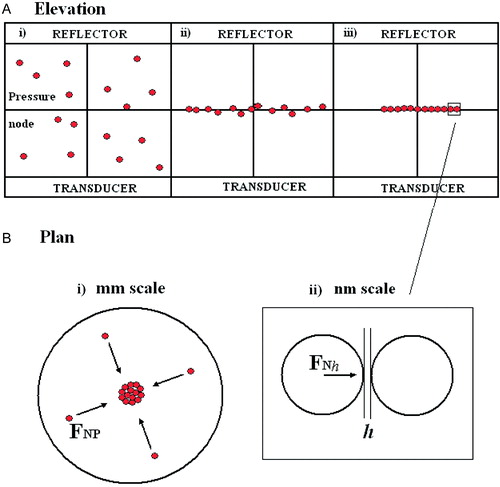
This movement is driven by a net particle force FNP (, mm scale) that is the resultant of a weak lateral direct radiation force within the node plane and a drag due to slow acoustic streaming in the chamber Citation[20]. Cells in close proximity to each other in an acoustic field experience short-range (particle radius, µm scale) interactive forces that are a function of the distances between centres of masses Citation[18]. However, the resultant of those forces (electrostatic, Van der Waals, steric and hydration) that normally (i.e., in suspensions without ultrasound) determines the outcome of particle interaction is a function of the even shorter surface-surface separation distance h (nm scale ()). Consequently, the USWT forces operate on two scales i.e., the long range FNP driving particles to a region where they are retained by acoustic forces and where they then interact in a manner reflecting only the very short range non-acoustic force FNhCitation[17,18]. A schematic diagram of the USWT and particle microscopy system is shown in . Ultrasound traps can be appropriate for the study of cell-cell interactions because: (i) energy absorption is independent of suspending phase ionic strength (e.g., equilibrium temperature rises in the 2-D trap are «0.5K at a pressure amplitude of 0.54 MPa Citation[21]; (ii) the 300:1 ratio of the major to minor semi-axes of the acoustic potential well Citation[18] produces 2-D aggregates in which all cells are in the microscopic field of view. Multiple examples of cell interaction are provided since a 2-D aggregate with a diameter of 1 mm contains about 3,500 cells; (iv) the attractive acoustic force between ultrasonically agglomerated cells equals the van der Waals force at surface separations of 34 nm Citation[18]. The van der Waals force dominates the essentially constant acoustic force at smaller separations. Consequently while the trap helps hold the cells close together it does not influence interactions at the cell receptor size (ca. 20 nm) separation range ().
Figure 2. Experimental assembly. The resonator outer diameter is 25 mm. Its main components were a 1.5 MHz disc transducer that was glue-attached to a steel acoustic coupling layer, a sample volume and glass acoustic reflector. The thicknesses of the different layers were selected to give a highly resonant system Citation[24].
![Figure 2. Experimental assembly. The resonator outer diameter is 25 mm. Its main components were a 1.5 MHz disc transducer that was glue-attached to a steel acoustic coupling layer, a sample volume and glass acoustic reflector. The thicknesses of the different layers were selected to give a highly resonant system Citation[24].](/cms/asset/ef800f75-bd54-456f-a833-a58de9d71056/imbc_a_109322_uf0002_b.jpg)
In the present study, we apply the ultrasound trap to study cell-cell adhesion in C6 neural cell 2-D aggregates (cell monolayers) synchronously and rapidly (within 30 s) formed and levitated, away from any substratum, in suspension. These aggregates, formed and maintained without any cell-substratum interaction, develop into cell monolayers. The rate of membrane-membrane spreading and the distribution of NCAM, N-cadherin and F-actin were monitored over a 30 min period. The ultrasound trap was shown to be non-intrusive as the cell viability over a 1 h period of ultrasound exposure was >99% and showed no detectable dependence on exposure time.
Materials and methods
Ultrasound trap
The ultrasound trap employed in the present work had four layers; a transducer (Ferroperm, Kvistgard, Denmark) in a housing of radial symmetry, a steel layer coupling the ultrasound to a one half wavelength (λ/2 or 0.5 mm depth, where λ is the wavelength of sound in water), an aqueous layer and a reflector that provided optical access from above (). The disc transducer (12 mm diameter) had a nominal thickness resonance of 1.5 MHz and was driven at 1.59 MHz. Its back electrode was etched to a 6 mm diameter circle so as to give a single central aggregate in a single half-wavelength chamber Citation[20]. The quartz glass reflector had a thickness of 1 mm (λ/4) so that the single pressure node plane in the sample volume was located half way through that volume Citation[22]. The transducer drive voltage came from a function generator (HM 8138, HAMEG, Germany). The sound pressure amplitude (Po) was estimated as described by Spengler et al. Citation[23]. Po was 0.27 MPa in the present study, unless otherwise stated.
Culture of 921202-6 (C6) neural cells
The conditionally immortalized cell line (derived from the rat mesencephalon) was maintained as a replicative culture at 33°C (the permissive condition for the immortalizing oncogene SV40-T), under an atmosphere of 95% air and 5% CO2, in neuronal supplemented medium (NSM) and supplemented with 5 ng/ml fibroblast growth factor (FGF-2) (Sigma, UK) Citation[24]. The cells were plated on gelatin-coated plastic culture flasks that had been dried and UV-irradiated overnight, followed by poly-L-lysine addition (1 mg/ml, Sigma, UK). 2.5 ng/ml of FGF-2 was added as daily maintenance of trophic support. Half the medium was changed every third day. At the confluence phase cells were rinsed with Dulbecco's Phosphate Buffered Saline (Sigma, UK) (DPBS) without Ca2 + and Mg2 + . Cells were then treated with 1 ml of ethylene glycol bis (β-aminoethyl ether)-N, N, N′, N′-tetracetic acid/ethylenediaminetetraacetic acid (EGTA/EDTA) (200 µg/ml) for 30 s to release cells from the culture flask surface. 5 ml of NSM were then added. One sixth of the cells were plated to a fresh gelatin/poly-L-lysine coated flask. The remaining cells were centrifuged at 500 rpm, resuspended in NSM, counted on a Bright-line haemocytometer (Reichert, USA) and finally diluted to the desired concentration. The sample was introduced into the sonication chamber at room temperature with a 2 ml sterile syringe (Plastipak, Becton Dickinson, UK).
Optical system
A fast, high-resolution CCD F-view camera (12-bit depth) mounted on an Olympus BX41M reflection epi-microscope via a 0.3×TV adapter (U–PMTVC) allowed observation in the direction of sound propagation (negative z-axis). The trap is shown in position on the microscope stage in . The microscope was pre-focused on the trap's pressure nodal plane. Sonication started shortly after the sample was introduced. Images were captured and processed using the analySIS 3.1 software Citation[25].
Rate of membrane spreading
The extent of membrane spreading was assessed by measuring: (a) the ‘outer edge’ separation distance of two cells (indicated in with range (1)), and (b) the ‘width’ of the tangentially developing contact area of the cells (indicated in with range (2)).
Void analysis
Images of cell aggregates suspended in the trap (cell concentration of 5×10⁵) were captured and processed using the analySIS 3.1 software. The objective magnification used was×50, therefore a single microscope field contained only part of an aggregate. The areas of the voids (cell-free regions within the aggregate periphery) were outlined manually using the free-hand tool. The percentage of the void area in a field of view was calculated as follows: the void area after 8 and 30 min of ultrasound exposure was divided by the initial void area (i.e., after 1 min of initiation of ultrasound) of the part of the aggregate in the field of view.
Immunofluorescence
C6 neural cells were subcultured as described above and finally diluted to a concentration of 3×10⁶ cells/ml. An aggregate of significant size (i.e., ca. 1 mm diameter) was formed within 30 s of ultrasound exposure. Aggregates were exposed to ultrasound for 1, 8 and 30 min. They were then slowly removed from the trap using a 2 ml sterile syringe, placed on a HistoBond microscope slide (RA Lamb, UK) and fixed with 90% ethanol. The slides were then rinsed with saline.
Filamentous actin was labelled by adding a few drops of Phalloidin-FITC conjugate (5 µg/ml; Sigma, UK) Citation[26]. The slides were incubated at room temperature in the dark for 1 h, rinsed and mounted in Vectashield (Vector, UK) prior to examination. The integral intensity of the phalloidin labelling at the cell interface was quantified by placing a rectangle provided by the analySIS 3.1 software, to contain the interface of each of 50 randomly selected pairs of cells. The integral intensity of an image is defined for this purpose as the sum of all the intensities within the defined area multiplied by the pixel area Citation[25].
Samples prepared and fixed as described above were also assayed for N-cadherin and NCAM. Samples were serum blocked at room temperature with 100 µl of goat serum (DAKO, UK) at 1:20 dilution in PBS for 20 min, and incubated with the primary antibody (monoclonal anti-A-CAM or anti-NCAM, 5 µg/ml, Sigma, UK; Citation[26]) overnight at 4°C. After washing in PBS, samples were incubated with Alexa 488 conjugated anti-mouse IgG (5 µg/ml, Molecular Probes, Inc. Eugene, OR, USA) for 1 h. After further washing (×3), specimens were mounted in Vectashield (Vector, UK) prior to examination.
Cell viability tests
Non-sonicated samples
Cells were subcultured as above and placed in a centrifuge tube at room temperature at a concentration of 3×10⁶/ml. Cell viability was measured over the following 12 h using 0.4% trypan blue dye (Sigma, UK) or over 2 h using 1 µM ethidium homodimer-1 (EthD-1; Molecular Probes, Inc. Eugene, OR, USA) exclusion. Samples were examined hourly with a bright–line heamocytometer (Reichert, USA) under a Leica DMLS microscope. A positive control for both dyes was obtained by killing the cells with 70% ethanol; all cells were stained in those samples. χ2-tests for trypan blue assays at a number of times between 0 and 12 h and EthD-1 assays at times between 0 and 2 h showed that there was no significant association between percentage of dead cells and time. The percentages of cell death determined from the trypan blue and EthD-1 assays were 2% and 2.4% respectively.
Cells in the ultrasound trap
Viability assays were performed in situ on cells suspended for 1 h in the trap in NSM containing the viability markers outlined below. The number of cells that had taken up the dye after 1 min of ultrasound exposure was compared to that after 1 h of ultrasound exposure.
Calcein AM
A stock solution of 1 mM solution (Molecular Probes, Inc. Eugene, OR, USA) in anhydrous dimethylsulfoxide (DMSO) (Sigma, UK) was diluted in NSM to a final concentration of 1 µM. Calcein AM is membrane permeable and is cleaved by esterases in live cells to yield cytoplasmic green fluorescence (calcein); therefore, green fluorescence is an indicator that cells have esterase activity as well as an intact membrane to retain the esterase products Citation[27].
Ethidium homodimer-1 (EthD-1)
A stock solution of 1 mM solution of EthD-1 (Molecular Probes, Inc. Eugene, OR, USA) in anhydrous dimethylsulfoxide (DMSO) (Sigma, UK) was diluted in NSM to a final concentration of 1 µM. EthD-1 passes across the compromised membranes of dead or dying cells, binds to nucleic acids and produces a red fluorescence Citation[27].
ApoAlert Annexin V
Annexin V-FITC was used along with propidium iodide (PI) (BD ApoAlert Annexin V Apoptosis kit, BD Biosciences, UK) to identify very early and late apoptotic cells respectively. Annexin-FITC stains only early apoptotic cells as it is based on the observation that, approximately 1 h after initiating apoptosis, the membrane phospholipid phosphatidylserine (PS) translocates from the inner face of the plasma membrane to the cell surface Citation[28]. Propidium iodide stains late apoptotic cells and necrotic cells when the plasma membrane has become significantly permeable.
Neural cells were subcultured as described above and diluted to a concentration of 2×10⁵/ml. The sample was centrifuged at 500 rpm for 5 min. The supernatant was removed and 200 µl of 1× binding buffer (provided by the apoptosis kit) were added. 5 µl of annexin V-FITC (20 µg/ml in Tris-NaCl) and 10 µl of propidium iodide (50 µg/ml in 1X binding buffer) were added. The sample was incubated at room temperature in the dark for 15 min. Finally, NSM medium was added to achieve a cell concentration of 105/ml. The final dye concentrations were 0.25 µg/ml and 1.2 µg/ml respectively. A second non-sonicated cell sample was incubated for 48 h at 39°C to induce apoptosis (positive control).
Mito Tracker Green FM
MitoTracker Green FM (Molecular Probes, Inc. Eugene, OR, USA) is non-fluorescent in aqueous solution but it exhibits a bright green fluorescence once it accumulates in the lipid environment of mitochondria of live cells Citation[29]. A stock solution of 50 µg of lyophilized solid was dissolved with DMSO to a concentration of 100 µM. For cell labelling, this solution was diluted to 100 nM in NSM medium. The cells were incubated with the dye for 45 min at room temperature prior to ultrasound exposure.
Results
Formation and morphology of cell monolayers
Cells suspended in NSM moved into the optically focussed nodal plane of the USWT within 1 s of initiation of sonication. A small aggregate had formed 20 s later at the central region of the nodal plane. Incoming single cells and dendritic small clusters formed strong contact instantly with the peripheral of the growing aggregate, i.e., they did not roll along the periphery. However, the short dendritic clusters rotated, without internal reorganization, about their first contact point with the main aggregate so that it developed a more closely packed form, without hexagonal order, over an extended area. An aggregate was fully formed within 5 min of ultrasound exposure, as characterised by the absence of free single cells from the field of view. Compaction continued, i.e., the void area within the aggregate decreased, during the following 20 min. The void area of the part of a monolayer shown in decreased from 4.2×103 µm2, after 1 min of ultrasound exposure, to 3.4×103 µm2, after 8 min of ultrasound exposure (image not shown) to 1.3×103 µm2, after an overall ultrasound exposure of 30 min, i.e., there was a 68% reduction in the void area ().
Figure 3. Neural cells suspended in the ultrasound trap: (a) 1 min, and (b) 30 min after initiation of ultrasound. Membrane spreading (grey arrow), blebbing (black arrow) and loss of refractility (dotted arrow) are shown. Scale bar is 25 µm.
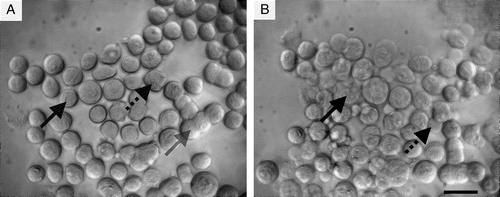
Table I. Decrease in void area and increase in actin filament intensity with time.
Cell morphology changes in the monolayer
Single cells, suspended in NSM following detachment from the culture flask, had gradually adopted a circular or nearly circular outline by the time of introduction into the ultrasound trap. Cells were then observed during a 60 min exposure to ultrasound. The membranes of neighbouring cells progressively spread over one another (indicated with grey arrow in ), occasionally resulting in a visual loss of the individual cell boundaries. As a result, initially circular neighbouring cells gradually developed a more ellipsoidal shape. A small percentage of both single cells and cells that had spread, underwent additional morphological changes such as blebbing (indicated with dotted arrow in ) or reduced refractility (indicated with black arrow in ).
Assays of cell integrity in sonicated samples
The marked change in cell morphology taking place during 1 h levitation in the trap () raised the question of whether cells in the aggregate were becoming compromised. Duplicate viability assays of cells in levitated monolayers were performed in situ. The low magnification micrograph of cells in EthD-1 () shows an entire aggregate while the low incidence of stained dead cells in that aggregate is emphasized by . shows details (×50 objective) that were selected at time points between 5 and 60 min to characterize the properties of spreading and blebbed cells, as well as cells with low refractility. Calcein AM, PI and MiToTracker Green FM results were concordant in reporting that spreading cells and the ‘main bodies’ of cells with blebs were viable, while cells of low refractility were dead (). In agreement with these results MiToTracker Green FM stained the mitochondria of cells that had spread (). PI and Calcein AM confirmed that the membranes of blebs were intact, while MiToTracker Green FM and the DNA-staining EthD-1 showed that they were mitochondria- and DNA-free (). Annexin V-FITC did not show any fluorescence over a 1 h period of ultrasound exposure. The positive control cells (cells in which apoptosis has been induced by incubation at 39°C, the non-permissive condition for the immortalizing oncogene) did stain with annexin V-FITC after 48 h incubation. Since blebs have been also reported on cells during spreading on solid substrata Citation[30–32] and on Matrigel Citation[33] and since the Annexin V-FITC test for apoptosis Citation[34] was negative here, it was concluded that the bleb formation was associated with cell spreading rather than cell distress in the trap.
Figure 4. Viability assays. (a,b) Staining of dead cells with EthD-1, bright field and fluorescence microscopy respectively at time (t) = 60 min after ultrasound initiation; (c,d) Staining of live cells with Calcein AM (t = 15 min); blebbed cells, but not the blebs, have stained (arrows). (e,f) Dead cells staining with PI. Low refractility cells have been stained (arrows), (t = 60 min); (g,h) Staining of mitochondria of live cells with MiToTracker green FM. Spread cells have stained (arrows), (t = 5 min). Scale bar (a–b) is 250 µm, (c–h) is 20 µm.
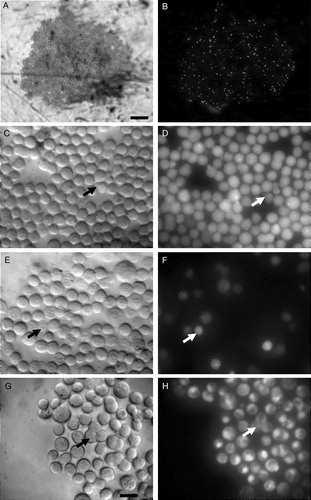
Table II. Responses of cells exposed in situ to different dyes for 1 h in a levitated monolayer.
Monolayer development independence of acoustic pressures and cell concentrations
The aggregates described above had been suspended in the trap where Po was 270 kPa for 1 h. Experiments were also performed where Po was maintained at 270 kPa for only 30 s, i.e., until the aggregate was formed. Po was then decreased to 34 kPa, the level at which the acoustic radiation force just balanced the gravitational force on the aggregate and thus levitated the monolayer in suspension. Cell responses over time were identical to those of cells exposed to the higher pressure. Nutrient availability in the trap was tested by reducing the cell concentration to 104/ml (i.e., the aggregate consisted of approximately 550 cells) and pumping NSM medium through the trap at intervals. The response of single cells was as those shown () and described above for cells exposed at higher concentrations (ranging from 5×10⁵ to 3×10⁶) without medium flow.
Rate of membrane spreading
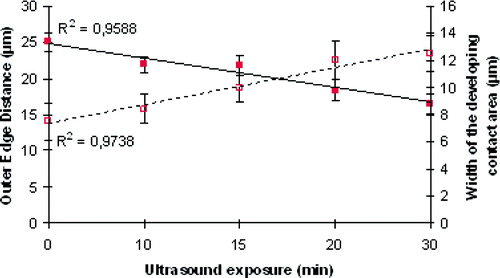
Membrane spreading occurs progressively with some reduction in the resolution of the individual cell boundaries occurring between 30 min and 60 min. can be considered as representative of the phenomenon. Soon after ultrasound initiation (1 min), neighbouring neural cells come into close contact. At this point, the width of the advancing membrane front of the illustrated doublet was 3.7 µm (). The width of the developing contact region increases to 6.98 and 9.86 µm after 30 and 40 min respectively (). Progression of cell contact to a stage where the image of the advancing front could no longer be resolved () was unusual. The outer edge separation distance between the two cells spreading in , decreased from an initial (t=0) value of 26 µm () to 18 µm at t=60 min (). Measures of neural membrane spreading described above are shown, as a function of time, for 7 random pairs of cells in . The rate of the tangentially spreading between two cells was 0.19 µm/min, while the rate of spreading of edge to edge separation distance was −0.3 µm/min.
Figure 5. Development of membrane spreading in an example neural cell doublet: (a) 1 min, (b) 10 min, (c) 20 min, (d) 30 min, (e) 40 min, and (f) 60 min after ultrasound initiation. The ‘outer edge’ separation distance (range 1) and the measured ‘width’ of the tangentially developing contact area (range 2) are shown. Scale bar is 6 µm.
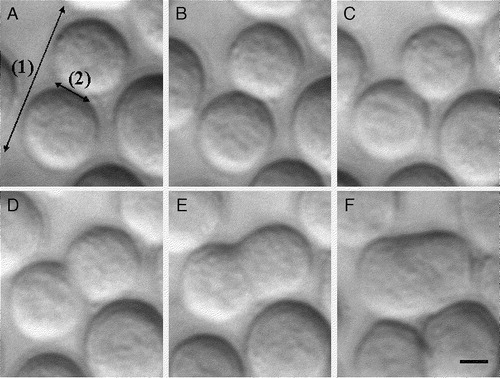
Figure 6. Temporal progression of: (1) the ‘width’ of the developing contact area (dotted line) and (2) the ‘outer edge’ separation distance (continuous line) of selected pairs of spreading cells (error bars indicating the standard error of the mean, n=7). This Figure is reproduced in colour in Molecular Membrane Biology online.
Actin localization, N-cadherin and NCAM distribution
Neural cells were removed from the trap using a 2 ml sterile syringe shortly after the formation of a cell-cell contact (i.e., 1 min after initiation of ultrasound exposure), and then 8 min and 30 min after initiation of ultrasound when cell-cell contacts have been strengthened. Aggregates recovered from the trap after 1 min of US exposure showed a significant degree of dissociation upon deposition on a glass slide. In contrast, the degree of dissociation of the aggregate isolated from the trap after 8 min of US exposure was minimal and an aggregate exposed to US for 30 min was isolated from the trap almost intact. These results emphasised the increase in mechanical strength of an aggregate with time. The distributions of filamentous actin, N-cadherin and NCAM were then analysed using immunofluorescence techniques ().
Figure 7. Distribution of NCAM (a–c), N-cadherin (d–f) and actin (g–i) in aggregates isolated from the trap after 1 min (a, d, g), 8 min (b, e, h) and 30 min (c, f, i) of ultrasound initiation. Scale bar is 25 µm. This Figure is reproduced in colour in Molecular Membrane Biology online.
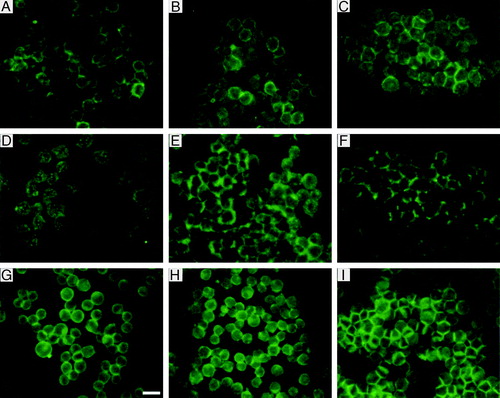
NCAM was detected at the cell membrane from the first minutes of ultrasound exposure. However, at 1 min of exposure the signal was quite weak and occasionally discontinuous (). The signal at the interface was more continuous 7 min later (), while after 30 min () of exposure NCAM was distributed evenly at the cell-cell contact area. The signal was then relatively strong.
N-cadherin was located in the interior of the cells rather at the surface, in a spot-like mode at 1 min of ultrasound exposure (). After 8 min N-cadherin () is concentrated at the surface of the cells at interfaces. At 30 min after ultrasound initiation () it exhibits a discontinuous, strong signal at the surface of the cells possibly associated with the formation of adherens junctions.
Finally, filamentous actin after 1 min of ultrasound exposure showed a discontinuous, almost punctate distribution around the surface of the cells (). After 8 min, actin label accumulated at the interfaces of the cells (), and after 30 min () strong labelling was shown at the cell-cell contact region. The intensity of filamentous actin was measured at the above times for 50 randomly selected pairs of cells. The average integral intensities of 50 random pairs of cells were 14, 25 and 46 µm2, after 1, 8 and 30 min of ultrasound exposure respectively (). The standard error of the mean was 4% for each sample.
Discussion
Fluorescence assays showed that cell viability in the ultrasound trap was >99% and had no detectable dependence on exposure time over the 1 h period examined. The cells showing membrane blebs in the developing monolayers were viable. Taken with the negative Annexin V-FITC results for apoptosis we conclude that the membrane blebs observed during monolayer reorganization were of similar origin to those associated elsewhere with cell spreading on a substratum Citation[30,31], i.e., they were not indicators of necrosis or apoptosis. Our use of a conditionally-immortalized cell line Citation[24] has relevance for the interpretation of the negative Annexin V-FITC results for apoptosis. Most cell lines in use today are derived from spontaneously-occurring tumours in which the genetic aberration commonly results in a defect in, inter alia, the ability of the cell to undergo apoptosis. As a result, cells that should die via apoptosis instead survive. In contrast, apoptosis was still elicited in clone 6 cells by switching off the oncogenic drive using NSM and a 39°C incubation temperature. The absence of expression of apoptotic cell death markers, such as Annexin V, after ultrasound exposure is therefore due not to a compromised cell death program but to a genuine lack of pathological abnormalities. Our conclusion that the ultrasound trap did not compromise the viability of cells during exposure is consistent with the general experience of investigators of biological effects of ultrasound on cells in vitroCitation[35,36].
The initially open form of the neural cell aggregates reflects strong binding of the neural cells on coming into contact in the sound field. The transition from hexagonally ordered cell clusters (typical of aggregates of non-interacting solid spheres Citation[17]) to the continuous sheet of quadrilateral and pentagonal cells typical of confluent monolayers on glass Citation[37] has been shown here to occur in 30 min. The ability of cells to repack from circles in point contact to irregular pentagons in continuous contact reflects a freedom to reorganise form rapidly within the unconstrained suspended monolayer.
NCAM-NCAM interactions between molecules on apposing cells (trans interactions) lead directly to a strong cell-cell contact Citation[38]. Cadherins also mediate a homophilic binding on adjacent cells. In the presence of calcium ions, cadherin receptors bind to the same type of cadherin on adjacent cells (homophilic binding) Citation[1] (Step1). Upon adhesive interaction, cadherins accumulate at sites of cell-cell contacts (Step 2) and are held together within each membrane via interaction with the cytoskeleton (Step 3) Citation[6]. Clustering and association with the cytoskeleton are important for strengthening the forces provided by the cadherin homophilic binding Citation[39]. NCAM was present at the cell-cell interface from the initial aggregate formation stage with progressive accumulation of NCAM molecules at the cell-cell interface over 30 min of ultrasound exposure (). Our results on N-cadherin distribution are consistent with reports of cadherin trafficking obtained from cells on solid substrata Citation[40–46]. As is the case with other transmembrane proteins, the synthesis, recycling and degradation of cadherins are driven by a complex network of intracellular trafficking pathways Citation[47]. The cytoplasmic pool of N-cadherin molecules shown in suggests that following detachment of cells from the flask using the chelator EDTA, cadherins were endocytosed as cell to cell contacts were perturbed. N-cadherin molecules were then rapidly (within 7 min) trafficked back to the cell surface () via a post-Golgi pathway Citation[41]. Upon formation of stable cell-cell contacts (), N-cadherin remained at the cell surface Citation[40,41] for the remainder of the 30 min duration of the experiment. Cadherin internalization increases once cell-cell contacts are broken Citation[41], therefore effective adhesion may prevent cadherin endocytosis Citation[41]. Finally, shows the associated temporal progression of actin localization. Filamentous actin after 1 min of ultrasound exposure is distributed in a spot-like mode around the surface of the cells; 7 min later, actin is accumulating at the interfaces of the cells, whereas after a 30 min exposure strong junctional localisation is observed.
There are few reports of fluorescence microscopy studies of the time course of the molecular development of the cell cytoskeleton in a cell monolayer following receptor mediated cell-cell interaction. Hennings and Holbrook Citation[48], in one of the earlier studies, examined adhesion in keratinocyte monolayers growing in standard (1.2–1.8 mM calcium) and low calcium concentrations (0.02–0.1 mM). In the first case cells were connected by desmosomes and stratified to 4–6 cell layers, whereas in the latter case cells grew as a monolayer with no desmosomal connections. This ‘calcium switch’ approach has since been used in further keratinocyte studies Citation[42,49]. They reported major cytoskeletal reorganization and formation of desmosomes within 2 and 1 h respectively after addition of normal calcium concentrations to the cultures, in general agreement with our results for a neural cell monolayer in suspension. The ‘calcium switch’ approach has also been used by Mary et al. Citation[40] to investigate the distribution of N-cadherin using confluent monolayers of REF-52 fibroblasts attached onto glass coverslips. In particular, confluent monolayers were treated with EGTA to disturb cell-cell contacts. Within 10–15 min N-cadherin accumulated at the perinuclear region and was excluded from the junctions. Restoration of extracellular Ca2 + rapidly resumed N-cadherin at cell-cell contact sites. It was found that after 90 min of addition of extracellular Ca2 + the distribution of N-cadherin was comparable to that in untreated confluent cells. In a similar study performed by Chen et al. Citation[43], HEK293 confluent cells were again treated with EGTA for, followed by incubation in complete growth medium (recovery). It was shown that 15 min after calcium recovery there was strong N-cadherin accumulation at cell-cell contacts. The rapid temporal progression of adherens junctions formation in cell on solid substrata has been qualitatively reported in a number of studies Citation[44–46].
The ultrasound technique can simply, rapidly and with some precision produce data on molecular changes during development of adhesion free of the effects of solid substrata as is the case in the studies reported earlier Citation[40–46].
In the present work membrane spreading and actin dynamics have been studied as the ability of cells to attach to and spread over each other rather than on a substratum. The rate of membrane spreading (‘width’ of the tangentially developing contact area) was 0.19 µm/min, while that of the edge to edge separation distance was −0.3 µm/min ( and ). We note that these measurements of spreading of contact lie in the range reported for cell migration, a process also involving actin filaments. CH0K1 Citation[50] and neural progenitor cells Citation[51] migrate at rates of about 0.4 µm/min, rat autonomic motor neurons at 0.06 µm/min Citation[52] while the more specialized T cells crawl across a surface at 2–6 µm Citation[53].
It is therefore concluded that the interactions at the plasma membranes of cells in close proximity in the ultrasound trap transduce signals that consequently have major impacts on the cell shape and on the organization of F-actin at the cell interface, across the membrane. An integrated view of the development of the monolayer can be seen as a non biological concentration of cells under millimetre range acoustic forces (), a non-intrusive effect of the micron scale acoustic particle interaction force that is small compared to the van der Waals interaction Citation[18,21], acoustic-independent cell receptor interactions that modify the short range interactions leading to adhesion () and then acoustic independent progression of intracellular processes to form the adhesively strong monolayer.
While in the present application, cells were removed from the trap and post-fixed for actin and the cadherin-catenin complex, transfecting a population of cells with GFP for E-cadherin, for example, would provide an alternative approach to monitoring in real-time the trafficking/distribution of this molecule in a large number of cells simultaneously triggered to make contact in a high-resolution, real-time fluorescence imaging or confocal microscopy field. Studies of cadherin based cell-cell adhesion may provide significant clues to understanding tumorigenesis and help identify potential therapeutic targets to modify and possibly prevent tumour invasion and metastasis Citation[54]. The ultrasound approach, with its ability to monitor developing adhesive, partitioning and invasive behaviours of cell consortia free of the constraining influence of solid substrata, can facilitate quantitative measures of the cell consortium order or ‘cellular sociology’ Citation[18,55], that reflect the influence of cell surface receptors on tumour invasiveness and on condensation processes in development. Study of the adhesion of cells in a consortium in suspension provides a significant advance on the ‘calcium switch’ approach, above, that is limited to attached monolayers of homogeneous cells.
This paper was first published online on prEview on 28 April 2005.
We would like to thank Miss R. Fish for advice on the immunostaining techniques, Prof. I. D. Bowen for useful discussions on the viability assays and Mr K. Oliver for fabricating the ultrasound trap.
Related Research Data
References
- Takeichi M. Cadherin cell adhesion receptors as a morphogenetic regulator. Science 1991; 251: 1451–1455
- Hynes RO. Targeted mutations in cell adhesion genes: what have we learned from them?. Dev Biol 1996; 180: 402–412
- Klimkovsky MW, Parr B. The body language of cells: the intimate connection between cell adhesion and behaviour. Cell 1995; 83: 5–8
- Yamada KM, Kemler R. Cell-to-cell contact and extracellular matrix. Curr Opin Cell Biol 2002; 14: 527–530
- Mareel M, Leroy A. Clinical, cellular, and molecular aspects of cancer invasion. Physiol Rev 2003; 83: 337–376
- Tepass U. Adherens junctions: new insight into assembly, modulation and function. Bioessays 2002; 24: 690–695
- Perego C, Vanoni C, Massari S, Raimondi A, Pola S, Cattaneo MG, Francolini M, Vicentini LM, Petrini G. Invasive behaviour of glioblastoma cell lines is associated with altered organisation of the cadherin-catenin adhesion system. J Cell Sci 2002; 115: 3331–3340
- Braga V. Epithelial cell shape: cadherins and small GTPases. Exp Cell Res 2000; 261: 83–90
- Zicha D, Dobbie IM, Holt MR, Monypenny J, Soong DYH, Gray C, Dunn GA. Rapid actin transport during cell protrusion. Science 2003; 300: 142–145
- Martin I, Dozin B, Quarto R, Cancedda R, Beltrame F. Computer-based technique for cell aggregation analysis in vitro chondrogenesis. Cytometry 1997; 28: 141–146
- Redey SA, Nardin M, Bernache-Assolant D, Rey C, Delannoy P, Sedel K, Marie PJ. Behaviour of human osteoblastic cells on stoichiometric hydroxyapatite and type A carbonate apatite: Role of surface energy. J Biomed Mater Res 2000; 50: 353–364
- Dihne M, Bernreuter C, Sibbe M, Paulus W, Schnachner M. A new role for the cell adhesion molecule L1 in neural precursor cell proliferation, differentiation, and transmitter-specific subtype generation. J Neuroscience 2003; 23: 6638–6650
- Freshney RI. Culture of animal cells: A manual of basic technique4th edn. Wiley-Liss Inc, Chichester 2000
- Hidalgo-Álvarez R, Martín A, Fernández A, Bastos D, Martínez F, de las Nieves F. J. Electrokinetic properties, colloidal stability and aggregation kinetics of polymer colloids. Adv Colloid Interface Sci 1996; 67: 1–118
- Grier DG. A revolution in optical manipulation. Nature 2003; 424: 810–816
- Heida T, Rutten WLC, Marani E. Understanding dielectrophoretic trapping of neuronal cells: modelling electric field, electrode-liquid interface and liquid flow. J Phys D Appl Phys 2002; 35: 1592–1602
- Spengler JF, Coakley WT. Ultrasonic trap to monitor morphology and stability of developing microparticle aggregates. Langmuir 2003; 19: 3635–3642
- Coakley WT, Bazou D, Morgan J, Foster GA, Archer CW, Powell K, Borthwick KAJ, Twomey C, Bishop J. Cell-cell contact and membrane spreading in an ultrasound trap. Colloid Surface B: Biointerfaces 2004; 34: 221–230
- Manaresi N, Romani A, Medoro G, Altomare L, Leonardi A, Tartagni M, Guerrieri R. A CMOS chip for individual cell manipulation and detection. IEEE J Solid-St Cir 2003; 38: 2297–2305
- Spengler JF, Coakley WT, Christensen KT. Microstreaming effects on particle concentration in an ultrasonic standing wave. AiChE J 2003; 49: 2773–2782
- Bazou, D, Kuznetsova, L, Coakley, WT. Physical environment of 2-D animal cell aggregates formed in a short pathlength ultrasound standing wave trap. Ultrasound Med Biol. 2005;31:423–430.
- Hawkes JJ, Coakley WT, Groschl M, Benes E, Amstrong S, Tasker PJ, Nowotny H. Single half-wavelength ultrasonic particle filter: predictions of the transfer matrix multilayer resonator model and experimental filtration results. J Acoust Soc Am 2002; 111: 1259–1266
- Spengler JF, Jekel M, Christensen KT, Adrian RJ, Hawkes JJ, Coakley WT. Observation of yeast cell movement and aggregation in a small-scale MHz ultrasonic standing wave field. Bioseparation 2001; 9: 329–341
- Stringer BMJ, Verhofstad AAJ, Foster GA. Raphé neural cells immortalised with a temperature-sensitive oncogene: differentiation under basal conditions down a APUD cell lineage. Dev Brain Res 1994; 79: 267–274
- Soft Imaging System GmbH, analySIS 3.1 user's guide. Soft Imaging System GmbH Munster, Germany, 1999.
- Ralphs JR, Waggett AD, Benjamin M. Actin stress fibers and cell-cell adhesion molecules in tendons: organisation in vivo and response to mechanical loading of tendon cells in vitro. Matrix Biology 2002; 21: 67–74
- Ikeguchi R, Kakinoki R, Okamoto T, Matsumoto T, Hyon SH, Nakamura T. Successful storage of peripheral nerve before transplantation using green tea polyphenol: An experimental study in rats. Exper Neur 2003; 184: 688–696
- Martin SJ, Reutelingsperger CPM, McGahon AJ, Rader JA, van Schie RCAA, LaFace DM, Green DR. Early redistribution of plasma membrane phosphatidylserine is a general feature of apoptosis regardless of the initiating stimulus: Inhibition by overexpression of Bcl-2 and Abl. J Exp Med 1995; 182: 1545–1556
- Garner DL, Thomas CA, Joerg HW, DeJarnette JM, Marshall CE. Fluorometric assessments of mitochondrial function and viability in cryopreserved bovine spermatozoa. Biol Reprod 1997; 57: 1401–1406
- Yamaji S, Suzuki A, Sugiyama Y, Koide Y, Yoshida M, Kanamori H, Mohri H, Ohno S, Ishigatsubo Y. A novel integrin-linked kinase-binding protein, affixin, is involved in the early stage of cell-substrate interaction. J Cell Biol 2001; 153: 1251–1264
- Balto HA. Attachment and morphological behaviour of human periodontal ligament fibroblasts to mineral trioxide aggregate: a scanning electron microscopy study. J Endodont 2004; 30: 25–29
- Fey P, Stephens S, Titus MA, Chisholm RL. SadA, a novel adhesion receptor in Dictyostelium. J Cell Biol 2002; 159: 1109–1119
- Voura EB, Sandig M, Kalnins VI, Siu CH. Cell shape changes and cytoskeleton reorganisation during transendothelial migration of human melanoma cells. Cell Tissue Res 1998; 293: 375–387
- Delhon GA, Gonzalez MJ, Murcia PR. Susceptibility of sensory neurons to apoptosis following infection by bovine herpesvirus type 1. J Gen Virol 2002; 83: 2257–2267
- Doblhoffdier O, Gaida T, Katinger H, Burger W, Groschl M, Benes E. A novel ultrasonic resonance field device for the retention of animal cells. Biotechnol Progr 1994; 10: 428–432
- Wang ZW, Grabenstetter P, Feke DL, Belovich JM. Retention and viability characteristics of mammalian cells in an acoustically driven polymer mesh. Biotechnol Progr 2004; 20: 384–387
- Braga VMM, Machesky LM, Hall A, Hotchin NA. The small GTPases Rho and Rac are required for the establishment of cadherin-dependent cell-cell contacts. J Cell Biol 1997; 137: 1421–1431
- Johnson CP, Fujimoto I, Perrin-Tricaud C, Rutishauser U, Leckband D. Mechanism of homophilic adhesion by the neural cell adhesion molecule: Use of multiple domains and flexibility. Proc Natl Sci USA 2004; 101: 6963–6968
- Gumbiner BM. Cell adhesion: the molecular basis of tissue architecture and morphogenesis. Cell 1996; 84: 345–357
- Mary S, Charrasse S, Meriane M, Comunale F, Travo P, Blangy A, Gauthier-Rouviere C. Biogenesis of N-cadherin-dependent cell-cell contacts in living fibroblasts is a microtubule-dependent kinesin-driven mechanism. Mol Biol Cell 2002; 13: 285–301
- Le TL, Yap AS, Stow JL. Recycling of E-cadherin: a potential mechanism for regulating cadherin dynamics. J Cell Biol 1999; 146: 219–232
- Braga, V. Cadherin adhesion regulation in keratinocytes. In:. TP Fleming, editor. Cell-cell interactions. Oxford: Oxford University Press; pp, 1–36.
- Chen X, Kojima S, Borisy GG, Green KJ. p120 catenin associates with kinesin and facilitates the transport of cadherin-catenin complexes to intercellular junctions. J Cell Biol 2003; 163: 547–557
- Adams CL, Nelson WJ, Smith SJ. Quantitative analysis of cadherin-catenin-actin reorganisation during development of cell-cell adhesion. J Cell Biol 1996; 135: 1899–1911
- Monier-Gavalle F, Duband JL. Cross talk between adhesion molecules: control of N-cadherin activity by intracellular signals elicited by β1 and β3 integrins in migrating neural crest cells. J Cell Biol 1997; 137: 1663–1681
- Spinardi L, Rietdorf J, Nitch L, Bono M, Tacchetti C, Way M, Marchisio PC. A dynamic podosome-like structure of epithelial cells. Exp Cell Res 2004; 295: 360–374
- Peiper M, Yap AS. Traffic control: p120-catenin acts as a gatekeeper to control the fate of classical cadherins in mammalian cells. J Cell Biol 2003; 163: 437–440
- Hennings H, Holbrook KA. Calcium regulation of cell-cell contact and differentiation of epidermal cells in culture. Exp Cell Res 1983; 143: 127–142
- Watt FM, Mattey DL, Garrod DR. Calcium induced reorganisation of desmosomal components in cultured human keratinocytes. J Cell Biol 1984; 99: 2211–2215
- Manabe R, Kovalenko M, Webb DJ, Horwitz AR. GIT1 functions on a motile, multi-molecular signalling complex that regulates protrusive activity and cell migration. J Cell Sci 2002; 115: 1497–1510
- Scemes E, Duval N, Meda P. Reduced expression of P2Y1 receptors in connexin43-null mice alters calcium signalling and migration of neural progenitor cells. J Neurosci 2003; 23: 11444–11452
- Wetts R, Vaughn JE. Manipulation of intracellular calcium has no effect on rate of migration of rat autonomic motor neurons in organotypic slice cultures. Neuroscience 2000; 98: 369–376
- Friedl P, Brocker E-B. TCR triggering on the move: diversity of T-cell interactions with antigen-presenting cells. Immunolog Rev 2002; 186: 83–89
- Lozano E, Betson M, Braga VMM. Tumour progression: small GTPases and loss of cell-cell adhesion. Bioessays 2003; 25: 452–463
- Adam L, Mazumdar T, Sharma T, Jones TR, Kumar R. A three-dimensional and temporo-spatial model to study invasiveness of cancer cells by heregulin and prostaglandin E-2. Cancer Res 2001; 61: 81–87