Abstract
Understanding drug-membrane and drug-membrane protein interactions would be a crucial step towards understanding the action and biological properties of anthracyclines, as the cell membrane with its integral and peripheral proteins is the first barrier encountered by these drugs. In this paper, we briefly describe mitoxantrone-monolayer and mitoxantrone-bilayer interactions, focusing on the effect of mitoxantrone on the interactions between erythroid or nonerythroid spectrin with phosphatidylethanolamine-enriched mono- and bilayers. We found that mitoxantrone markedly modifies the interaction of erythroid and nonerythroid spectrins with phosphatidylethanolamine/phosphatitydcholine (PE/PC) monolayers. The change in Δπ induced by spectrins is several-fold larger in the presence of 72 nM mitoxantrone than in its absence: spectrin/mitoxantrone complexes induced a strong compression of the monolayer. Spin-labelling experiments showed that spectrin/mitoxantrone complexes caused significant changes in the order parameter measured using a 5′-doxyl stearate probe in the bilayer, but they practically did not affect the mobility of 16′-doxyl stearate. These results indicate close-to-surface interactions/penetrations without significant effect on the mid-region of the hydrophobic core of the bilayer. The obtained apparent equilibrium dissociation constants indicated relatively similar mitoxantrone-phospholipid and mitoxantrone-spectrin (erythroid and nonerythroid) binding affinities. These results might in part, explain the effect of mitoxantrone on spectrin distribution in the living cells.
| Acronyms | ||
| maximal binding capacity | = | Bmax |
| apparent equilibrium dissociation constant | = | KDapp |
| phosphatidylserine | = | PS |
| phosphatidylethanolamine | = | PE |
| phosphatidylcholine | = | PC |
| mitoxantrone | = | Mx |
| erythroid spectrin | = | SPe |
| nonerythroid spectrin | = | SPne |
Introduction
Mitoxantrone (Mx), 1,4-dihydroxy-5,8-bis [2-(2-hydroxyethylamino)ethylamino] anthracene-9,10-dione, belongs to a large group of drugs called quinoid anthracycline-related anti-cancer agents. These drugs are widely used in anti-neoplastic therapies, and their essential mode of intracellular action has been studied in detail. Mitoxantrone is an anthrecenedione, structurally related to the anthracycline antibiotics (). It has protonable nitrogens in its side chains, (CH2)2 spacers between its ring and side-chain nitrogens, a 1,4 location for the two of its side chains, and hydroxyl groups at positions 5 and 8, all of which give it a high degree of biological potency and efficacy. It displays activity against acute leukaemias, non-Hodgkin and Hodgkin lymphomas, melanoma, and cancer of the liver, prostate, bladder, head and neck Citation[1]. Mitoxantrone binds tightly to the DNA, preferentially at GC-rich DNA sites (5′(A/T)CG and 5′(A/T)CA), and covers three base pairs; the anthraquinone planar heterocyclic ring intercalates between the base pairs, while the two aminoethylamino side chains fit into the major groove of the DNA. Mitoxantrone causes chromatin compaction, produces damaging radicals, and interferes with topoisomerase II, inducing DNA strand breaks Citation[2–7]. Although DNA is the main target for anthracyclines, they do not solely interact with DNA. It was shown that mitoxantrone and other anthracyclines are adsorbed by the plasma membranes of living cells Citation[8], Citation[9] and that two types of interaction – electrostatic and hydrophobic – are involved in anthracycline-membrane association Citation[10]. The level of interaction of anthracyclines with zwitterionic phospholipids is limited, but their interaction with anionic lipids such as cardiolipin is responsible for the cardiotoxicity of anthracyclines. It was also postulated that anthracyclines (especially adriamycin) are absorbed by the polar headgroups of anionic lipids [see refs Citation[11] and Citation[12] for review]. However, considering the mechanisms that play a role during drug entry into the cell, it is not only anthracycline-lipid interactions that should be taken into account; as they translocate across the plasma membrane by passive diffusion, pharmaceuticals may encounter various proteins, especially those which compose the cyto- and membrane skeleton. It was recently demonstrated that chemotherapy combined with the administration of fludarabine, mitoxantrone and dexamethasone causes changes in the distribution of spectrin in lymphoid and leukaemic cells Citation[13]. Membrane and membrane protein interactions with anti-tumor antibiotics were studied by Chakrabarti et al. Citation[14], Citation[15]. They found that mithramycin and chromomycin A3, which are anti-tumor antibiotics of the aureolic acid group of antibiotics produced from Streptomyces plicatus and Streptomyces griseus, bind to erythroid spectrin with an affinity higher than that reported for DNA, and that these interactions lead to a change in the tertiary structure of the protein Citation[14]. Interactions of the same anti-tumor antibiotics with anionic phospholipid (dimyristoylphosphatidic acid) vesicles were also investigated. Membrane pertubations caused by mithramycin were observed in the case of small unilamellar liposomes (SUV) composed of DMPC/DMPA (dimyristoylphosphatidylcholine/ dimyristoylphosphatidic acid) and DMPC/PS Citation[15].
Figure 1. Chemical structure of mitoxantrone. Mitoxantrone; 1,4-dihydroxy-5,8-bis[2-(2-hydroxyethylamino)ethylamino]anthracene-9,10-dione. Source: PubChem.
![Figure 1. Chemical structure of mitoxantrone. Mitoxantrone; 1,4-dihydroxy-5,8-bis[2-(2-hydroxyethylamino)ethylamino]anthracene-9,10-dione. Source: PubChem.](/cms/asset/9efd8cd7-5943-4921-bd45-14e4ae78d545/imbc_a_160147_f0001_b.gif)
It is known that both erythroid and brain spectrin bind to artificial mono- and bilayers, preferentially to those which are aminophospholipid-enriched (mainly PE- or PS-enriched), and that PE-rich and PS-rich lipid-binding sites may occur in β spectrin Citation[16–20]. The aim of this study was to test whether mitoxantrone binds to erythroid and/or nonerythroid spectrin and in particular, whether it modifies spectrins’ binding to phospholipids in vitro. Since it was previously shown that both spectrins differ slightly in their lipid-binding characteristic Citation[19], it was interesting to compare the effect of the drug on lipid-binding of each spectrin.
In this study, it was shown that both spectrins in the presence of mitoxantrone evoked a much stronger effect on phosphatidylethanolamine/phosphatidylcholine (PE/PC) monolayer surface pressure values than in its absence (mitoxantrone alone does not affect the surface pressure values to a comparable level). This conclusion was supported by the results of spin labelling and circular dichroism (CD) experiments. We postulate that mitoxantrone associates with spectrin(s) causing small conformational changes which lead to the exposure of some additional, phospholipid binding sites on the molecules, modifying their interactions with phospholipids.
Materials and methods
Phosphatidylethanolamine (PE) and phosphatidylcholine (PC) were obtained from Lipid Products (Nutfield, UK), mitoxantrone (Mx) from Jelfa (Poland), sodium lauryl sulfate (SDS), dithiothreitol (DTT), ethylenediaminetetraacetic acid (EDTA), phenylmethylsulfonyl fluoride (PMSF) and Tris, β-mercaptoethanol from Carl Roth GmbH, and Sephacryl S-500, 5′-doxylstearic acid and 16′-doxylstearic acid from Sigma Aldrich.
Isolation of spectrins and liposome preparation
Bovine erythrocyte and brain spectrins were purified and their purity was assayed according to the methods cited previously [16, and references therein].
Small, unilamellar liposomes (SUV) composed of PE/PC (3/2), were respectively used in the EPR and in the binding experiments. A chloroform solution of a phospholipid mixture was dried under gaseous nitrogen and left overnight in a desiccator under reduced pressure in the dark. The obtained lipid films were hydrated using the appropriate buffer (PBS or column buffer), and vortexed. Then the suspension of liposomes was extruded (10 times) through 100-nm filters to obtain SUVs. The diameter of such liposomes was 159±10 nm (±SE) as was assessed by using a Zeta Sizer (Photon Correlation Spectrometer, Malvern, UK).
Binding assays
Binding assays of mitoxantrone with erythroid and nonerythroid spectrin were performed, respectively via gel filtration. For this purpose a Sephacryl S500 0.5×10 cm column was used. Erythroid or nonerythroid spectrin (0.2 µM, dialysed against PBS) were mixed with variable concentrations of mitoxantrone (0.2–200 µM), incubated at 37°C for 30 min, and applied onto the column. The concentration of the drug associated with spectrin(s) was determined spectrophotometrically (λ = 240, 275, 608 nm) in the spectrin fractions; the concentration of unbound drug was determined in the fractions eluting with the total column volume.
In binding assays for the liposome-mitoxantrone association, liposomes (PE/PC, 3/2, 10 mg/ml, extruded through 100 nm pore filter, see above) were incubated with mitoxantrone (0–400 µM) for 30 min. at 37°C. After incubation, samples were applied onto the Sephacryl S500 0.5×10 cm column. The concentration of the drug associated with liposomes was determined spectrophotometrically (see above) in the liposome fractions; the concentration of unbound drug was determined in the fractions eluting with the total column volume. All the analyses were performed in PBS buffer. The dithionite method Citation[21] showed that ∼50% fluorescent label (NBD-PE) was available from the surface of the vesicles, indicating that they were unilamellar. The apparent KD values were calculated using nonlinear regression according to the equation:where B is the bound drug per mg of lipid or mg of spectrin, Bmax is the maximal binding capacity, and Free is the free drug concentration.
Monolayer experiments
Monolayer measurements were carried out by using a Teflon trough with a surface area of 24 cm2 and a Nima tensiometer (Nima Technology, Coventry, UK) at room temperature. A subphase buffer (25 ml) containing 5 mM Tris/HCl, 0.5 mM EDTA, 150 mM NaCl, 0.5 mM DTT and 1 mM NaN3, pH 7.5, was stirred with a small stirrer bar (5×2 mm). Monolayers were formed by injecting a chloroform solution of a phospholipid mixture (PE/PC, 3/2, 10 mg/ml) into the buffer using a Hamilton syringe. Measurements were performed at initial monolayer surface pressure values of 10, 20 and 30 mN/m. Erythroid and nonerythroid spectrin were dialysed overnight against the subphase buffer, and then aliquots of each were injected into the subphase where mitoxantrone was present at a concentration of 72 nM. Surface pressure (π) measurements were taken. The presented results are the average values of several independent measurements with an average variation of not larger than 10%.
Spin labelling
Electron paramagnetic resonance spectra were recorded with a Bruker ESP 300E 9GHz spectrometer at 25°C, at magnetic field modulation frequencies of 100 kHz, over a scan range of 100 G. 5′-doxyl-stearate or 16′-doxyl-stearate were used as the spin labels and incorporated into the PE/PC(3:2) SUV (10 mg lipid/ml, see above) to a final spin label to membrane lipid molar ratio of less than 1%, in order to avoid line broadening effects in the EPR spectra. Labelling with 5′-doxyl-stearate or 16′-doxyl-stearate was performed by incubating the PE/PC SUV suspension for 30 min. at room temperature in 5 mM Tris/HCl, 150 mM NaCl, pH 7.4 buffer, in a glass test tube with a dry film of the spin label probes. Then, erythroid or nonerythroid spectrin (dialysed overnight against 5 mM Tris/HCl, 150 mM NaCl, pH 7.4 buffer) were added to the final concentration of 150 µg protein/ml and mitoxantrone to 13 µM. The order parameter values (S) were calculated according to the equation:where C = 1,4 − 0,053(T′II−T′⊥) Gauss Citation[22].
The rotational correlation time τ was estimated according to the relationship:Citation[23]where W0 is the peak-to-peak line width of the central nitroxide peak, in Gauss, and h0 and h−1 are the peak-to-peak line heights of the central and high field peaks, respectively. The mean values of at least three independent measurements are presented.
CD measurements
Circular dichroism spectra were recorded on the JASCO CD J-600 spectropolarimeter by using a thermostated cell with a 0.1-cm path length at temperatures ranging from 10–70°C in 10°C increments. Spectra were obtained with 0.2 nm resolution in the range of 190–250 nm. Spectra of mitoxantrone, taken at the same concentrations but without protein in the PBS buffer, were used for the spectral baseline correction.
Results
Mitoxantrone binds PE/PC liposomes with similar affinity to those for binding erythroid or nonerythroid spectrins
The aim of the described experiments was to test the direct binding of liposomal membranes and purified spectrin with mitoxantrone. A shows the results of the assays as the binding isotherm for mitoxantrone to PE/PC (3/2) monolayer vesicles. This lipid mixture was found by our previous studies to be optimal for interactions with spectrins, i.e., spectrin exerted the largest effect when monolayer contained 50–60% PE. Moreover, binding of both spectrin types to lipid mono- and bilayers proved sensitive to ankyrin inhibition suggesting its biological role Citation[17], Citation[20].
Figure 2. The apparent equilibrium dissociation constants for mitoxantrone association with lipids and erythroid or nonerythroid spectrin are similar. The binding isotherms of mitoxantrone with PE/PC (3/2) bilayers (A), mitoxantrone with erythroid spectrin (B) and mitoxantrone with nonerythroid spectrin (C). KDapp and Bmax values as well as standard error of the calculated fit are given in the insets.
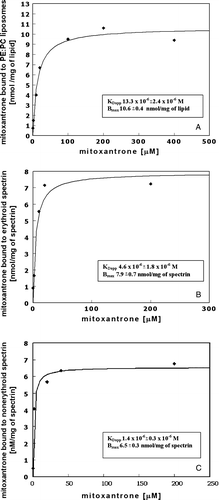
The binding isotherm shows the saturable binding of mitoxantrone to liposomes to have an apparent equilibrium dissociation constant (KDapp) value of 13.3×10⁻⁶ M and a maximal binding capacity of 10.6 nmol/mg of lipid. As was mentioned in Materials and methods, vesicles were essentially built from a single bilayer, therefore half of the lipid was available from the surface.
The gel filtration technique was used to determine the level of binding of mitoxantrone to erythroid (B) or nonerythroid (C) spectrin. Mitoxantrone associates with both spectrins in a saturable manner, with a KDapp value of 4.6×10⁻⁶ M and a maximal binding capacity of 7.9 nmol/mg for erythroid spectrin, and with a KDapp value of 1.4×10⁻⁶ M and a maximal binding capacity of 6.5 nmol/mg for nonerythroid spectrin. When isolated complex (a first peak fraction) was run again on the same column the amount of the dissociated drug did not exceed 10%. This does not affect a KDapp value and only slightly Bmax value. The apparent equilibrium dissociation constants for mitoxantrone association with lipids and erythroid or nonerythroid spectrin are similar in principle; the differences are confined within a range of one order of magnitude in favour of the proteins.
Mitoxantrone increases the effect of both spectrins on the surface pressure of PE/PC monolayer
The above data prompted us to test how the presence of mitoxantrone affects spectrin-phospholipid interactions. We used a well studied system, i.e., PE/PC in 3/2 ratio, namely it is known that both erythroid and nonerythroid spectrins easily interact with loose monolayers (i.e., those where the initial pressure oscillates around 8–10 mN/m) enriched in aminophospholipids. Spectrin was found to cause an increase in the surface pressure of such monolayers, which is probably due to its penetration into the lipid monolayer Citation[16–20]. Similar results were obtained in our experiments, where we used a PE/PC, 3/2, (w/w) lipid mixture to form loose monolayers (10 mN/m, see A, B), i.e., due to monolayer penetration the erythroid and nonerythroid spectrin used in the experiments induced a surface pressure increase in the loose monolayer (10 mN/m). Moreover, for moderate and dense monolayers, at respective initial surface pressures of 20 and 30 mN/m, a small decrease in surface pressure change could be observed (A, B), in particular for brain spectrin. It should be noted that the results presented in this figure represent data corrected for the control values, i.e., mitoxantrone alone vs. mitoxantrone with lipid monolayer, spectrin alone versus spectrin with lipid monolayer and spectrin plus mitoxantrone versus spectrin plus mitoxantrone with lipid monolayer.
Figure 3. Spectrins evoke a markedly larger effect on monolayer surface pressure values in the presence of mitoxantrone than in the absence of mitoxantrone. The effect of erythroid spectrin (A), nonerythroid spectrin (B), mitoxantrone (C), increasing concentrations of erythroid spectrin in the presence of a constant (72 nM) concentration of mitoxantrone (D), and increasing concentrations of nonerythroid spectrin in the presence of a constant (72 nM) concentration of mitoxantrone (E) on a PE/PC, 3/2, (w/w) monolayer at the initial surface pressures of 10 mN/m, 20 mN/m and 30 mN/m.
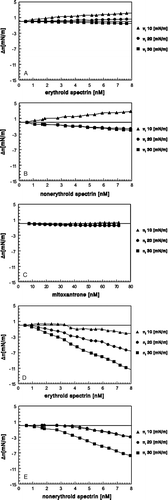
Mitoxantrone alone at concentrations up to 72 nM did not induce a significant surface pressure change in the loose, moderate or dense monolayers (C); the surface pressure changes ranged from 0.2–0.4 mN/m for all initial surface pressure values. For all the monolayers used here, at a constant mitoxantrone concentration (72 nM) and increasing erythroid or nonerythroid spectrin concentration, we observed a surface pressure decrease which was particularly significant in the case of dense monolayers; the same tendency could be seen for both erythroid and nonerythroid spectrins (D, E). These changes in surface pressure values were several-fold larger than those observed for the proteins or mitoxantrone analysed alone (A–C). For example, the Δπ change for 7 nM erythroid spectrin interacting with a PE/PC monolayer at πi=30 mN/m was less than 0.5 mN/m, while in the presence of 72 nM mitoxantrone, the Δπ change was ∼10 mN/m, which is a ∼20-fold greater change (compare A and D). These changes were not as dramatic in the case of nonerythroid spectrin, where under the same conditions, in the absence of the drug, the change was ∼1.5 mN/m, and in the presence of the drug, this value was ∼ − 7 mN/m (a ∼5-fold change, compare B and E). This effect may indicate the change in the conformation of both spectrins upon interaction with mitoxantrone, since each of the components added separately did not evoke a strong effect on the monolayer for all the three initial surface pressure values (A–C).
Mitoxantrone-spectrin complexes affect the acyl chain mobility in the bilayer close to polar head-group region but not in its mid-region
Keeping the above results in mind, it was interesting to test if the mitoxantrone binding affects interaction of spectrins with lipid bilayer, in particular, the mobility of fatty acid chains. For this purpose spin-labelling technique was applied. In the electron paramagnetic resonance experiments, SUV liposomes were labelled with one of two lipid spin labels: 5′-doxyl stearate to determine the membrane fluidity in the region close to the surface of the lipid bilayer, or 16′-doxyl stearate to explore the hydrophobic membrane core. The labelled liposomes were then incubated with erythroid or nonerythroid spectrin and/or their complexes with mitoxantrone. A and B illustrate the change in the order parameter of the bilayer in the presence of erythroid or nonerythroid spectrin, mitoxantrone (13 µM) and spectrin-mitoxantrone (SPe/Mx) or nonerythroid spectrin-mitoxantrone (SPne/Mx) complexes compared to that for a pure PE/PC bilayer.
Figure 4. Erythroid spectrin-mitoxantrone (Spe/Mx) and nonerythroid spectrin-mitoxantrone (SPne/Mx) complexes affect the mobility of fatty acyl chains in the region close to the surface of a lipid bilayer. The effect of erythroid spectrin (A) and nonerythroid spectrin (B), mitoxantrone (Mx) and spectrin/mitoxantrone complexes on the order parameter change (A, B) of a PE/PC (3/2) bilayer. The concentrations of mitoxantrone and spectrins were 13 µM and 150 µg/ml, respectively.
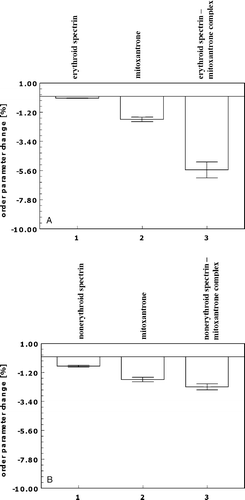
The results obtained indicate that the lipid bilayer has a decreased rigidity in the presence of the SPe/Mx or SPne/Mx complexes (5.5 and 2.7% decrease in order parameter respectively), while erythroid or nonerythroid spectrin or mitoxantrone alone induced smaller increase in fluidity. This increase was rather slight in the case of erythroid (less than 0.15%) and nonerythroid (less than 0.8%) spectrin, and larger in the case of mitoxantrone (∼1.5%). On the other hand, the rotational correlation time values calculated for a PE/PC bilayer labelled with 16′-doxyl stearate in the presence of erythroid or nonerythroid spectrin, mitoxantrone or SPe/Mx or SPne/Mx complexes compared to values for the pure bilayer indicated no significant change in fatty acyl chain mobility in the bilayer hydrophobic core in the presence of SPe/Mx or SPne/Mx complexes. This, together with the results obtained from measurements of the mobility of 5′-doxyl stearate, suggests that erythroid spectrin-mitoxantrone and nonerythroid spectrin-mitoxantrone complexes affect the mobility of fatty acyl chains rather in the region close to the surface than in the mid-region of the lipid bilayer.
Mitoxantrone affects the CD spectra of erythroid and nonerythroid spectrins
The results of monolayer and spin-labelling experiments indicate that spectrins in complex with mitoxantrone exert much stronger effect on the lipid mono- or bilayer than spectrins or mitoxantrone alone. The obvious suggestion is that spectrins upon binding might undergo conformational changes leading to the exposure of new phospholipids-binding sites. The possibility of the occurrence of such changes was tested by performing heat denaturation of both spectrins in the presence or absence of 1.3 or 13 µM mitoxantrone. Mitoxantrone, spectrins or spectrin/drug mixtures were exposed to increasing temperature from 10–70°C, at a rate of 1°C per min. Scans were taken in the range of 190–250 nm. The results of heating in the presence of mitoxantrone expressed as a fraction of the unfolded values are presented in A and B.
Figure 5. Erythroid and nonerythroid spectrin exibit a two-state transition thermal unfolding with possible folding intermediates in the presence of mitoxantrone. The thermal unfolding profile of erythroid (200 nM) and nonerythroid (200 nM) spectrin in complexes with mitoxantrone at two concentrations 1.3 µM and 13 µM is shown.
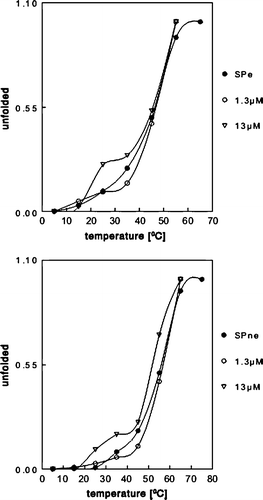
Erythroid and nonerythroid spectrin exhibit thermal unfolding as a single transition Citation[25–27]28 Citation[29], but in the presence of mitoxantrone, more than a two-state transition unfolding of protein may be observed. Erythroid spectrin has its midpoint at 51°C and nonerythroid spectrin has its midpoint at 55°C. The observed midpoints of unfolding erythroid spectrin in the presence of mitoxantrone at 1.3 µM and 13 µM were the same as for both proteins alone. The additional peaks in the denaturation profiles in the presence of mitoxantrone in the case of both spectrins may suggest the occurrence of unfolding intermediates, which could result from local, conformational changes.
Discussion
Mitoxantrone is commonly used in various types of chemotherapy, alone or more often in combinaton with fludarabine and dexamethasone, and its mode of action has been described Citation[3–7]. In this study, we investigated whether mitoxantrone may interact directly with the components of the plasma membrane lipids and peripheral proteins. In particular, it was interesting to test if mitoxantrone modifies the interaction of spectrins with the membrane phospholipid bilayer. As regards its LogP parameters (1.188, according to PubChem), mitoxantrone has rather weak hydrophobic properties, but at pH∼7, it still remains a charged, weakly basic molecule. It should be noted that mitoxantrone dimerizes at a concentration above 5 µM. In this study, we focused on the effect of mitoxantrone on interactions with erythroid or nonerythroid spectrin with phosphatidylethanolamine-enriched mono- and bilayers. It was shown here that both spectrins bind mitoxantrone with moderate-to-high affinity (apparent equilibrium dissociation constant of 4.8×10⁻⁶ M and 1.4×10⁻⁶ M) comparable to phospholipid-mitoxantrone binding affinity. This is different from what was found by Garnier-Suillerot and Gattegno for adriamycin Citation[24]. Perhaps the difference in the structure, electronegativity or the methodology would be a reason for this difference.
We found that mitoxantrone showed weak interactions with PE/PC (3/2) monolayers (C) and it did not cause significant surface pressure changes; however, significant changes (5–20-fold) in surface pressure were observed when mitoxantrone was present in the subphase in a mixture with erythroid or nonerythroid spectrin. We interpreted this to be a result of the interaction of the drug with spectrin and to be due to mitoxantrone's own potential ability to cause a local change in spectrin conformation. Such erythroid spectrin/Mx, nonerythroid spectrin/Mx complexes could cause the compression of the monolayer or pull lipids out from the surface layer. Similar changes were observed, e.g. in the case of annexin Ca2 + or spectrin Citation[29], Citation[30] interacting with a dense monolayer built of PS. Our results of the pelleting assay performed for fluorescently-labeled erythroid spectrin indicate its 2-fold increase in affinity towards PE/PC (3/2) liposomal membrane in the presence of 72 nM mitoxantrone (data not shown). Thus we may conclude that the results presented above from monolayer and spin-labelling experiments could be explained by increased binding of spectrins to the membrane. It should be noted that mono- and bilayers prepared from PE/PC mixtures have the potential for lateral phase separation [e.g., Citation[31]]. Perhaps phase boundaries form binding sites for both spectrins Citation[32], in particular, for their complexes with mitoxantrone. To test for the potential changes in spectrin conformation, we performed thermal denaturation using CD spectra. These experiments showed that mitoxantrone caused the appearance of additional peaks in the case of both spectrins, the occurrence of which might suggest the presence of folding intermediates in the presence of mitoxantrone. These folding intermediates could result from small conformation changes of spectrin molecules. Would it explain the dramatic surface pressure decrease found when a spectrin/mitoxantrone complex was brought into contact with a PE/PC monolayer? We may speculate that in spectrin, due to its local conformational changes, new phospholipid-binding site(s) arise in addition to existing phospholipid (especially PS and PE) binding sites Citation[16–20]. To further characterize the spectrin/mitoxantrone interactions with the bilayer, we conducted spin-labelling experiments. The results obtained indicated that rather significant changes had occurred in the order parameter change for the 5′-doxyl stearate spin label (in the hydrophobic region close to polar headgroup zone), while weak or no changes took place within mid-region of the hydrophobic part of the bilayer. We may therefore conclude that SPe/Mx and SPne/Mx complex interactions with PE/PC bilayers showed a disordering character in agreement with experimental results obtained from the measurement of surface pressure changes in the PE/PC monolayers. The results presented above may suggest that mitoxantrone-spectrin association induces protein conformational changes and exposure of additional phospholipid-binding sites on the spectrin molecule. This could have a consequence in, e.g., additional apoptotic signalling initiation by re-organization of the membrane and cytoskeleton. Re-organization of spectrin together with PKCΘ was found to be an early apoptotic event preceding PS exposure that could be used as an early marker of apoptosis (Dubielecka et al. submitted). Further studies are being carried out to explain the mechanism of action of mitoxantrone on the membrane/membrane skeleton functions in the cell.
This study was supported by KBN grant no. 3P04C09725 and COST Action D22.
References
- Loadman PM, Calabrese CR. Separation methods for anthraquine related anti-cancer drugs. J Chromat B 2001; 764: 193–206
- Wang S, Peng T, Yang CF. Electrochemical determination of interaction parameters for DNA and mitoxantrone in an irreversible redox process. Biophys Chem 2003; 104: 239–248
- Baily C, Routier S, Bernier JL, Waring MJ. DNA recognition by two mitoxantrone analogues: influence of the hydroxyl groups. FEBS Lett 1996; 379: 269–272
- Chiang SY, Azizkhan JC, Beerman TA. A comparison of DNA-binding drugs as inhibitors of E2F1- and Sp1-DNA complexes and associated gene expression. Biochemistry 1998; 37: 3109–3115
- Chou KM, Krapcho AP, Horn D, Hacker M. Characterization of anthracenediones and their photoaffinity analogs. Biochem Pharm 2002; 63: 1143–1147
- Boland MP, Fitzgerald KA, O‘Neill LAJ. Topoisomerase II is required for mitoxantrone to signal nuclear factor κB activations in HL60 cells. J Biol Chem 2000; 275: 25231–25238
- Barasch D, Zipori O, Ringel I, Ginsburg I, Samuni A, Katzhendler J. Novel anthraquinone derivatives with redox-active functional groups capable of producing free radicals by metabolism: Are free radicals essential for cytotoxicity?. Eur J Med Chem 1999; 34: 597–615
- Breuzard G, Angiboust JF, Jeanesson P, Manfait M, Millot JM. Surface-enhanced Raman scattering reveals adsorption of mitoxantrone on plasma membrane of living cells. Biochem Biophys Res Commun 2004; 320: 615–621
- Lecompte MF, Laurent G, Jaffrezou JP. Sphingomyelin content conditions insertion of daunorubicin within phosphatidylcholine monolayers. FEBS Lett 2002; 525: 141–144
- Arancia G, Bordi F, Calcabrini A, Diociaiuti M, Molinari A. Ultrastructural and spectroscopic methods in the study of the anthracycline-membrane interactions. Pharmacol Res 1995; 32: 255–275
- Bordi F, Cametti C, Motta A, Diociaiuti M, Molinari A. Interactions of anthracyclines with zwitterionic phospholipid monolayers at the air-water interface. Bioelectrochem Bioenerg 1999; 49: 51–56
- Heywang C, Saint-Pierre Chazalet M, Masson M, Bolard J. Orientation of antharacyclines in lipid monolayers and planar asymmetrical bilayers: A surface-enhanced resonance Raman scattering study. Biophys J 1998; 75: 2368–2381
- Dubielecka PM, Jazwiec B, Potoczek S, Wrobel T, Miloszewska J, Haus O, Kuliczkowski K, Sikorski AF. Changes in spectrin organisation in leukaemic and lymphoid cells upon chemotherapy. Biochem Pharmacol 2005; 69: 73–85
- Majee S, Dasgupta D, Chakrabarti A. Interaction of the DNA-binding antitumor antibiotics, chromomycin and mithramycin with erythroid spectrin. Eur J Biochem 1999; 260: 619–626
- Majee S, Chakrabarti A. Membrane interaction of an antitumor antibiotic, mithramycin, with anionic phospholipid vesicles. Biochem Pharm 1999; 57: 981–987
- Diakowski W, Szopa J, Sikorski AF. Occurrence of lipid receptors inferred from brain and erythrocyte spectrins binding NaOH-extracted and protease-treated neuronal and erythrocyte membranes. Biochim Biophys Acta 2003; 1611: 115–122
- Diakowski W, Prychidny A, Świstak M, Nietubyć M, Białkowska K, Szopa J, Sikorski AF. Brain spectrin (fodrin) interacts with phospholipids as revealed by intrinsic fluorescence quenching and monolayer experiments. Biochem J 1999; 388: 83–90
- An X, Guo X, Sum H, Morrow J, Gratzer W, Mohandas N. Phosphatidylserine binding sites in erythroid spectrin: Location and implications for membrane stability. Biochemistry 2004; 43: 310–331
- Diakowski W, Sikorski AF. Brain spectrin exerts much stronger effect on anionic phospholipid monolayers that erythroid spectrin. Biochim Biophys Acta 2002; 1564: 403–411
- Białkowska K, Leśniewski J, Nietubyć M, Sikorski AF. Interaction of spectrin with phospholipids is inhibited by isolated erythrocyte ankyrin. A monolayer study. Cell Mol Biol Lett 1999; 4: 203–218
- Langner M, Hui SW. Dithionite penetration through phospholipids bilayers as a measure of defects in lipid molecular packing. Chem Phys Lipids 1993; 65: 23–30
- Sefton BM, Gaffney BJ. Effect of the viral proteins on the fluidity of the membrane lipids in Sindbis virus. J Mol Biol 1974; 90: 343–358
- Esmann M, Horvath LI, Marsh D. Saturation-transfer electron spin resonance studies on the mobility of spin-labeled sodium and potassium ion activated adenosinetriphosphatase in membranes from Squalus acanthias. Biochemistry 1987; 26: 8675–8683
- Garnier-Suillerot A, Gattegno L. Intercation of adriamycin with human erythrocyte membranes. Role of the negatively charged phospholipids. Biochim Biophys Acta 1988; 936: 50–60
- Di Stasi AMM, Petrucci TC, Minetti M. Comparison of thermal properties of bovine spectrin and fodrin. Arch Biochem Biophys 1987; 256: 144–149
- Kahana E, Gratzer WB. Minimum folding unit of dystrophin rod domain. Biochemistry 1995; 34: 8110–8114
- Calvert R, Kahana E, Gratzer WB. Stability of the dystrophin rod domain fold: Evidence for nested repeating units. Biophys J 1996; 71: 1605–1610
- MacDonald RI, Cummings JA. Stabilities of folding of clustered, two-repeat fragments of spectrin reveal a potential hinge in the human erythroid spectrin tetramer. Proc Natl Acad Sci USA 2004; 101: 1502–1507
- Bandorowicz-Pikuła J, Sikorski AF, Białkowska K, Sobota A. Interaction of annexins IV and VI with phosphatidylserine in the presence of Ca2 + : Monolayer and proteolytic study. Mol Membrane Biol 1996; 13: 241–250
- DeWolf C, McCauley P, Pinder JC. Regulation of the mechanical properties of the red blood cell membrane by protein-protein and protein-lipid interactions. Cell Mol Biol Lett 1996; 1: 89–96
- Shin K-H, Maeda H, Fujiwara T, Akutsu H. Molecular miscibility of phosphatidylcholine and phosphatidylethanolamine in binary mixed bilayers with acidic phospholipids studied by 3H- and 31P-NMR. Biochim Biophys Acta. 1995;1238:42–48.