Abstract
Novel effects of cholesterol (Chol) on nicotinic acetylcholine receptor (AChR) cell-surface stability, internalization and function are reported. AChRs are shown to occur in the form of submicron-sized (240–280 nm) domains that remain stable at the cell-surface membrane of CHO-K1/A5 cells over a period of hours. Acute (30 min, 37°C) exposure to methyl-β-cyclodextrin (CDx), commonly used as a diagnostic tool of endocytic mechanisms, is shown here to enhance AChR internalization kinetics in the receptor-expressing clonal cell line. This treatment drastically reduced (∼50%) the number of receptor domains by accelerating the rate of endocytosis (t1/2 decreased from 1.5–0.5 h). In addition, Chol depletion produced ion channel gain-of-function of the remaining cell-surface AChR, whereas Chol enrichment had the opposite effect. Fluorescence measurements under conditions of direct excitation of the probe Laurdan and of Förster-type resonance energy transfer (FRET) using the intrinsic protein fluorescence as donor both indicated an increase in membrane fluidity in the bulk membrane and in the immediate environment of the AChR protein upon Chol depletion. Homeostatic control of Chol content at the plasmalemma may thus modulate cell-surface organization and stability of receptor domains, and fine tune receptor channel function to temporarily compensate for acute AChR loss from the cell surface.
| Acronyms | ||
| AChR | = | nicotinic acetylcholine receptor |
| αBTX | = | α-bungarotoxin |
| Chol | = | cholesterol |
| GP | = | generalized polarization |
| CDx | = | methyl-β-cyclodextrin |
| Chol-CDx | = | cholesterol-methyl-β-cyclodextrin |
Introduction
The fast timescale of the signaling mechanism operating at the cholinergic synapse calls for small, confined reaction volumes and sufficiently high concentrations of the reactant species. These requirements are fulfilled by the transduction of the chemical signal encoded in the neurotransmitter acetylcholine into the electrical signal mediated by the AChR. In the postsynaptic membrane of the adult neuromuscular junction and electromotor synapses, AChR molecules are packed at very high densities (15,000–20,000 µm2) (Sanes & Lichtman [Citation2001]). Thus the maintenance of adequate numbers of AChRs at the cell membrane plays a critical role in receptor physiology.
Several studies have demonstrated that AChR arrays are embedded in a lipid microenvironment that differs in physical terms from the rest of the membrane bilayer, and that the presence of both Chol and negatively charged phospholipids is essential for appropriate receptor function (Jones & McNamee [Citation1988], Barrantes [Citation2004]). Labelling and tryptic digestion studies have demonstrated that transmembrane segments of the AChR interact with Chol (Corbin et al. [Citation1998]) and steroids (Blanton et al. [Citation1999]). Selectivity of other steroids like cholestane and androstane for the purified, reconstituted AChR and for transmembrane peptides has been demonstrated (Barrantes et al. [Citation2000]).
In this work we have studied the effect of acute Chol modification on cell surface stability and function of AChR expressed in CHO-K1 cells. These cells constitute a minimalist, aneural mammalian cell expression system devoid of AChR-anchoring proteins involved in AChR clustering, such as rapsyn and tyrosine kinases. We show that CDx-mediated Chol depletion induces a rapid internalization of cell surface AChR, as assessed by ligand binding, fluorescence microscopy and patch-clamp recording. Plasma membrane sheets generated by cell unroofing enabled us to visualize the submicron-sized organization of AChRs at diffraction-limited resolution. Domains or clusters of this size, resolved for the first time in a non-neural cell using wide-field microscopy, could be the equivalent of the pre-innervation stage of AChR organization in neuromuscular development. Furthermore, the functional consequences of Chol modification assessed in parallel using the patch-clamp technique suggest that Chol acts as a modulator of AChR ion channel properties. The stability of AChR domains at the cell surface is strongly dependent on Chol content; Chol depletion accelerates endocytic internalization of these domains, suggesting that the gain-of-function changes in channel activity constitute a compensatory mechanism for the temporary loss of receptors normally available at the plasmalemma.
Materials and methods
Materials
Methyl-β-cyclodextrin (CDx), Chol, acetylcholine chloride, native α-bungarotoxin (αBTX) and carbamoylcholine were from Sigma Chemical Co. (St Louis, MO). The Aquaplex methyl-β-cyclodextrin-Chol complex (Chol-CDx) was from Cyclodextrin Technologies (Gainswille, FL). [125I]- αBTX (120 µCi/µmol) was purchased from New England Nuclear (Boston, Mass.). Alexa Fluor488- and Alexa Fluor594-labelled αBTX, Cy3-labelled anti-rabbit and Alexa488-labelled anti-rat antibodies were purchased from Molecular Probes (Eugene, OR). Polyclonal H-101 against the β AChR subunit was from Santa Cruz Biotechnology Inc. (Santa Cruz, CA), and mAb 210 antibody against the α subunit was a gift from Dr J. Lindstrom, Univ. of Pennsylvania Med. Center.
Cell culture
CHO-K1/A5 cells were grown in Ham's F12 medium supplemented with 10% fetal bovine serum (FBS) for 2–3 days at 37°C as in Roccamo et al. ([Citation1999]).
Subcellular fractionation and binding assays
Plasma membranes from CHO-K1/A5 cells were isolated by differential centrifugation on sucrose gradients following the method of Gimpl et al. ([Citation1996]). The enzymatic activities of 5’-nucleotidase and Na+-K+ ATPase were measured as marker enzymes to assess membrane purity. Typically, membrane fragments isolated from CHO-K1/A5 cells had specific activities in the order of 0.3–0.5 nmole αBTX sites/mg protein, as determined by [125I]-αBTX binding assays. Protein assays, binding isotherms and Scatchard analysis were performed as in Roccamo et al. ([Citation1999]).
Chol modification of cells and purified plasma membranes
In an initial series of experiments, a range of CDx concentrations (5–30 mM) was assayed on CHO-K1/A5 cells (37°C, 30 min–1 h) to deplete their Chol content. At the highest concentrations used, changes in cell morphology were observed within 20–30 min: cells became spherical and were more fragile, and gentle tapping of the coverslip resulted in cell detachment. Very high CDx concentrations were found to be deleterious for cell viability, in agreement with observations by Fukasawa et al. ([Citation2000]). For this reason CDx concentrations in the 10–15 mM range and for a maximal period of 30 min were used unless otherwise stated. In the case of plasma membranes isolated by differential centrifugation on sucrose gradients, CDx treatment was performed as with intact cells, except that membranes were washed by centrifugation after CDx treatment. For Chol replenishment, either untreated or CDx-treated membranes were washed by a brief (5 min) centrifugation and subsequently incubated with 3.5 mM Chol-CDx complexes (CDx/Chol = 6) at 30°C for 20 min. Membranes were finally washed by centrifugation before fluorescence spectroscopy.
Biochemical assays
Lipids were extracted overnight at 4°C in chloroform:methanol: water (1:2:0.8, by vol.) from cell suspensions following the procedure of Bligh and Dyer ([Citation1959]). Chol determination was carried out using the fluorescence Amplex Red cholesterol Assay Kit (Molecular Probes) or the colorimetric Colestat kit (Wiener Lab, Rosario, Argentina).
Wide-field fluorescence microscopy
Cells were stained with Alexa488-αBTX for 1 h on ice in chilled medium 1 (“M1”: 140 mM NaCl, 20 mM HEPES, 1 mM CaCl2, 1 mM MgCl2, 5 mM KCl, pH 7.4). They were then examined with a Nikon Eclipse E-300 inverted fluorescence microscope using a Hamamatsu ORCA ER CCD camera driven by Metamorph. Appropriate dichroic and emission filters were employed to avoid crossover of fluorescence emission. 8-bit or 16-bit TIFF images were exported for further off-line analysis.
Confocal microscopy
Cells initially labelled with Alexa488-αBTX for 1 h at 4°C were shifted to 37°C for 30 min in the presence of CDx or M1, respectively. Confocal images were obtained with a Leica TCS-SP2 confocal microscope equipped with an acousto-optical beam splitter.
Fluorescence microscopy of membrane sheets
For preparation of membrane sheets, CHO-K1/A5 cells were grown on polylysine-coated glass coverslips and disrupted as previously described (Sieber et al. [Citation2006]) using a single (100–300 ms) ultrasound-pulse in KGlu buffer (20 mM Hepes, pH 7.2, containing 120 mM potassium glutamate and 20 mM potassium acetate). In the case of Chol extraction of membrane sheets, the latter were incubated for 30 min at 37°C in KGlu-buffer containing 10–15 mM CDx, followed by washing with ice KGlu buffer. They were then stained for 60 min at RT with 1 µg/ml Alexa594-αBTX in KGlu buffer containing 3% BSA, washed 2–3 times in KGlu-buffer, fixed for 30 min in PBS (150 mM NaCl, 10 mM Na2HPO4, 10 mM NaH2PO4, pH 7.4) containing 4% PFA, and washed with PBS and with NH4Cl for 20 min. Labelling with H-101 or mAb-210 antibodies and the rabbit- or rat-labelled secondary antibodies was carried out at 4°C. In some experiments PFA fixation preceded Alexa594-αBTX and antibodies staining. When Chol depletion was performed prior to obtention of membrane sheets, CHO-K1/A5 cells were treated with 10–15 mM CDx in Ringer's saline (130 mM NaCl, 4 mM KCl, 5 mM CaCl2, 1 mM MgCl2, 48 mM glucose, 10 mM Hepes buffer, pH 7.3) for 30 min at 37°C. Cells were then washed, sonicated, stained, and fixed as described above. Imaging was performed in PBS containing 25 µl/ml of a saturated TMA-DPH solution in order to identify and record membrane sheets in the blue channel thus avoiding biased selection according to staining intensities in the red (Alexa594-αBTX) channel. Membrane sheets were examined using a Zeiss Axiovert 100 TV fluorescence microscope using a 100x 1.4 N.A. planachromatic objective and a back-illuminated frame transfer CCD-camera (13×13 µm pixel size, Princeton Instruments Inc.) with a magnifying lens (1.6x Optovar) to avoid spatial undersampling by the large pixels. Alternatively, a Nikon E-300 fluorescence microscope with a 100x 1.4 N.A. planapochromatic oil immersion objective driven by a piezoelectric nano-positioning system (PI Instruments GmbH) was employed in conjunction with a Hamamatsu ORCA ER CCD camera driven by Metamorph. Appropriate dichroic and emission filters were employed to avoid crossover of fluorescence emission.
Quantitative image analysis
Fluorescence intensities of the 8- or 16-bit image were analysed after manually outlining regions of interest (ROI) with the software ScionImage. The average fluorescence intensity of a given ROI was measured within the αBTX-positive region of the cell and the average fluorescence intensity of an area of the same size positioned over an αBTX-negative region outside the cell was subtracted. These measurements were undertaken on randomly chosen cells, selected from phase contrast images to avoid bias, for each experimental condition. Images of membrane sheets were analysed with Metamorph. Fluorescence intensity was quantified by centering a 5–10 µm2 region of interest on the membrane sheets as selected in the TMA-DPH channel and measuring the average intensity in the corresponding red channel and subtracting local background measured in an area outside the membrane sheets. For each condition, 18–36 (mean = 26) membrane sheets were analysed. Analysis of the fluorescent-labelled AChR puncta in single sheets involved densitometric scanning of individual spots, and fitting of the intensity profiles with a Gaussian distribution function. Analysis was carried out on more than 30 fields, employing 100–200 spots for each experimental condition. Values are given as mean±SD of at least three independent experiments. For illustration purposes, images were processed using Adobe Photoshop, scaled with identical parameters, and pseudo-colored according to a custom designed look-up-table (LUT).
Fluorescence spectroscopy measurements
All fluorimetric measurements were performed in an SLM model 4800 fluorimeter (SLM Instruments, Urbana, IL) using a vertically polarized light beam from a Hannovia 200-W mercury/xenon arc equipped with a Glan-Thompson polarizer (4-nm excitation and emission slits) and 1 ml quartz cuvettes. Emission spectra were corrected for wavelength-dependent distortions. The temperature was set at 22°C with a thermostated circulating water bath (Haake, Darmstadt, Germany).
Laurdan generalized polarization (GP) measurements in direct and FRET modes.
Laurdan GP was measured as in Antollini et al. ([Citation1996]) using the following algorithm (Parasassi et al. [Citation1990]):1 where I434 and I490 are the emission intensities at the characteristic wavelength of the gel phase (434 nm) and the liquid-crystalline phase (490 nm), respectively. The excitation wavelengths were 360 nm and 290 nm for direct excitation and Förster resonance energy transfer (FRET) conditions, respectively. Inner filter effects were corrected according to the following formalism:
2 where I is the measured fluorescence intensity of the Trp (330 nm) excited at 290 nm, and OD290 and OD330 are the optical densities of the sample at the excitation and emission wavelength, respectively.
TMA-DPH fluorescence polarization and anisotropy measurements
Control and 15 mM CDx-treated membrane samples (50 µg protein/ml) from CHO-K1/A5 cells were labelled with TMA-DPH (stock solution 1 mM in ethanol) at a final concentration of 1 µM and incubated for 40–60 min at room temperature in the dark. The amount of organic solvent added was kept in all cases below 0.1%. The excitation wavelength was set at 365 nm for TMA-DPH excitation (emission 425 nm) with a slit width of 5 nm. Fluorescence data were corrected for wavelength-dependent distortions and dilution effects. Correction of the inner filter effect (see above) also implicitly takes into account the turbidity of AChR membranes (O.D. <0.1). All experiments were carried out at 20°C.
Patch-clamp electrophysiology
Whole-cell currents were recorded at a holding potential of −70 mV and at 20°C using an Axopatch 200B patch-clamp amplifier (Axon Instruments, Inc., Union City, CA), digitized at 94 kHz with an ITC-16 interface (Instrutech Corporation, Long Island, NY) and transferred to a computer using the program PULSE (HEKA). The extracellular solution contained 140 mM NaCl, 5 mM KCl, 1.8 mM CaCl2, 1.7 mM MgCl2 and 25 mM HEPES (pH 7.4) and the intracellular solution contained 145 mM KCl, 5 mM NaCl, 1 mM EGTA and 25 mM HEPES (pH 7.4). Patch pipettes were pulled from Kimax-51 capillary tubes (Kimble Products, Vineland, NJ), and fire-polished. Pipette resistances ranged from 2–3 MΩ. Upon high-resistance sealing, cells were lifted from the bottom of the dish and ACh (30 µM) was delivered using a Warner SF 77 Fast Step perfusion system (Warner instruments, Hamden, CT) under computer control. The solution around the cell could be completely exchanged within 10–15 ms. The cells were exposed to the agonist flow for 3 sec and washed with buffer to enable multiple recordings while avoiding significant desensitization. Chol modification was accomplished by addition of CDx (or Chol-CDx) to an equal volume of external solution in the dish. Single-channel recordings were obtained in the cell-attached configuration as in Zanello et al. ([Citation1996]) at a membrane potential of −70 mV and 20°C and digitized using the program Acquire (Bruxton Corporation, Seattle, WA). Detection of single-channel events using the program TAC (Bruxton Corp.) followed the half-amplitude threshold criterion at a bandwidth of 5 kHz. Open- and closed-time histograms were plotted using a logarithmic abscissa and a square root ordinate and fitted to the sum of exponential functions by the maximum likelihood criterion using the program TACFit (Bruxton Corp.). Bursts were defined as a group of opening events separated by closed times briefer than a specified time given by the intersection between the first component and the following component of the closed-time histograms, constructed using 7000–12,000 events. Clusters of openings were analysed with the program IDL (www.qub.buffalo.com). Because each cluster contains one more opening than closing event, we only used data for clusters with more than 10 opening events. The mean burst duration was calculated as the product of the number of openings and the mean opening duration plus the product of the number of closed events and the mean closed duration within a cluster. The burst duration histograms were constructed using only data on clusters in which popen and τopen were within 2 SD.
Results
CDx-mediated modification of Chol content in cells and purified CHO-K1/A5 cell-surface membranes
CHO-K1/A5 is a clonal cell line obtained in our laboratory that heterologously expresses adult-type muscle AChR (Roccamo et al. [Citation1999]). The degree of modification of the Chol content exerted by CDx treatment was measured by fluorimetric Chol assays in whole cells and in isolated membrane fractions. Diminutions of up to 60–65% were obtained upon treating living CHO-K1/A5 cells with maximal concentrations (30 mM) of CDx for 30 min at 37°C. To evaluate the effects of Chol depletion on the cell membrane proper, these were purified from CHO-K1/A5 cells by subcellular fractionation and treated with 10–30 mM CDx for 30 min at 37°C. Chol content decreased in a concentration-dependent manner up to ∼90–95% (data not shown); 10 mM CDx treatment attained ∼50% diminution. Subsequent treatment of Chol-depleted membranes with CDx loaded with Chol (Chol-CDx) replenished their Chol content to control values (see also Section on Laurdan fluorescence below), and in some cases an overshoot effect was observed, with slightly higher values than those of the control membranes (data not shown). Chol-depleted CHO cells do not, by themselves, replenish Chol within this time range (Vrljic et al. [Citation2005]). These assays indicate that: (a) Chol content can be depleted by CDx treatment, either in whole cells or isolated membranes; (b) a more drastic Chol depletion can be accomplished in isolated membranes, devoid of energy supply and Chol homeostatic mechanisms operating in the living cell; and (c) Chol is not present in saturating amounts, since its content could be increased by exogenous supply via Chol-CDx.
Chol depletion with CDx reduces the number of cell-surface AChRs
[125I]α -BTX binding assays on living CHO-K1/A5 cells showed that the amount of this competitive antagonist bound to the cell surface of intact cells diminished in a concentration-dependent manner upon treatment with CDx, reaching maximal values (∼70% decrease) at 30 min using 30 mM CDx at 37°C (A). Concentrations of 10–15 mM CDx for 30 min were used in all subsequent experiments unless otherwise stated (see Material and methods). The apparent dissociation constant of the AChRs remaining at the cell surface of living cells for [125I] αBTX (1.10±0.05 nM) did not change upon CDx treatment (A, inset).
Figure 1. (A) Decreased number of cell-surface AChR (Bmax) and lack of changes in apparent dissociation constant (Kdapp) of remaining αBTX sites upon Chol depletion. CHO-K1/A5 cells were incubated for 30 min in the presence (▵) or absence (control, ▪) of the indicated CDx concentrations. Surface AChR is expressed as fmol of [125I]- αBTX/mg protein. Bmax and Kdapp were obtained from the Scatchard plots (inset) of the saturation isotherms obtained with [125I]-αBTX in the 5–60 nM range. (B) CDx treatment increases the number of cell-surface TfR. CHO-K1/A5 cells were incubated for 30 min at 37°C in buffer (control) or in buffer containing 15 mM CDx, then labelled with Cy5-Tf and the amount of surface TfR was measured by fluorescence microscopy. Values are expressed in arbitrary fluorescence intensity units. (C) Time-course of ACh-induced current amplitude upon Chol depletion in living CHO-K1/A5 cells measured by whole-cell patch-clamp recordings. CHO-K1/A5 cells were incubated with 10 mM CDx (▵) or external solution (control condition, ▪). The currents were normalized and expressed as % of the peak current at t = 0. Data represent the mean±SD of at least 3 independent experiments. The asterisk indicates a statistical significance of p<0.05.
![Figure 1. (A) Decreased number of cell-surface AChR (Bmax) and lack of changes in apparent dissociation constant (Kdapp) of remaining αBTX sites upon Chol depletion. CHO-K1/A5 cells were incubated for 30 min in the presence (▵) or absence (control, ▪) of the indicated CDx concentrations. Surface AChR is expressed as fmol of [125I]- αBTX/mg protein. Bmax and Kdapp were obtained from the Scatchard plots (inset) of the saturation isotherms obtained with [125I]-αBTX in the 5–60 nM range. (B) CDx treatment increases the number of cell-surface TfR. CHO-K1/A5 cells were incubated for 30 min at 37°C in buffer (control) or in buffer containing 15 mM CDx, then labelled with Cy5-Tf and the amount of surface TfR was measured by fluorescence microscopy. Values are expressed in arbitrary fluorescence intensity units. (C) Time-course of ACh-induced current amplitude upon Chol depletion in living CHO-K1/A5 cells measured by whole-cell patch-clamp recordings. CHO-K1/A5 cells were incubated with 10 mM CDx (▵) or external solution (control condition, ▪). The currents were normalized and expressed as % of the peak current at t = 0. Data represent the mean±SD of at least 3 independent experiments. The asterisk indicates a statistical significance of p<0.05.](/cms/asset/e9365cd8-4bb8-4f04-adb8-05f0b078180d/imbc_a_190258_f0001_b.gif)
In order to determine whether other cell-surface proteins were affected by Chol depletion, we tested another constitutive cell membrane protein of CHO-K1/A5 cells, i.e., the transferrin receptor (TfR). When cells were submitted to Chol depletion by treatment with 15 mM CDx for 30 min at 37°C and subsequently incubated with Cy5-labelled Tf, the cell-surface fluorescence intensity of the TfR did not decrease but in fact increased significantly, in agreement with literature reports (reviewed by Pichler & Riezman [Citation2004], Subtil et al. [Citation1999]) (B). Thus, Chol depletion appears to reduce the number of cell-surface AChRs but not that of TfRs.
An alternative estimation of the number of cell-surface receptors is the assessment of the total agonist-induced current as measured by whole-cell patch-clamp recordings; this series of experiments provided an independent estimation of the pool of AChRs at the plasma membrane and of the CDx effect on the number of receptors. AChR whole-cell current measurements in CHO-K1/A5 cells along the Chol depletion treatment are shown in C. Treatment with 10 mM CDx resulted in a progressive reduction of the macroscopic whole-cell current amplitudes elicited by 30 µM ACh, which occurred within a time course of minutes. The electrophysiological data thus independently corroborates the decrease in the number of AChR at the cell surface, mediated by Chol depletion.
CDx alters the distribution of AChRs in living CHO-K1/A5 cells
Fluorescence of CHO-K1/A5 cells stained with Alexa488-αBTX for 1 h at 4°C is restricted to the cell surface. No internalization of the fluorescent probe occurred at this temperature, thus allowing the labelling of AChR present exclusively at the cell surface. When living cells were treated with 15 mM CDx for 30 min at 37°C before labelling, (A, CDx), a marked diminution in intensity (e.g., 42.7±7.3% C, empty bars) was observed with respect to control cells incubated with saline M1 medium only (A, control), in full agreement with [125I] αBTX binding and whole cell recording experiments ().
Figure 2. CDx treatment decreases the number of fluorescent-labelled surface AChR and shifts their cellular distribution in living cells. (A) Cells incubated for 30 min at 37°C with buffer (control) or 15 mM CDx were labelled with Alexa488-αBTX for 1 h at 4°C. (B) Cells were labelled with Alexa488-αBTX for 1 h at 4°C and subsequently incubated for 30 min at 37°C with buffer (control) or 15 mM CDx. (C) Surface (empty bars) and total (surface + internalized, gray bars) fluorescence intensity in control and CDx-treated cells. Data represent the mean±SD of at least 3 independent experiments, expressed in arbitrary units. The asterisk denotes a statistical significance of p<0.001. This Figure is reproduced in colour in Molecular Membrane Biology online.
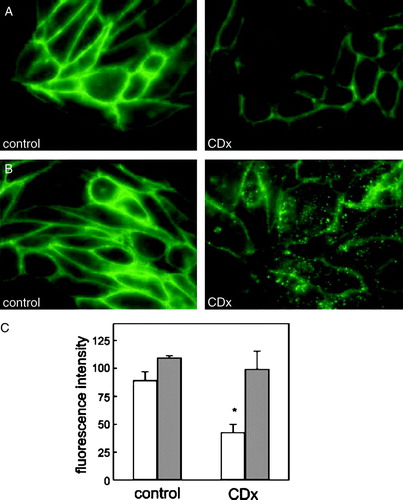
To explore the causes of the decrease in the number of cell-surface AChRs, we conducted another series of experiments in which cells were first labelled at 4°C and then exposed to CDx (15 mM) or M1 medium at 37°C for 30 min, respectively. In control cells labelling was almost exclusively restricted to the cell surface (B control), indicating that during the period of incubation at 37°C internalization of the AChR is not significant. In contrast, in CDx-treated cells a marked reduction in the fluorescence intensity at the cell surface (∼50%, as in or 2A) was observed together with the appearance of punctuate structures inside the cell, presumably endosomes (B CDx). No statistical differences were found in the total, (surface + internalized) Alexa488-αBTX fluorescence intensity measured over the entire treated and untreated cells (C, gray bars). These results indicate that Chol depletion shifts the distribution of AChR from the surface to intracellular compartments.
In order to determine the kinetics of this process we performed a double-labelling protocol: cells were first labelled at 4°C with Alexa594-αBTX (red) and shifted to 37°C in the presence of CDx or saline M1 medium, respectively, for increasing periods (0–30 min). To reveal those AChRs remaining at the cell surface, at the end of the incubation period cells were additionally labelled with mAb 210 (an antibody against an extracellular epitope of the α1 AChR subunit) at 4°C, and subsequently with Alexa488-labelled secondary antibody (green). In control cells the overlap between the two labels was evident, indicating that most of the AChR remained at the cell surface after the incubation period (A, yellow in the merged image). In cells treated with CDx, red punctuate structures inside the cells became apparent concomitantly with a reduction in the degree of colocalization of the probes. The location of these punctuate structures inside the cell was confirmed by confocal microscopy (B).
Figure 3. CDx treatment affects the rate of internalization of the AChR. (A) Cells were labelled with Alexa594-αBTX for 1 h at 4°C and then incubated for the indicated times at 37°C with M1 buffer (control) or 15 mM CDx, respectively. At the end of the incubation period cells were labelled with mab210 and Alexa488-labelled secondary antibody for 1 h at 4°C. (B) Confocal images of cells labelled with Alexa488-BTX and incubated for 30 min at 37°C with M1 buffer (control) or 15 mM CDx. (C) Decrease in t½ of surface AChR in cells treated with CDx relative to that in control cells. Inset: kinetics of AChR internalization in control (□) and CDx treated cells (•), expressed in minutes.
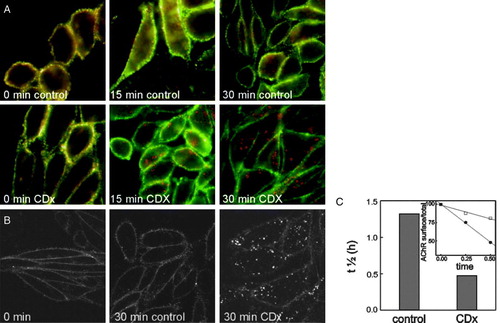
Since red staining corresponds to cell-surface AChR at the beginning of the experiment, and green corresponds to cell-surface AChR remaining at the end of the experiment, the rate of surface AChR internalization may be derived from the temporal evolution of the green/red ratio (C, inset). The t1/2 was found to decrease from ∼1.5 h in control cells to 0.5 h in CDx-treated cells (C), confirming the acceleration of the kinetics of endocytosis upon Chol depletion.
The Chol-dependent decrease in cell-surface AChR requires cellular integrity
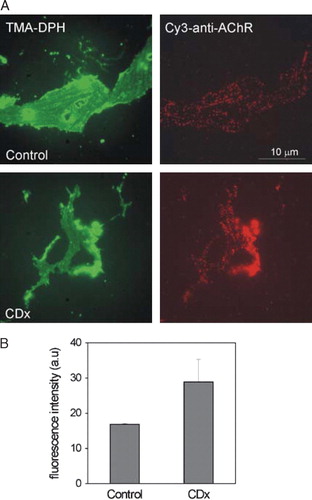
We next focused on the AChR in single plasma membrane sheets generated by short ultrasound pulses applied to intact CHO-K1/A5 cells grown on glass coverslips. This treatment disrupts the coverslip-distal part of the cell, leaving behind the glass-adhered basal plasma membrane sheet that is ideally suited for microscopic analysis, since the entire object can be imaged in the focal plane without out-of-focus interference. In a first series of experiments, analogous to those of B, living cells were labelled with Alexa594-αBTX, treated with CDx for 30 min at 37°C, and “unroofed” (see Methods). As shown in , the generated membrane sheets were flat, large, and essentially two-dimensional. The Alexa594-αBTX-labelled AChR appeared as distinct diffraction-limited spots all over the membrane surface (see also A). Membrane sheets obtained from Chol-depleted cells (A, CDx) exhibited a diminution of the total Alexa594-αBTX fluorescence intensity (B), in full agreement with the observations on intact cells () and corroborating that diminution of fluorescence labelling upon CDx treatment reflects a decrease in cell-surface membrane-associated receptors occurring prior to the generation of the sheets.
Figure 4. Cell integrity is a requisite for the CDx-mediated AChR internalization. Plasma membrane sheets were generated from CHO-K1/A5 cells, after CDx treatment (A-B, as in intact cells, cf. ) or, before CDx treatment (C–D). (A) Cells were imaged in the blue channel using TMA-DPH staining (left column, pseudo colored in green) and in the red channel to visualize Alexa594-αBTX fluorescence (right column, red) in control or CDx-treated cells, respectively. (B) Statistical analysis showing the decrease of Alexa594-αBTX fluorescence upon CDx treatment. Compare these results with those obtained using membrane sheets generated from CHO-K1/A5 cells before CDx treatment (C). (D) Total fluorescence intensity in control and CDx-treated membrane sheets. Data represent the mean±SD of at least 3 independent experiments. The asterisk denotes a statistical significance of p<0.001.
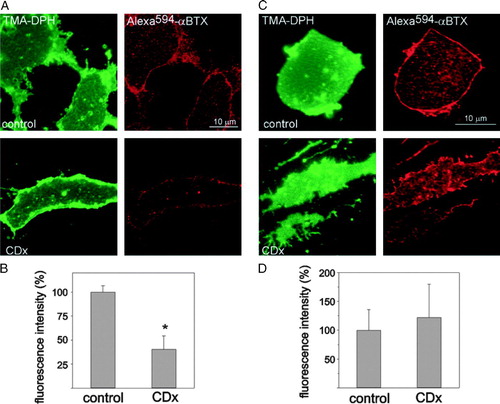
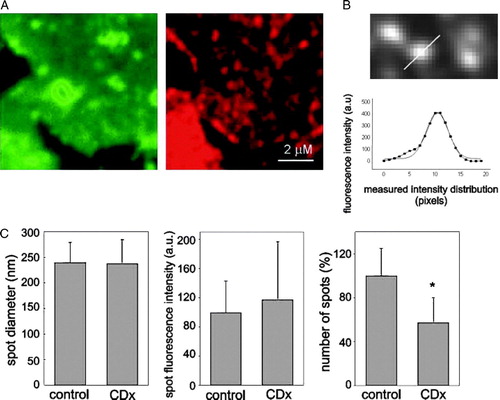
Figure 5. Plasma membrane sheets from “unroofed” cells enable visualization of diffraction-limited AChR spots. (A) TMA-DPH staining (left column, green) and Alexa594-αBTX fluorescence (right column, red) of isolated plasma membrane sheets (B) Magnified view (∼1/10) of a field illustrating the linear scan of an AChR particle (upper panel) and the corresponding intensity profile (lower panel) with a Gaussian fit. The full line corresponds to the theoretical Gaussian curve fitting the experimental data. (C) Comparison of average spot diameter, intensity, and number of spots between control and Chol-depleted samples. More than 120 individual particles were analysed for each condition; *Indicates p<0.001. This Figure is reproduced in colour in Molecular Membrane Biology online.
In contrast, when membrane sheets were generated first and Chol depletion undertaken on the isolated membrane sheet, labelled with Alexa594-αBTX and fixed, the fluorescence intensity of the Chol-depleted membrane sheets did not differ from that of control membranes (C–D), indicating that cell integrity is an absolute requirement for the Chol-dependent depletion of AChR.
The use of a probe other than αBTX enabled us to discard the possibility of αBTX binding being affected by Chol depletion. For this purpose membrane sheets were generated and treated with CDx as in C–D, fixed (to prevent antibody-induced crosslinking) and labelled with H-101, an antibody directed against cytoplasmic-facing epitopes of the AChR β subunit, followed by anti-rabbit Cy3-IgG. The results obtained with antibody-labelled AChR (Supplementary , online only) did not differ from those observed with Alexa594-αBTX (C–D), thus indicating that changes in αBTX-AChR binding are not involved in this phenomenon (see also ).
Supplementary Figure 1. Fluorescent-labelled domains can be visualized using antibodies against cytoplasmic-facing epitopes of the AChR. (A) Membrane sheets generated before CDx treatment (as in C–D) fixed and labelled with H-101, ?followed by anti-rabbit Cy3-IgG (right panel, red) and TMA-DPH (left panel, green) in control or CDx-treated cells. (B) Total fluorescence intensity in control and CDx treated membrane sheets. Data represent the mean±SD of at least 3 independent experiments. The results obtained with antibody-labelled AChR are similar to those observed with Alexa488-αBTX (C–D).
Fine structure of the cell-surface AChR domains
The lack of out-of-plane fluorescence in the membrane sheet preparations enabled the resolution of the surface fluorescence into diffraction-limited punctuate structures at high magnification. Thus the fluorescence signal arising from Alexa594-αBTX labelled AChR was concentrated in small, submicron-sized fluorescent puncta ( and A), which we interpret as AChR “domains” or submicron clusters. Spotty fluorescence was not observed in the same membrane sheet specimens stained for lipid with TMA-DPH when imaged in the blue channel (A; see also ).
Statistical analysis of the fluorescent-labelled AChR puncta in single sheets was carried out as indicated in . Individual spots were submitted to densitometric scans and their intensity profiles fitted with a Gaussian distribution (B). When analysed in more than 30 fields, the average spot diameter (full-width at half-maximum (FWHM) in the Gaussian fit; 239±40 nm, n=120 in control samples and 238±47, n=120 in Chol-depleted cells) and the fluorescence intensity of individual spots were not statistically different upon Chol depletion (C). However, the number of spots clearly decreased (∼40%) in membrane sheets obtained after Chol depletion (C).
Antibody-mediated AChR recruitment into domains is facilitated upon Chol depletion
We next studied whether the state of AChR aggregation was modified upon Chol depletion. For this purpose, membrane sheets were submitted to CDx treatment, incubated with mAb-210 and Alexa488 –labelled secondary antibody, and fixed (A). The average intensity of individual puncta in Chol depleted sheets was found to increase by ∼50% with respect to the spots in control membrane sheets (B). No statistical differences were observed in the size of the fluorescent labelled puncta between control and CDx-treated sheets (283±82 nm and 252±54 nm, respectively, n=200) (B, inset). The higher fluorescence intensity of the puncta can be tentatively accounted for by the antibody-mediated recruitment of AChRs into the diffraction-limited puncta.
Figure 6. Recruitment of AChRs into domains upon Chol depletion. (A) Plasma membrane sheets generated from CHO-K1/A5 cells before CDx treatment (as in C–D) were visualized either by TMA-DPH (left panel, blue) or by Alexa488-labelled antibody/mAb 210 antibody (right panel, green) in control and CDx-treated cells. (B) Average fluorescence intensity of individual puncta in control and CDx-treated membrane sheets, respectively. Inset: Lack of changes in the diameter of the fluorescent antibody labelled AChR puncta. More than 200 individual particles were analysed for each condition. (C) The so-called general polarization (GP) of the fluorescent probe Laurdan was measured in purified plasma membranes from CHO-K1/A5 cells upon CDx- or Chol-CDx-mediated Chol depletion/replenishment, respectively. GP was measured under conditions both of direct excitation of Laurdan (empty bars) and FRET (grey bars) using the intrinsic protein fluorescence as donor. CDx or Chol-CDx reduced and increased GP, respectively. Data represent the mean±SD of at least 3 independent experiments. Bars labelled with * and # indicate statistically significant differences (p<0.001) with respect to control values. This Figure is reproduced in colour in Molecular Membrane Biology online.
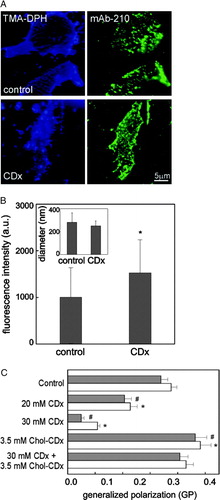
We surmised that the antibody-mediated recruitment of the AChRs in Chol depleted membranes could reflect changes in membrane fluidity that in turn affected the lateral mobility of the AChR. In order to test this hypothesis we analysed changes in membrane fluidity by means of the so-called generalized polarization (GP) of the fluorescent probe Laurdan in purified plasma membrane fractions. GP reports directly on membrane polarity and indirectly on membrane fluidity (Parasassi et al. [Citation1990]). Upon treatment with CDx, GP values significantly decreased in the membrane fractions (C), indicating a marked increase in membrane polarity (i.e., increase in membrane fluidity). This applies to GP measured under conditions both of direct excitation of Laurdan and of Förster-type resonance energy transfer (FRET) using the intrinsic protein fluorescence as donor. The latter requires distances between donor and acceptor (Laurdan) in the order of 10–100 Å, thus informing on the physical state of the AChR vicinal microenvironment. A maximal effect (∼50–70%) was obtained at 30 mM CDx (C). Incubation with 3.5 mM Chol-CDx for 20 min increased Laurdan GP values with respect to those of controls (∼30%, C), whereas no significant changes were observed upon co-incubation with CDx and Chol-CDx.
The changes revealed using Laurdan GP exhibited the same tendency as those followed by fluorescence polarization or anisotropy of TMA-DPH, an extrinsic fluorescent probe that is virtually non-fluorescent in aqueous media but whose quantum yield increases strongly when partitioned in membranes. Fluorescence polarization of TMA-DPH of control and 15 mM CDx-treated membranes from CHO-K1/A5 cells showed values of 0.325±0.001 and 0.298±0.004, respectively, whereas fluorescence anisotropy values were 0.242±0.001 and 0.221±0.004, respectively. Thus all the experimental parameters measured indicate that Chol depletion or enrichment is accompanied by changes in the physical state of the plasma membrane, consisting of an increase in its fluidity upon Chol depletion and the opposite upon Chol enrichment. The increase in fluidity may favor the antibody-mediated aggregation of AChRs into larger clusters, but these are still diffraction-limited and thus beyond the resolution of conventional wide-field light microscopy.
Changes in AChR single-channel behavior upon Chol modification
In order to investigate whether Chol modification affected AChR function, single-channel recordings were carried out. A shows raw traces obtained in the cell-attached configuration after treatment of living CHO-K1/A5 with 10 mM CDx or 10 mM Chol-CDx, respectively. The AChR channel amplitude did not change upon Chol modification in either case. At low time resolution, optimized for visualization of bursts (A, left panel), no alterations in burst duration were apparent in either Chol-depleted or Chol-enriched cells. At higher sampling rates (A, right panel) individual bursts were resolved into single opening and closing events, and differences were observed in AChR channel mean open time (τopen). As shown in B, Chol depletion increased the duration of τopen by ∼30% (p<0.001) already after 15 min, with no significant variation in τburst. In contrast, Chol enrichment of living cells resulted in a ∼33% (p<0.001) diminution of τopen upon 15 min treatment (). Furthermore, the probability of channel opening (popen) increased in Chol depleted cells and decreased upon Chol enrichment (B and ). We further calculated the burst duration within each cluster individually, calculated using the QuB analysis, and compared these data with single-channel data obtained by analysis with the program Tac. We did not find any difference in burst duration between control, CDx or Chol-CDx-treated samples (data not shown). If burst duration remains constant, and popen within a cluster changes, the distribution of closed durations can be expected to change in opposite direction. This was in fact the case. C shows the linear relationship between normalized AChR channel mean open time (τopen) and membrane Chol content, covering both the Chol-depletion and -enrichment conditions.
Figure 7. Modification of AChR single-channel behavior by Chol depletion/enrichment. (A) Raw traces of single-channel patch-clamp recordings from cells incubated in Ham F-12 medium without FBS (trace a, control), 10 mM CDx for 15 or 30 min (traces b and c) or 10 mM Chol-CDx for 15 or 30 min (traces d and e), respectively. Left panel: bursts of single channel activity; right panel: single-channel activity. (B) Open time histograms (left column) obtained in control cells and in cells treated with 10 mM CDx or Chol-CDx, respectively. The right column shows the corresponding histograms of open probability for each condition. (C) Relationship between normalized AChR channel mean open time (τopen) and membrane Chol content. τopen values were normalized with respect to their respective controls. The SD of the ratio was calculated as the SD of X1/X2=(X1/X2) * [(SD1/X1)2+(SD2/X2)2]1/2. r = 0.973. Symbols correspond to control, 15 min (▪) or 30 min (□); 10 mM CDx, 15 min (▾) or 30 min (▿); 10 mM Chol-CDx, 15 min (▴) or 30 min (▵), respectively.
![Figure 7. Modification of AChR single-channel behavior by Chol depletion/enrichment. (A) Raw traces of single-channel patch-clamp recordings from cells incubated in Ham F-12 medium without FBS (trace a, control), 10 mM CDx for 15 or 30 min (traces b and c) or 10 mM Chol-CDx for 15 or 30 min (traces d and e), respectively. Left panel: bursts of single channel activity; right panel: single-channel activity. (B) Open time histograms (left column) obtained in control cells and in cells treated with 10 mM CDx or Chol-CDx, respectively. The right column shows the corresponding histograms of open probability for each condition. (C) Relationship between normalized AChR channel mean open time (τopen) and membrane Chol content. τopen values were normalized with respect to their respective controls. The SD of the ratio was calculated as the SD of X1/X2=(X1/X2) * [(SD1/X1)2+(SD2/X2)2]1/2. r = 0.973. Symbols correspond to control, 15 min (▪) or 30 min (□); 10 mM CDx, 15 min (▾) or 30 min (▿); 10 mM Chol-CDx, 15 min (▴) or 30 min (▵), respectively.](/cms/asset/a874493a-3a9f-4e14-b290-7d4fa1225763/imbc_a_190258_f0008_b.gif)
Table I. Mean open time (τopen), mean burst time (τburst) and intraburst open probability (popen) of AChRs expressed in CHO-K1/A5 cells upon Chol depletion or enrichment*.
Discussion
The ability of the AChR to translocate cations and undergo conformational transitions between resting, active and desensitized states is remarkably sensitive to lipid composition (Barrantes [Citation2004]). The mechanism through which Chol intervenes in these processes has not been satisfactorily explained. Membrane fluidity changes have been suggested to account for the modifications produced by Chol (Sunshine & McNamee [Citation1994], Baenziger et al. [Citation2000]) whereas other authors postulate that Chol behaves as an allosteric AChR modulator (Barrantes [Citation2004]).
The plasma membrane is estimated to contain half of the total cellular Chol in CHO cells (Warnock et al. [Citation1993]). Here, acute exposure to CDx sufficed to mediate Chol depletion and induce a marked decrease in the amount of AChR protein present at the cell-surface of CHO-K1/A5 cells, as assessed by ligand binding (A), whole-cell currents (C), and fluorescence microscopy of intact cells ( and ) or membrane sheets ( and ).
CDx-mediated Chol depletion has been used as a diagnostic tool of endocytic mechanisms (reviewed by Pichler & Riezman [Citation2004]). CDx-mediated Chol depletion leads to inhibition of clathrin and caveolar endocytic pathways, disruption of endosomal traffic (Le et al. [Citation2002]), perturbation of the actin network (Kwik et al. [Citation2003]), and partial inhibition of cholera toxin B uptake without affecting Tf uptake (Kirkham et al. [Citation2005]). Thus, the “universal” effect of Chol depletion is to severely hinder most endocytic processes, slowing them down or completely halting them altogether. To our knowledge, the CDx-induced accelerated internalization of a transmembrane protein, as observed here with the AChR, has not been reported to date. The specificity of the effect of Chol depletion upon AChR internalization is supported by the fact that other cell-surface proteins in CHO-K1 cells, like the TfR (present results) and the GPI-linked I-Ek (Vrljic et al. [Citation2005]) exhibit a different behavior.
Recently Zhu et al. ([Citation2006]) reported that Chol depletion by CDx (0–2 mM) did not affect AChR expression in C2C12 differentiated myoblasts subjected to agrin stimulation. Neural agrin produces a dramatic increase (30-fold) in the aggregation of AChR into micron-sized clusters displaying a longer receptor lifetime (Phillips et al. [Citation1997]). The higher stability of agrin-induced AChR clusters is likely related to their Chol sensitivity, which may differ from that of the submicron-sized, agrin-less, rapsyn-less AChR clusters reported here. Furthermore, the CDx concentrations used by Zhu et al. ([Citation2006]) may not suffice to achieve some critically low Chol level required for triggering AChR endocytosis in C2C12 cells. AChR endocytosis in response to CDx treatment appears to be a dose-dependent phenomenon (see ).
Proteins can be uniformly distributed at the plasmalemma or segregated into microclusters below the resolution of the light microscope (Jacobson & Dietrich [Citation1999]). Similarly, the so-called lipid “raft” hypothesis postulates that sphingolipids and Chol are distributed non-homogeneously in the membrane bilayer, occurring in laterally segregated microdomains (Edidin [Citation1997], Brown & London [Citation2000]). Raft microdomains have been postulated to concentrate signaling molecules and receptors in particular regions of the cell surface (Maxfield [Citation2002]). The gross cellular co-localization of some of the lipid components enriched in raft micro-domains, such as glycosphingolipids, and the AChR at the innervated ventral face of the electrocyte has been documented (Marcheselli et al. [Citation1993]). The homomeric neuronal α7 AChR was shown to be associated with Chol-rich lipid microdomains within somatic spines in chick ciliary ganglion sympathetic neurons (Bruses et al. [Citation2001]), as is embryonic muscle AChR overexpressed in COS-7 cells (Marchand et al. [Citation2002]). In agreement with the results of (Bruses et al. [Citation2001]) on neuronal AChR, about half of the AChR domains observed in the present work are sensitive to Chol depletion, but exhibit some differences with the endogenous neuronal α7 AChR. The difference points to and can be accounted for by the presence of receptor-anchoring machinery (neuronal agrin, MusK, rapsyn, etc.) in those cellular systems endogenously expressing AChR.
Here, we show that in plasma membrane sheets the fluorescence signal of αBTX or antibody-labelled AChR is concentrated in small, well-resolved submicron-sized fluorescent spots ( and ). These spots most likely correspond to AChR domains, much smaller than the clusters observed at the surface of developing muscle cells or in the adult neuromuscular junction (Sanes & Lichtman [Citation2001]). During embryonic development, and prior to innervation, AChR molecules are diffusely distributed over the surface of myotubes; at embryonic stage E14, receptors begin to form scattered micro-clusters. A few hours after motor neuron contact, micro-clusters condense into larger, compact macro-clusters localized directly beneath the motor endplate. It is reasonable to assume that AChR aggregation does not progress beyond this stage in CHO cells, since they lack protein molecules of the AChR clustering machinery. CHO-K1/A5 cells thus constitute a useful model system to study the aneural, pre-innervation stages of AChR cluster formation in the absence of non-receptor proteins and nerve-released clustering factors.
The clearer visualization afforded by the in-plane focusing of the single sheets with wide-field fluorescence microscopy revealed that there were no statistically significant changes in the size or intensity of the remaining spots upon CDx treatment (). This suggests that in living cells the average number of αBTX-AChR complexes in the sub-diffraction Chol-dependent domains is relatively constant. In contrast, when the AChR was reacted with a monoclonal antibody (mab210), the average intensity of individual puncta increased by ∼50% (B). This is probably caused by the antibody-mediated recruitment of AChRs into the diffraction-limited puncta owing, in turn, to the augmented membrane fluidity upon Chol depletion. We have shown that the physical state of the Torpedo AChR vicinal lipid (Antollini et al. [Citation1996]) and more relevantly in CHO-K1/A5 cells (Zanello et al. [Citation1996]) is in the liquid-ordered (Lo) state. Here, we show that Chol can modulate the physical state of the bulk bilayer and the AChR-vicinal lipid belt region (C). Can these observations be rationalized in terms of the lipid “raft” hypothesis? Lo domain stability or lifetime is a function of size and protein-protein interactions of constituent proteins (Hancock [Citation2006]). This is an active, energy-dependent process that limits raft domain size. Recent views of lipid domain dynamics suggest that Lo domains form spontaneously, diffuse laterally in the plasma membrane, but have a limited lifetime. Larger, more stable Lo-protein complexes can be captured by endocytic pathways that disassemble the complexes and return lipid and protein constituents back to the plasma membrane (Turner et al. [Citation2005]). A similar fate may be followed by Chol-rich Lo-AChR nanometer-sized complexes upon destabilization by Chol depletion, as reported here. Chol depletion shifts the distribution of AChR from the surface to intracellular compartments by accelerating an endocytic process which does not normally operate in CHO-K1/A5 cells within the time window of the experiment. The number of clusters depends on Chol levels, whereas the number of receptors within these clusters appears to be independent of Chol levels.
We were able to resolve the functional consequences of Chol modification in living mammalian cells at the whole-cell and single-channel levels. Chol depletion increased the duration of the channel mean open time of those AChRs remaining at the cell surface by ∼30%, whereas Chol enrichment resulted in up to 30% diminution in τopen ( and ). Our single-channel studies further indicate that the AChR open channel duration depends linearly on Chol content (C). Furthermore, since τopen and popen increased () whereas τclosed decreased (data not shown), with τburst remaining unchanged, it is possible to speculate that variations in membrane Chol content affect opening and closing channel kinetics in the opposite manner. Taken together, the macroscopic and microscopic data of AChR currents indicate that membrane Chol content modulates AChR behavior, exerting a fine regulation of channel kinetics. Since as reported in this work Chol depletion accelerates internalization and thus reduces the amount of AChR at the cell surface, the changes in channel kinetics (increased open dwell time) may represent a compensatory mechanism to maintain AChR function until new receptors are synthesized. Expression of Torpedo AChR in Xenopus oocytes does not appear to be affected by Chol depletion (Santiago et al. [Citation2001]), probably because it does not affect AChR internalization. We observe a clear (∼50%) reduction of whole-cell currents upon Chol depletion that correlates linearly with the reduced number (∼50%) of AChRs and this, in turn, is explained by the dramatic increase in the rate of internalization of the AChR. We are currently characterizing the AChR endocytic pathway operating in CHO-K1/A5 cells; it appears to be a novel pathway, independent of those mediated by clathrin, the GEEC pathway, and caveolar endocytosis (in preparation). Endocytic mechanisms operating in mammalian fibroblasts and amphibian oocytes, respectively, and their cholesterol sensitivity, may thus differ considerably.
In conclusion, our results show that membrane Chol content in CHO-K1/A5 cells can be man-tailored to modify plasma membrane physical state by the use of cyclodextrins. Chol depletion was accompanied by a decrease in cell-surface AChRs in living cells. The high dependence of AChR function on membrane Chol raises the possibility that Chol depletion leads to AChR conformational changes that alter its stability at the cell membrane, accelerate its endocytosis, and affect the channel kinetics of those receptors remaining at the surface. Homeostatic control of Chol content at the plasmalemma may thus modulate cell-surface organization and stability of receptor domains and fine tune ion permeation through receptor channels.
This paper was first published online on prEview on 29 September 2006.
Thanks are due to Ms Beatriz de los Santos for cell culture and help in the preparation of samples for microscopy and binding assays, and to Ms Victoria Picardi for help in the particle statistical analysis. This work was supported in part by grants from FONCYT and UNS, Argentina, and FIRCA 1-RO3-TW01225-01 (NIH) to M.M.W. and F.J.B.
References
- Antollini SS, Soto MA, Bonini de Romanelli I, Gutierrez-Merino C, Sotomayor P, Barrantes FJ. Physical state of bulk and protein-associated lipid in nicotinic acetylcholine receptor-rich membrane studied by laurdan generalized polarization and fluorescence energy transfer. Biophys J 1996; 70: 1275–1284
- Baenziger JE, Morris ML, Darsaut TE, Ryan SE. Effect of membrane lipid composition on the conformational equilibria of the nicotinic acetylcholine receptor. J Biol Chem 2000; 275: 777–784
- Barrantes FJ. Structural basis for lipid modulation of nicotinic acetylcholine receptor function. Brain Res Brain Res Rev 2004; 47: 71–95
- Barrantes FJ, Antollini SS, Blanton MP, Prieto M. Topography of nicotinic acetylcholine receptor membrane-embedded domains. J Biol Chem 2000; 275: 37333–37339
- Blanton MP, Xie Y, Dangott LJ, Cohen JB. The steroid promegestone is a noncompetitive antagonist of the Torpedo nicotinic acetylcholine receptor that interacts with the lipid-protein interface. Mol Pharmacol 1999; 55: 269–278
- Bligh EG, Dyer WJ. A rapid method of total lipid extraction and purification. Can J Biochem Physiol 1959; 37: 911–917
- Brown DA, London E. Structure and function of sphingolipid- and cholesterol-rich membrane rafts. J Biol Chem 2000; 275: 17221–17224
- Bruses J, Chauvet N, Rutishauser U. Membrane lipid rafts are necessary for the maintenance of the (alpha)7 nicotinic acetylcholine receptor in somatic spines of ciliary neurons. J Neurosci 2001; 21: 504–512
- Corbin J, Wang HH, Blanton MP. Identifying the cholesterol binding domain in the nicotinic acetylcholine receptor with [125I]azido-cholesterol. Biochim Biophys Acta 1998; 1414: 65–74
- Edidin M. Lipid microdomains in cell surface membranes. Curr Opin Struct Biol 1997; 7: 528–532
- Fukasawa M, Nishijima M, Itabe H, Takano T, Hanada K. Reduction of sphingomyelin level without accumulation of ceramide in Chinese hamster ovary cells affects detergent-resistant membrane domains and enhances cellular cholesterol efflux to methyl-beta-cyclodextrin. J Biol Chem 2000; 275: 34028–34034
- Gimpl G, Klein U, Reiländer H, Fahrenholz F. Expression of the human oxytocin receptor in baculovirus-infected insect cells: high-affinity binding is induced by a cholesterol-cyclodextrin complex. Biochemistry 1996; 34: 13794–13801
- Hancock, JF. 2006. Lipid rafts: contentious only from simplistic standpoints. Nature Rev Molec Cell Biol, 7:456–462.
- Jacobson K, Dietrich C. Looking at lipid rafts?. Trends Cell Biol 1999; 9(3)87–91
- Jones OT, McNamee MG. Annular and nonannular binding sites for cholesterol associated with the nicotinic aceytlcholine receptor. Biochemistry 1988; 27: 2364–2374
- Kirkham M, Fujita A, Chadda R, Nixon SJ, Kurzchalia TV, Sharma DK, Pagano RE, Hancock JF, Mayor S, Parton RG. Ultrastructural identification of uncoated caveolin-independent early endocytic vehicles. J Cell Biol 2005; 168: 465–476
- Kwik J, Boyle S, Fooksman D, Margolis L, Sheetz MP, Edidin M. Membrane cholesterol, lateral mobility, and the phosphatidylinositol 4,5-bisphosphate-dependent organization of cell actin. Proc Natl Acad Sci USA 2003; 100: 13964–13969
- Le PU, Guay G, Altschuler Y, Nabi IR. Caveolin-1 is a negative regulator of caveolae-mediated endocytosis to the endoplasmic reticulum. J Biol Chem 2002; 277: 3371–3379
- Marchand S, Devillers-Thiery A, Pons S, Changeux JP, Cartaud J. Rapsyn escorts the nicotinic acetylcholine receptor along the exocytic pathway via association with lipid rafts. J Neurosci 2002; 22: 8891–8901
- Marcheselli V, Daniotti JL, Vidal AC, Maccioni H, Marsh D, Barrantes FJ. Gangliosides in acetylcholine receptor-rich membranes from Torpedo marmorata and Discopyge tschudii. Neurochem Res 1993; 18: 599–603
- Maxfield FR. Plasma membrane microdomains. Curr Opin Cell Biol 2002; 14: 483–487
- Parasassi T, De Stasio G, d'Ubaldo A, Gratton E. Phase fluctuation in phospholipid membranes revealed by Laurdan fluorescence. Biophys J 1990; 57: 1179–1186
- Phillips DW, Vladeta D, Han H, Noakes PG. Rapsyn and agrin slow the metabolic degradation of the acetylcholine receptor. Mol Cel Neurosci 1997; 10: 16–26
- Pichler H, Riezman H. Where sterols are required for endocytosis. Biochim Biophys Acta 2004; 1666: 51–61
- Roccamo AM, Pediconi MF, Aztiria E, Zanello L, Wolstenholme A, Barrantes FJ. Cells defective in sphingolipids biosynthesis express low amounts of muscle nicotinic acetylcholine receptor. Eur J Neurosci 1999; 11: 1615–1623
- Sanes JR, Lichtman JW. Induction, assembly, maturation and maintenance of a postsynaptic apparatus. Nat Rev Neurosci 2001; 2: 791–805
- Santiago J, Guzman GR, Rojas LV, Marti R, Asmar-Rovira GA, Santana LF, McNamee MG, Lasalde-Dominicci JA. Probing the effects of membrane cholesterol in the Torpedo californica acetylcholine receptor and the novel lipid-exposed mutation (C418W in Xenopus oocytes). J Biol Chem 2001; 276: 46523–46532
- Sieber JJ, Willig KI, Heintzmann R, Hell SW, Lang T. The SNARE motif is essential for the formation of syntaxin clusters in the plasma membrane. Biophys J 2006; 90: 2843–2851
- Subtil A, Gaidarov I, Kobylarz K, Lampson MA, Keen JH, McGraw TE. Acute cholesterol depletion inhibits clathrin-coated pit budding. Proc Natl Acad Sci USA 1999; 96: 6775–6780
- Sunshine C, McNamee MG. Lipid modulation of nicotinic acetylcholine receptor function: The role of membrane lipid composition and fluidity. Biochim Biophys Acta 1994; 1191: 59–64
- Turner MS, Sens P, Socci ND. Nonequilibrium raft-like domains under continuous recycling. Phys Rev Lett 2005; 95: 168301
- Vrljic M, Nishimura SY, Moerner WE, McConnell HM. Cholesterol depletion suppresses the translational diffusion of class II major histocompatibility complex proteins in the plasma membrane. Biophys J 2005; 88: 334–347
- Warnock DE, Roberts C, Lutz MS, Blackburn WA, Young WW, Jr, Baenziger JU. Determination of plasma membrane lipid mass and composition in cultured Chinese hamster ovary cells using high gradient magnetic affinity chromatography. J Biol Chem 1993; 268: 10145–10153
- Zanello LP, Aztiria E, Antollini S, Barrantes FJ. Nicotinic acetylcholine receptor channels are influenced by the physical state of their membrane environment. Biophys J 1996; 70: 2155–2164
- Zhu D, Xiong WC, Mei L. Lipid rafts serve as a signaling platform for nicotinic acetylcholine receptor clustering. J Neurosci 2006; 26: 4841–4851