Abstract
Nucleosides are accumulated by cells via a family of equilibrative transport proteins (ENTs). An alternative splice variant of the most common subtype of mouse ENT (ENT1) has been identified which is missing a protein kinase CK2 (casein kinase 2) consensus site (Ser254) in the central intracellular loop of the protein. We hypothesized that this variant (mENT1a) would be less susceptible to modulation by CK2-mediated phosphorylation compared to the variant containing the serine at position 254 (mENT1b). Each splice variant was transfected into nucleoside transporter deficient PK15 cells, and stable transfectants assessed for their ability to bind the ENT1-selective probe [3H]nitrobenzylthioinosine (NBMPR) and to mediate the cellular uptake of [3H]2-chloroadenosine, with or without treatment with the CK2 selective inhibitor, 4,5,6,7-tetrabromobenzotriazole (TBB). mENT1a had a higher affinity for NBMPR relative to mENT1b – measured both directly by the binding of [3H]NBMPR, and indirectly via inhibition of [3H]2-chloroadenosine influx by NBMPR. Furthermore, incubation of mENT1b-expressing cells with 10 µM TBB for 48 h decreased both the KD and Bmax of [3H]NBMPR binding, as well as the Vmax of 2-chloroadenosine uptake, whereas similar treatment of mENT1a-expressing cells with TBB had no effect. PK15 cells transfected with hENT1, which has Ser254, was similar to mENT1b in its response to TBB. In conclusion, inhibition of CK2 activity, or deletion of Ser254 from mENT1, enhances transporter affinity for the inhibitor, NBMPR, and reduces the number of ENT1 proteins functioning at the level of the plasma membrane.
| Abbreviations | ||
| bovine growth serum | = | BGS |
| protein kinase CK2, casein kinase II | = | CK2 |
| dimethylsulfoxide | = | DMSO |
| equilibrative nucleoside transporter | = | ENT |
| nitrobenzymercaptopurine riboside, nitrobenzylthioinosine | = | NBMPR |
| nitrobenzylthioguanosine | = | NBTGR |
| nucleoside transport deficient pig kidney epithelial cells | = | PK15-NTD |
| 4,5,6,7-tetrabromobenzotriazole | = | TBB |
| transmembrane | = | TM |
Introduction
Nucleosides cross cell membranes via two distinct families of transport proteins (Kong et al. [Citation2004]). The concentrative nucleoside transporters (SLC28A1-3; CNTs) function in concert with an inwardly directed Na+ gradient to carry nucleosides into cells against a nucleoside concentration gradient (Ritzel et al. [Citation2001]). The equilibrative nucleoside transporters (SLC29A1-4; ENTs) mediate the Na+ independent flux of nucleosides down their concentration gradient (Baldwin et al. [Citation2004]). SLC29A1 (ENT1) is the most prevalent subtype of nucleoside transporter in most mammalian cells, including those from mouse tissues (Kong et al. [Citation2004]). This transporter is critical in regulating the extracellular levels of the bioactive nucleoside adenosine. Inhibition of ENT1 function has been shown to potentiate both the neuroprotective and cardioprotective actions of adenosine (Van Belle [Citation1993], Dunwiddie & Masino [Citation2001], Baldwin et al. [Citation2004]). In addition to adenosine, ENT1 transports a wide variety of other natural and synthetic purine and pyrimidine nucleosides, including a number of cytotoxic nucleoside analogues used to treat cancer and viral infections (Cass [Citation1995], Damaraju et al. [Citation2003]).
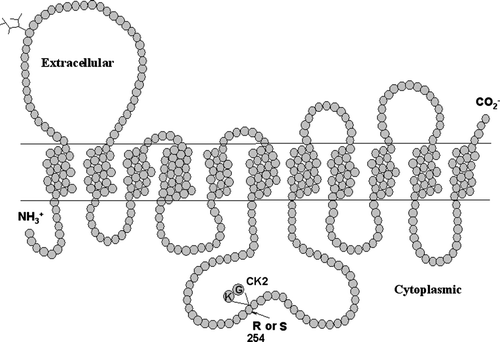
During the course of cloning and characterization of mouse ENT1, we and others noted that two splice variants of mENT1 exist, arising from alternative splice sites at the end of exon 7 (Choi et al. [Citation2000]). The larger of the two variants, mENT1b (Kiss et al. [Citation2000]) or mENT1.1 (Handa et al. [Citation2001]) (GenBank accession nos. AF305501 and AF257188, respectively), encodes a protein of 460 amino acids which is predicted to have 11 transmembrane (TM) domains with a large extracellular loop between TM domains 1 and 2, and a large intracellular loop between TM domains 6 and 7 (). The other splice variant, mENT1a (Kiss et al. [Citation2000]) or mENT1.2 (Handa et al. [Citation2001]) (GenBank accession nos. AF131212 and AF257189, respectively), is missing two amino acids (Lys255, Gly256) in the central intracellular loop and has an arginine in place of a serine at position 254 (). The splice variants of mENT1 were identified simultaneously by our laboratory and by Handa and colleagues (Handa et al. [Citation2001]) and were named using different conventions (as detailed above). For the purposes of this report we will use the mENT1a/b nomenclature. The Ser254 in mENT1b is part of a strong consensus sequence for phosphorylation by protein kinase CK2 (Pinna [Citation2002]). The lack of this serine in mENT1a suggests that the two splice variants may be differentially regulated by protein kinase CK2.
Figure 1. A schematic of the putative transmembrane structure of mENT1. The difference between the mENT1a and mENT1b splice variants is indicated in the central intracellular loop connecting transmembrane regions 6 and 7. The mENT1b variant has a serine at position 254 followed by a lysine-glycine. The mENT1a variant has an arginine at position 254 and the lysine/glycine is deleted.
Relatively little is known about the regulation of ENT1. Manipulation of PKC, PKA and CK2 activities have each been shown to modify ENT1 plasma membrane expression and cellular nucleoside transport capacity in a variety of cell lines (Coe et al. [Citation1996], [Citation2002], Kong et al. [Citation2004], Stolk et al. [Citation2005]). However, it has not been established if these changes are due to direct ENT phosphorylation or mediated via secondary protein interactions. Direct phosphorylation studies on this protein have proven to be problematic due to the labile nature of the ENT1 protein, and the lack of antibodies suitable for immunoprecipitation procedures. The existence of these mENT1 splice variants that differ in the presence or absence of a potential CK2 phosphorylation site provides a model to assess the role of Ser254 in CK2 mediated regulation of transporter function.
In this study, we have created stable cell lines expressing either mENT1a or mENT1b, and assessed ENT1-mediated [3H]2-chloroadenosine uptake and inhibitor sensitivity in the presence and absence of the selective CK2 inhibitor 4,5,6,7-tetrabromo-2-azabenzimidazole (TBB) (Sarno et al. [Citation2001]). The results obtained suggest that Ser254 is indeed phosphorylated by CK2 and that phosphorylation at this site leads to changes in sensitivity to the ENT1-selective inhibitor nitrobenzylthioinosine (NBMPR), and modifies the number of transporters functioning at the level of the cell plasma membrane.
Materials and methods
Materials
PK15-NTD (Nucleoside Transport Deficient) and PK15-hENT1 cells were provided by Dr Ming Tse (Johns Hopkins University, USA). [G-3H]NBMPR (5.5 Ci/mmol) and [8-3H]2-chloroadenosine (9.1 Ci/mmole) were purchased from Moravek Biochemicals (Brea, CA, USA), while [3H]water (1 mCi/g) was from DuPont Canada Inc (Markham, Ontario, Canada). Minimum Essential Medium (MEM; with Earles salts and L-glutamine), bovine growth serum (BGS), and culture grade Dulbeccos phosphate buffered saline were purchased from GIBCO/BRL (Burlington, Ontario, Canada). LipofectAMINE 2000 and G418 were obtained from Invitrogen (Burlington, Ontario, Canada). Penicillin G and streptomycin sulphate were purchased from ICN (Montreal, Quebec, Canada). Non-radiolabelled 2-chloroadenosine and NBMPR, nitrobenzylthioguanosine (NBTGR), trypsin-EDTA and dipyridamole (2,6-bis(diethanolamino)-4,8-dipiperidinopyrimido-[5,4-d]pyrimidine) were supplied by SIGMA (St Louis, MO, USA). TBB was from VWR Canlab (Mississauga, Canada). Dilazep ((N,N′-bis[3-(3,4,5-trimethoxybenzoyloxy) propyl] -homopiperazine) was provided by Asta Werke (Frankfurt, Germany). Draflazine (2-(aminocarbonyl) -4-amino-2,6-dichlorophenyl) -4-[5,5-bis(4-fluorophenyl)-pentyl]-1- piperazineacetamide 2HCl) was obtained from Janssen Research Foundation (Beerse, Belgium). All compounds used were of reagent grade.
Tissue distribution of mRNA for mENT1a and mENT1b
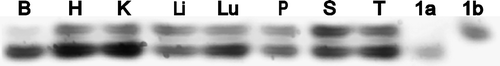
Polyadenylated RNA (mRNA) was isolated directly from a range of tissues from Swiss mice, using the FastTrack 2.0 mRNA Isolation Kit (Invitrogen, Burlington, ON, USA). First strand cDNA synthesis was performed on 1 µg of mRNA template using the BRL SuperScript PreAmplification System (Life Technologies, Burlington, ON, USA) with an oligo(dT)12-18 primer. PCR studies were conducted using AmpliTaq Gold hot start polymerase in a Thermocycler PE 480 (Perkin Elmer, Norwalk, CT, USA) using an oil overlaid 50 µl reaction mixture in thin-walled 500 µl tubes. The PCR conditions were: initial activation for 5 min at 95°C, followed by 35 cycles of 30 sec at 95°C, 30 sec at 48°C and 30 sec at 72°C, and a final 10 min elongation at 72°C (sense primer- 5′-CAGGAGACCAAGTTGGATCT-3; antisense primer 5′-TCTTCTTCCTTTTGGCTCCTC-3′). PCR products were resolved by electrophoresis on a 5% polyacrylamide gel and visualized with 0.5 µg/ml ethidium bromide on an Alpha Innotech Imaging system. The pcDNA3.1-mENT1a and pcDNA3.1-mENT1b plasmid constructs were used as controls. Both transcripts were identified in all tissues with PCR products of the expected sizes of 48 bp (mENT1a) and 54 bp (mENT1b).
Cell culture
Cells were cultured in T-175 flasks in MEM plus 10% BGS supplemented with penicillin G (100 units/ml), streptomycin sulphate (100 µg/ml), non-essential amino acids (0.1 mM) and sodium pyruvate (1 mM), maintained in a humidified atmosphere of 5% CO2 at 37°C. G418 (300 µg/ml) was included for the PK15-ENT1 stable transfectants to maintain selection pressure. Cells were typically split 1:3 and medium was replaced every three days. For radioligand binding and/or substrate flux assays, cells were removed from the flasks by trypsinization (0.05%, 10 min, 37°C), then diluted 4-fold with medium (+ 10% BGS) and collected by centrifugation. The cell pellets were washed once by resuspension/centrifugation in a Na+ free buffer (NMG buffer; 140 mM N-methyl-D-glucamine (NMG), 10 mM HEPES, 5 mM KCl, 4.2 mM KHCO3, 0.44 mM KH2PO4, 0.36 mM K2HPO4, 1.3 mM CaCl2·2H2O, 0.5 mM MgCl2·6H2O; pH 7.4) then resuspended in the same buffer for use in the assays. Cell concentrations were determined using a haemocytometer.
Stable transfection of PK15-NTD cells
pcDNA3.1 constructs containing the coding regions of ENT1a or ENT1b were prepared using standard procedures as described previously (Hammond et al. [Citation2004]). The constructs (or empty vector) were transfected into the PK15-NTD cell line using LipofectAMINE 2000 based on protocols supplied by the manufacturer (Invitrogen, Burlington, ON, USA). Briefly, plasmid DNA (5 µg per well for a 6-well plate) was linearized with PvuI and diluted to 250 µl with MEM (without serum or antibiotics) and added to 250 µl of a 1:50 dilution (in serum/antibiotic free MEM) of LipofectAMINE 2000. Following 6-h incubation at 37°C, fetal bovine serum was added to bring the serum concentration to 5%. G418 (500 µg/ml) was added to the culture starting 48 h post-transfection, and maintained for 2 weeks. The transfected cells remaining after two weeks of G418 treatment (typically <10%) were serially-diluted onto a set of 10 cm2 plates. Once individual colonies reached a size of approximately 300 cells, they were isolated using cloning cylinders and transferred to 24-well plates. Cells, maintained in 300 µg/ml G418, were then sequentially passaged up to T-175 flasks to obtain sufficient cells for assay of ENT1 activity. Multiple cell clones were tested to mitigate against confounding non-specific disruption of cellular activity due to the DNA integration site.
[3H]NBMPR binding
Cells suspended in NMG buffer (∼2×10⁵/ml) were incubated with [3H]NBMPR (±inhibitors) for 45 min at room temperature (∼22°C) to attain steady-state binding. Suspensions were then filtered through Whatman GF/B filters under vacuum, the filters washed twice with Tris-HCl buffer (10 mM, pH 7.4, 4°C), and analyzed for radioactive content by standard liquid scintillation-counting techniques. Nonspecific binding of [3H]NBMPR was defined as that which remained cell-associated in the presence of NBTGR (10 µM). Specific binding was defined as total minus nonspecific binding. KD and Bmax values were calculated from nonlinear (hyperbolic) curve fits (GraphPad Prism 4.03, GraphPad Software, San Diego CA, USA) to non-transformed specific binding data plotted against the free [3H]NBMPR concentration at steady-state. Inhibition constants were calculated from variable slope sigmoid curves fitted to the binding of [3H]NBMPR (0.5 nM), relative to control, against the log of the inhibitor concentration. The Cheng–Prusoff equation (Cheng & Prusoff [Citation1973]) was used to derive Ki values from these studies, using the KD for [3H]NBMPR obtained by mass law analysis as described above.
[3H]2-Chloroadenosine uptake
We (Stolk et al. [Citation2005]), and others (Jarvis et al. [Citation1985]), have shown that [3H]2-chloroadenosine is a substrate for both ENT1 and ENT2, undergoes minimal intracellular metabolism, and has a relatively low nonspecific association with cells compared with other commonly used substrates such as [3H]uridine and [3H]formycin B. Unless indicated otherwise, uptake assays were conducted at room temperature in NMG buffer. The use of the Na+-free buffer ensured that transporter-mediated uptake of [3H]nucleoside was due solely to the operation of the Na+-independent equilibrative transporters that were the focus of the present study. Uptake was initiated by addition of cell suspension (∼1×10⁶ cells) to [3H]nucleoside layered over a 200 µl cushion of silicone oil/mineral oil (21:4 v/v) in 1.5 ml microcentrifuge tubes. Assays were terminated after a defined incubation time by centrifugation of cells through the oil for 5–10 sec at 12,000 g. The supernatant and oil were removed and the cell pellets digested with 1 M sodium hydroxide overnight (∼16 h) at room temperature. The digest was analyzed for [3H] content by standard liquid scintillation counting techniques. Uptake data are presented as intracellular [3H]substrate concentrations (pmol/µl cell volume; µM) after correction for the amount of [3H]label present in the extracellular space of the cell pellet. Total water volumes of the cell pellets were determined in each experiment by incubating cells with [3H]water for 3 min and then processing the samples as described above. An estimate of the extracellular water volume was obtained from extrapolation of the linear time course of non-mediated uptake to “zero-time”. The extracellular water volume was typically found to be less than 15% (∼0.2 µl) of the total volume of the cell pellet. For time course analyses, initial rates (Vi) of flux were estimated as the uptake at 1 s determined by extrapolation of hyperbolic curves fitted (GraphPad Prism v4.03) to time course data, and steady-state intracellular concentrations were estimated by extrapolation of these curves to infinite time. It was determined from the time course profile of transporter-mediated 10 µM [3H]2-chloroadenosine influx that a 15 sec incubation time gave a reasonable estimate of the initial rate of influx, and this time point was used in subsequent kinetic and inhibition experiments. Inhibition constants for selected inhibitors were calculated from variable-slope sigmoid curves fitted to the uptake of 10 µM [3H]2-chloroadenosine, relative to control, against the log of the inhibitor concentration.
Results
Tissue distribution of mENT1a and mENT1b
mENT1a and mENT1b transcripts were both identified in all tissues tested. While between-tissue comparisons cannot be made from these studies, in the absence of a more quantitative approach, it is possible from these data to assess the relative expression of the variants in any one tissue. There were clear differences in the relative amounts of each variant expressed in the different tissues examined (). Brain had the highest relative expression of mENT1a relative to mENT1b, while spleen and liver appeared to have similar levels of each variant.
Figure 2. Relative tissues expression of mENT1a and mENT1b. mRNA was isolated from the indicated mouse tissues (B, brain; H, heart; K, kidney; Li, liver; Lu, lung; P, pancreas; S, spleen; T, testis), and RT-PCR was performed using a primer pair that spanned the region that differed between the mENT1a and mENT1b splice variants (see ). mENT1a and mENT1b cloned into pcDNA3.1 were used as controls (1a, 1b). The PCR amplified products were separated by electrophoresis on a 5% polyacrylamide gel. This is a representative result from 2 independent tissue screens.
Comparison of mENT1a and mENT1b expressed in PK15-NTD cells
The base PK15-NTD cells used to prepare the stable transfectants had no detectable binding sites for [3H]NBMPR and exhibited no significant transporter-mediated uptake of [3H]2-chloroadenosine (data not shown). These results confirm those obtained previously by the research group that generated the PK15-NTD cell mutants (Ward et al. [Citation2000]). The PK15-NTD cells are relatively slow in their proliferation rate (30 h doubling time), likely reflecting the requirement for de novo synthesis of nucleosides. Transfection of PK15-NTD cells with either pcDNA3.1-mENT1a or pcDNA3.1-mENT1b resulted in a significant increase in cell proliferation rate (16 h doubling time) but had no other gross effects on cell morphology.
While both of the transfected cell lines bound [3H]NBMPR with high affinity (, ), small but significant (Student's t-test, p<0.05) differences in [3H]NBMPR binding affinity were apparent between the two ENT1 variants; mENT1a had a KD of 0.15±0.02 nM (average of all controls across 3 cell lines, n=16), which was almost half the KD determined for mENT1b (0.26±0.07 nM, n=14 from three cell lines).
Figure 3. Binding of [3H]NBMPR to PK15 cells transfected with either mENT1a or mENT1b. Cells were cultured for 48 h in the presence or absence of 10 µM TBB and then incubated, in suspension, with a range of concentrations of [3H]NBMPR. Data are plotted as the number of [3H]NBMPR binding sites per cell (ordinate) versus the equilibrium free concentration of [3H]NBMPR (abscissa). Panel A shows the total and nonspecific binding of [3H]NBMPR in mENT1a versus mENT1b cells (cumulative data from 16 independent experiments). Panels B and C show the effect of TBB on the specific binding of [3H]NBMPR to mENT1a and mENT1b, respectively. Each point represents the mean±SEM of four independent experiments. Binding constants derived from these studies are shown in .
![Figure 3. Binding of [3H]NBMPR to PK15 cells transfected with either mENT1a or mENT1b. Cells were cultured for 48 h in the presence or absence of 10 µM TBB and then incubated, in suspension, with a range of concentrations of [3H]NBMPR. Data are plotted as the number of [3H]NBMPR binding sites per cell (ordinate) versus the equilibrium free concentration of [3H]NBMPR (abscissa). Panel A shows the total and nonspecific binding of [3H]NBMPR in mENT1a versus mENT1b cells (cumulative data from 16 independent experiments). Panels B and C show the effect of TBB on the specific binding of [3H]NBMPR to mENT1a and mENT1b, respectively. Each point represents the mean±SEM of four independent experiments. Binding constants derived from these studies are shown in Table I.](/cms/asset/ae73b895-8e4d-4e7e-9fd5-ef7e9c0076ed/imbc_a_220981_f0003_b.gif)
Table I. Kinetic constants for the binding of [3H]NBMPR to PK15-mENT1a and PK15-mENT1b cells with (+TBB) and without (Control) 48 h treatment with 10 µM TBB. Results for two independently derived cell lines are shown for each of mENT1a and mENT1b. Each value represents the mean±SEM from at least four experiments.
The PK15-mENT1a and PK15-mENT1b cells both accumulated [3H]2-chloroadenosine at rates exceeding that of the base PK15-NTD cells. Representative time courses for the uptake of 10 µM [3H]2-chloroadenosine are shown in . At this concentration it must be noted that the maximum intracellular concentration of [3H] exceeded the expected 10 µM, possibly reflecting some intracellular trapping as phosphorylated metabolites. However, this level of trapping was much less than that typically observed when using [3H]adenosine as the ENT1 substrate in this cell line (data not shown). Greater than 80% of the total uptake of [3H]2-chloroadenosine was inhibited by dipyridamole or NBMPR, with the inhibitor-resistant portion being similar to the uptake seen in empty vector-transfected PK15-NTD cells (Vi∼0.05 pmol/µl/s). The initial rates of transporter-mediated uptake of 10 µM [3H]2-chloroadenosine ranged from 0.34–1.45 pmol/µl/s over the four cell lines that were analyzed in detail (two clones of each transfection model).
Figure 4. Time course of [3H]2-chloroadenosine uptake by mENT1a- and mENT1b-transfected PK15 cells. Cells were incubated with 10 µM [3H]2-chloroadenosine in the absence (Total) or presence (Non-mediated, open symbols) of 10 µM dipyridamole/NBMPR for the times indicated. Transporter-mediated uptake (closed symbols) was calculated as the difference between the total and non-mediated uptake components. Uptake is represented as pmole of [3H]2-chloroadenosine accumulated per µl of intracellular water. Each point is the mean±SEM from five experiments.
![Figure 4. Time course of [3H]2-chloroadenosine uptake by mENT1a- and mENT1b-transfected PK15 cells. Cells were incubated with 10 µM [3H]2-chloroadenosine in the absence (Total) or presence (Non-mediated, open symbols) of 10 µM dipyridamole/NBMPR for the times indicated. Transporter-mediated uptake (closed symbols) was calculated as the difference between the total and non-mediated uptake components. Uptake is represented as pmole of [3H]2-chloroadenosine accumulated per µl of intracellular water. Each point is the mean±SEM from five experiments.](/cms/asset/423c80e3-4939-4174-b5fb-f609743cbde6/imbc_a_220981_f0004_b.gif)
Based on these time course profiles, an incubation time of 15 sec was used to determine the rate of influx of a range of concentrations of [3H]2-chloroadenosine (). The kinetic parameters for each transporter are shown in . The maximum rate of [3H]2-chloroadenosine transport (Vmax) generally paralleled the number of binding sites for [3H]NBMPR (Bmax) in each cell line tested (Table I and II).
Figure 5. Effect of CK2 inhibition with TBB on the uptake of [3H]2-chloroadenosine by mENT1a-, mENT1b- and hENT1-transfected PK15 cells. Cells were grown for 48 h in the absence (▪) or presence (□) of 10 µM TBB, and then harvested and incubated with the indicated concentrations of [3H]2-chloroadenosine for 15 sec. Parallel assays were conducted in the absence (total influx) and presence (non-mediated uptake) of dipyridamole/NBMPR and the latter component was subtracted from the total uptake to determine the ENT1-mediated uptake (see ). Results are plotted as pmol of [3H]2-chloroadenosine accumulated per µl of cell water per sec (Vi, ordinate) against the concentration of [3H]2-chloroadenosine (abscissa). Each point is the mean±SEM from at least five experiments. Kinetic constants derived from these data are shown in .
![Figure 5. Effect of CK2 inhibition with TBB on the uptake of [3H]2-chloroadenosine by mENT1a-, mENT1b- and hENT1-transfected PK15 cells. Cells were grown for 48 h in the absence (▪) or presence (□) of 10 µM TBB, and then harvested and incubated with the indicated concentrations of [3H]2-chloroadenosine for 15 sec. Parallel assays were conducted in the absence (total influx) and presence (non-mediated uptake) of dipyridamole/NBMPR and the latter component was subtracted from the total uptake to determine the ENT1-mediated uptake (see Figure 4). Results are plotted as pmol of [3H]2-chloroadenosine accumulated per µl of cell water per sec (Vi, ordinate) against the concentration of [3H]2-chloroadenosine (abscissa). Each point is the mean±SEM from at least five experiments. Kinetic constants derived from these data are shown in Table II.](/cms/asset/8bc9e726-6ad3-415f-a845-2607c71b472c/imbc_a_220981_f0005_b.gif)
Table II. Kinetic constants for the uptake of [3H]2-chloroadenosine by PK15-mENT1a, PK15-mENT1b and PK15-hENT1 cells with (+TBB) and without (Control) 48 h treatment with 10 µM TBB. Results for two independently derived cell lines are shown for each of mENT1a and mENT1b. Each value represents the mean±SEM from at least four experiments.
The capacity of a range of known substrates and inhibitors of mENT1 were tested for their ability to block [3H]2-chloroadenosine uptake by mENT1a and mENT1b. The results of these studies are shown in Figures 6 and 7 and . No significant differences were seen between clonal cell populations so data were pooled for the mENT1a and mENT1b cell lines. The Ki values obtained for each inhibitor were consistent with the known inhibitor sensitivities of the mouse ENT1 transporter (Hammond [Citation1991], [Citation2000]). No differences in inhibitor Ki were observed between mENT1a and mENT1b for the substrates adenosine and uridine, nor for the well-established ENT inhibitors, dipyridamole, dilazep or draflazine. NBMPR, however, had a significant four-fold higher affinity for mENT1a (0.29 nM) compared to mENT1b (1.2 nM) (, ).
Figure 6. Inhibition of mENT1a (□, dashed line)- and mENT1b (▪, solid line)-mediated [3H]2-chloroadenosine influx. Cells were incubated with 10 µM [3H]2-chloroadenosine for 15 sec in the presence or absence of the indicated concentrations of inhibitors. Data are shown as percent of control uptake where the control was the transporter-mediated uptake of 2-chloroadenosine in the absence of inhibitor. Each point represents the mean±SEM from five experiments conducted in duplicate. Ki values derived from these data are shown in .
![Figure 6. Inhibition of mENT1a (□, dashed line)- and mENT1b (▪, solid line)-mediated [3H]2-chloroadenosine influx. Cells were incubated with 10 µM [3H]2-chloroadenosine for 15 sec in the presence or absence of the indicated concentrations of inhibitors. Data are shown as percent of control uptake where the control was the transporter-mediated uptake of 2-chloroadenosine in the absence of inhibitor. Each point represents the mean±SEM from five experiments conducted in duplicate. Ki values derived from these data are shown in Table III.](/cms/asset/c0bf8521-767f-4b16-aea9-c503e2159392/imbc_a_220981_f0006_b.gif)
Table III. Inhibition of the uptake of [3H]2-chloroadenosine by transporter substrates and inhibitors in PK15-mENT1a and PK15-mENT1b cells. NBMPR was tested with and without incubation of cells with 10 µM TBB for 48 h. Each value represents the mean±SEM from at least five experiments.
Effect of TBB on mENT1a/mENT1b/hENT1 function and inhibitor sensitivity
Incubation of PK15-mENT1b cells for 48 h with the CK2 inhibitor TBB (10 µM) resulted in a significant 38% reduction in Vmax of [3H]2-chloroadenosine influx with no change in substrate Km (average of the two cell lines tested; , ) relative to control cells treated with vehicle (DMSO) only. An even greater effect of TBB was observed using PK15-hENT1 cells (49±7% decrease in Vmax). A reduction in the maximum number of [3H]NBMPR binding sites was also observed (29% decrease) when PK15-mENT1b cells were treated with TBB (). There was also a significant increase (∼60%) in the affinity of [3H]NBMPR for the TBB-treated cells relative to control (). An increase in NBMPR binding affinity after TBB treatment was also apparent in studies which assessed the ability of NBMPR to inhibit [3H]2-chloroadenosine uptake. The Ki for NBMPR inhibition in control cells was 0.92 nM; in TBB treated cells the Ki was 0.14 nM (). These effects were only observed after 48 h of incubation with TBB – 24 h incubation had no effect on ENT1b activity (data not shown).
Figure 7. Effect of TBB on NBMPR inhibition of [3H]2-chloroadenosine uptake by mENT1a and mENT1b. Cells, with (□, TBB) or without (▪, Control) 48 h treatment with 10 µM TBB, were incubated with 10 µM [3H]2-chloroadenosine for 15 sec in the presence or absence of the indicated concentrations of NBMPR. Data are shown as percent of control uptake where the control was the transporter-mediated uptake of 2-chloroadenosine in the absence of inhibitor. Each point represents the mean±SEM from five experiments conducted in duplicate. Ki values derived from these data are shown in .
![Figure 7. Effect of TBB on NBMPR inhibition of [3H]2-chloroadenosine uptake by mENT1a and mENT1b. Cells, with (□, TBB) or without (▪, Control) 48 h treatment with 10 µM TBB, were incubated with 10 µM [3H]2-chloroadenosine for 15 sec in the presence or absence of the indicated concentrations of NBMPR. Data are shown as percent of control uptake where the control was the transporter-mediated uptake of 2-chloroadenosine in the absence of inhibitor. Each point represents the mean±SEM from five experiments conducted in duplicate. Ki values derived from these data are shown in Table III.](/cms/asset/b402f4c8-a3b4-4d4c-80e6-d6d73a578438/imbc_a_220981_f0007_b.gif)
In contrast to that seen in PK15-mENT1b and PK15-hENT1 cells, treatment of PK15-mENT1a cells (the variant missing Ser254) with TBB for 48 h had no significant effects on [3H]NBMPR binding or [3H]2-chloroadenosine influx kinetics, and had the opposite effect (decreased affinity) on the ability of NBMPR to inhibit [3H]2-chloroadenosine uptake in the PK15-mENT1a cells (Tables I–III).
Discussion
Murine tissues express two splice variants of the ENT1 transporter that differ in their amino acid sequence such that mENT1a lacks a canonical CK2 consensus sequence for phosphorylation present in mENT1b (Ser254, ). The relative tissue distribution of these variants, as determined in the present study, was similar to that obtained in a previous study by Handa et al. ([Citation2001]). Although both variants are seen to some extent in all tissues examined, brain clearly expressed predominantly mENT1a, while spleen had relatively similar levels of each variant. This differential expression pattern suggests an important role for both variants in the regulation of purine metabolism in mouse tissues. Since one of the few differences between these variants is the presence or absence of a CK2 phosphorylation site, we hypothesized that the variants may differ in their regulation due to phosphorylation by CK2. To date, there is no evidence for direct phosphorylation of ENTs by protein kinases, although there is considerable functional data in the literature showing that PKC and PKA manipulation modifies ENT function and expression (reviewed by Kong et al. [Citation2004]). We have also described an increase in hENT1 expression and function in human U2-OS cells upon inhibition of CK2 activity via transfection with a catalytically inactive CK2aN subunit (Stolk et al. [Citation2005]).
A problem with studying the role of the mENT1 variants in endogenous systems is that most tissues express both variants to some degree (). Therefore we established stable recombinant cell lines on a nucleoside transport deficient PK15 background (PK15-NTD) expressing either mENT1a or mENT1b. We confirmed that the PK15-NTD cells had no measurable NBMPR- or dipyridamole-sensitive [3H]2-chloroadenosine uptake, and did not possess high affinity binding sites for [3H]NBMPR. Therefore, any of these activities measured in the transfected cells could be attributed to expression of the recombinant mENT1a/b transporters. Successful transfection of these cells with mENT1 was also apparent based on the significantly enhanced proliferation rate of the transfected cells relative to the PK15-NTD controls. This likely reflects the enhanced salvage of nucleosides via the recombinant transporters.
With respect to substrate/inhibitor specificity, the mENT1a and mENT1b cells differed in only in their sensitivity to NBMPR. mENT1a had a significantly higher affinity for NBMPR than did mENT1b, measured both directly, by the binding of [3H]NBMPR, and indirectly, via inhibition of [3H]2-chloroadenosine influx by NBMPR. NBMPR is believed to bind to the protein in the region encompassed by TM3 to TM6 (Baldwin et al. [Citation2004]). The predicted phosphorylation site is on the intracellular loop extending from TM6 (Kiss et al. [Citation2000]). Hence phosphorylation of Ser254 may affect the conformation of the TM6 resulting in a minor change in the orientation of amino acids involved in the binding of NBMPR.
To determine if these changes in kinetic characteristics were due to the removal of the CK2 phosphorylation site, the mENT1a and mENT1b cell lines were compared for their sensitivity to the cell-permeable CK2 inhibitor TBB (Zien et al. [Citation2005]). Treatment of the mENT1b cell lines with 10 µM TBB for 48 h led to an increase in [3H]NBMPR binding affinity and enhanced the ability of NBMPR to inhibit uptake. Similar treatment of the mENT1a cell lines had no effect. It is noteworthy that after treatment with TBB, the PK15-mENT1b kinetic characteristics were similar to those seen using the PK15-mENT1a cells. These data suggest that inhibition of CK2-mediated phosphorylation at Ser254 had the same effect on transporter function as the actual loss of Ser254 in mENT1a, implying that this site is constitutively phosphorylated by CK2. Human ENT1 is similar to mENT1b in that it has a serine at position 254, and like mENT1b, TBB treatment dramatically reduced the Vmax of [3H]2-chloroadenosine uptake in PK15-hENT1 cells. These findings indicate that CK2-mediated phosphorylation of Ser254 may also play a role in the regulation of ENT1 activity in humans.
Treatment of the mENT1b cell lines with TBB also led to a significant decrease in the Bmax of [3H]NBMPR binding and the Vmax of 2-chloroadenosine uptake. The decrease in [3H]NBMPR Bmax upon TBB treatment was, however, significantly less than the decrease in Vmax for [3H]2-chloroadenosine uptake. This may reflect the fact that [3H]NBMPR could bind to ENT1 proteins that are in intracellular compartments, whereas actual transport measurements reflect the activity of only plasma membrane ENT1 proteins. The fact that this effect of TBB required greater than 24 h incubation, suggests that the decrease in ENT1b activity induced by TBB may reflect an alteration in the intracellular trafficking of ENT1b such that less of the protein is recycled to the plasma membrane, as opposed to a direct effect on ENT1 internalization. It is also noteworthy that the effect of CK2 inhibition on the rate of [3H]2-chloroadenosine uptake in the PK15-mENT1b and -hENT1 cells (decrease) was the opposite to that seen in human U2-OS cells. Inhibiting CK2 activity in U2-OS cells, either genetically (Stolk et al. [Citation2005]), or pharmacologically (with TBB, unpublished data), increased ENT1 expression and function. This may reflect cell line, endogenous versus recombinant ENT1, or CK2 isoform expression differences (Zien et al. [Citation2005]) in the two experimental models.
In conclusion, the mENT1a and mENT1b splice variants differ in their affinity for the selective inhibitor NBMPR, and this difference is ameliorated upon incubation of the cells with the CK2 inhibitor TBB. CK2 inhibition also leads to a down-regulation of ENT1b, but not mENT1a, activity via a decrease in the number of transporters operating at the level of the plasma membrane. These data suggest that murine cells may subtly modify their purine nucleoside transport capacity by changing the relative expression of mENT1a/mENT1b in concert with factors that modify CK2 expression/activity.
This paper was first published online on iFirst on 08 May 2007.
Acknowledgements
These studies were made possible through a research grant to J.R.H. from the Natural Sciences and Engineering Research Council of Canada. M.S. was also supported by a Postgraduate Scholarship from the Natural Sciences and Engineering Research Council of Canada. K.R. and D.B. acknowledge the graduate research support of the Schulich School of Medicine and Dentistry, University of Western Ontario.
References
- Baldwin SA, Beal PR, Yao SY, King AE, Cass CE, Young JD. The equilibrative nucleoside transporter family, SLC29. Pflugers Arch 2004; 447: 735–743
- Cass CE. Membrane transport of anticancer drugs and drug resistance. Pharmacological sciences: Perspectives for research and therapy in the late 1990s, AC Cuello, B Collier. Birkhauser Verlag, BaselSwitzerland 1995; 413–431
- Cheng Y, Prusoff WH. Relationship between the inhibition constant (K1) and the concentration of inhibitor which causes 50 per cent inhibition (I50) of an enzymatic reaction. Biochem Pharmacol 1973; 22: 3099–3108
- Choi DS, Handa M, Young H, Gordon AS, Diamond I, Messing RO. Genomic organization and expression of the mouse equilibrative, nitrobenzylthioinosine-sensitive nucleoside transporter 1 (ENT1) gene. Biochem Biophys Res Commun 2000; 277: 200–208
- Coe I, Zhang Y, McKenzie T, Naydenova Z. PKC regulation of the human equilibrative nucleoside transporter, hENT1. FEBS Lett 2002; 517: 201–205
- Coe IR, Dohrman DP, Constantinescu A, Diamond I, Gordon AS. Activation of cyclic AMP-dependent protein kinase reverses tolerance of a nucleoside transporter to ethanol. J Pharmacol Exp Ther 1996; 276: 365–369
- Damaraju VL, Damaraju S, Young JD, Baldwin SA, MacKey J, Sawyer MB, Cass CE. Nucleoside anticancer drugs: the role of nucleoside transporters in resistance to cancer chemotherapy. Oncogene 2003; 22: 7524–7536
- Dunwiddie TV, Masino SA. The role and regulation of adenosine in the central nervous system. Annu Rev Neurosci 2001; 24: 31–55
- Hammond JR. Comparative pharmacology of the nitrobenzylthioguanosine-sensitive and -resistant nucleoside transport mechanisms of Ehrlich ascites tumor cells. J Pharmacol Exp Ther 1991; 259: 799–807
- Hammond JR. Interaction of a series of draflazine analogues with equilibrative nucleoside transporters: species differences and transporter subtype selectivity. Naunyn Schmiedebergs Arch Pharmacol 2000; 361: 373–382
- Hammond JR, Stolk M, Archer RG, McConnell K. Pharmacological analysis and molecular cloning of the canine equilibrative nucleoside transporter 1. Eur J Pharmacol 2004; 491: 9–19
- Handa M, Choi D, Caldeiro RM, Messing RO, Gordon AS, Diamond I I. Cloning of a novel isoform of the mouse NBMPR-sensitive equilibrative nucleoside transporter (ENT1) lacking a putative phosphorylation site. Gene 2001; 262: 301–307
- Jarvis SM, Martin BW, Ng AS. 2-Chloroadenosine, a permeant for the nucleoside transporter. Biochem Pharmacol 1985; 34: 3237–3241
- Kiss A, Farah K, Kim J, Garriock RJ, Drysdale TA, Hammond JR. Molecular cloning and functional characterization of inhibitor- sensitive (mENT1) and inhibitor-resistant (mENT2) equilibrative nucleoside transporters from mouse brain. Biochem J 352 Pt 2000; 2: 363–372
- Kong W, Engel K, Wang J. Mammalian nucleoside transporters. Curr Drug Metab 2004; 5: 63–84
- Pinna LA. Protein kinase CK2: A challenge to canons. J Cell Sci 2002; 115: 3873–3878
- Ritzel MW, Ng AM, Yao SY, Graham K, Loewen SK, Smith KM, Hyde RJ, Karpinski E, Cass CE, Baldwin SA, Young JD. Recent molecular advances in studies of the concentrative Na + -dependent nucleoside transporter (CNT) family: identification and characterization of novel human and mouse proteins (hCNT3 and mCNT3) broadly selective for purine and pyrimidine nucleosides (system cib). Mol Membr Biol 2001; 18: 65–72
- Sarno S, Reddy H, Meggio F, Ruzzene M, Davies SP, Donella-Deana A, Shugar D, Pinna LA. Selectivity of 4,5,6,7-tetrabromobenzotriazole, an ATP site-directed inhibitor of protein kinase CK2 (‘casein kinase-2’). FEBS Lett 2001; 496: 44–48
- Stolk M, Cooper E, Vilk G, Litchfield DW, Hammond JR. Subtype-specific regulation of equilibrative nucleoside transporters by protein kinase CK2. Biochem J 2005; 386: 281–289
- Van Belle H. Nucleoside transport inhibition: a therapeutic approach to cardioprotection via adenosine?. Cardiovasc Res 1993; 27: 68–76
- Ward JL, Sherali A, Mo ZP, Tse CM. Kinetic and pharmacological properties of cloned human equilibrative nucleoside transporters, ENT1 and ENT2, stably expressed in nucleoside transporter-deficient PK15 cells. ENT2 exhibits a low affinity for guanosine and cytidine but a high affinity for inosine. J Biol Chem 2000; 275: 8375–8381
- Zien P, Duncan JS, Skierski J, Bretner M, Litchfield DW, Shugar D. Tetrabromobenzotriazole (TBBt) and tetrabromobenzimidazole (TBBz) as selective inhibitors of protein kinase CK2: Evaluation of their effects on cells and different molecular forms of human CK2. Biochim Biophys Acta 2005; 1754: 271–280