?Mathematical formulae have been encoded as MathML and are displayed in this HTML version using MathJax in order to improve their display. Uncheck the box to turn MathJax off. This feature requires Javascript. Click on a formula to zoom.
ABSTRACT
There is growing concern about the mental wellbeing of young people, including how this is related to national tests. This is a particularly important policy issue in England, where it is claimed that the end of primary Key Stage 2 tests cause schools, pupils and teachers stress. I investigate this issue using data from the Millennium Cohort Study, comparing the wellbeing of pupils in England (measured around the point they are sitting their Key Stage 2 tests) to the rest of the UK (where Key Stage 2 tests are not taken). No evidence is found that the Key Stage 2 tests in England is associated with lower levels of happiness, enjoyment of school, self-esteem or children’s mental wellbeing. Likewise, no evidence is found that children who are happier, more self-confident or with higher levels of wellbeing obtain higher Key Stage 2 test scores.
KEYWORDS:
1. Introduction
High-stakes tests, where children sit assessments covering key academic competencies with results potentially having material consequences for themselves and their schools, are becoming an increasingly common element of school systems across the world (Howard, Citation2020). In many countries, such tests go hand-in-hand with school and teacher accountability, with the results used to make judgements about pupil, school and teacher performance (Amoako et al., Citation2019). Some argue that the independent information provided by such tests play a vital role in monitoring and supporting young people’s academic achievement, allowing underperforming pupils, teachers and schools to be identified and remedial action to be put in place (Figlio & Loeb, Citation2011). Results from such assessments also play a key role in providing information to key education stakeholders, with ‘league-tables’ published by the national government to help parents select the appropriate school for their child (Allen et al., Citation2014).
Yet high-stakes testing has also come under much criticism within the education community (Minarechová, Citation2012). It has been argued that high-stakes testing in a small number of key subjects (usually English and mathematics) leads to a narrowing of the school curricula, with teachers spending less time on Arts, Humanities and Social Studies, and instead being motivated to ‘teach to the test’ (Berliner, Citation2011). Others have suggested that the results from such tests do not fulfil their intended purpose, are misused in making judgements about school and teacher effectiveness (Bitler et al., Citation2019) and may hinder rather than support the development of children (Amrein & Berliner, Citation2003). This, in turn, undermines the important work done by schools.
However, by far the strongest criticism against such tests is that they cause stress and harm the wellbeing of young people (Cho & Chan, Citation2020; UK Education Select Committee, Citation2020). This has been a growing concern in recent years, with mental health problems amongst school children in England on the rise (NHS Digital, Citation2018). Although such mental health problems are likely to have many causes, including family relationships (Amato and Keith Citation1991), genetics (Gottschalk & Domschke, Citation2017) and social media (Frith, Citation2017), it is widely believed that high-stakes testing – putting extra pressure upon young people – is partially to blame. Much discussion of this issue focuses upon teenagers, as they prepare to take end of secondary school examinations, such as the General Certificate of Secondary Education (GCSE) in England. Yet there has been growing concern about the impact that high-stakes testing has upon younger pupils as well (UK Education Select Committee, Citation2020). For instance, almost all 10/11-year-olds in England take Key Stage 2 Standard Attainment Tests (SATs) when they finish primary school. It has been claimed that these tests cause stress amongst both teachers and pupils (Bradbury, Citation2019), with newspapers headlines screaming how ‘more primary school children [are] suffering stress from SATs’ (Weale, Citation2017) and how the ‘stress of SATs gives children nightmares’ (Ward, Citation2018).
But is this really true? The main thrust of the existing academic evidence on this issue would seem to suggest so. For instance, Reay and Wiliam (Citation1999:346) undertook qualitative research with a class of 20 students in a working-class primary school in London. They found that ‘SATs have set in motion a new set of tensions with which year 6 students are expected to cope’ and ‘there are strong currents of fear and anxiety permeating children’s relationships to the SATs process’. Similarly, Webb and Vulliamy (Citation2006) argued that the testing system in England led to stress and anxiety amongst pupils. Reviewing the literature, Wyse and Torrance (Citation2009:219) argued that ‘the introduction of the National Curriculum Tests in England seemed to produce a correlation between low achievement and low self-esteem’. Connor (Citation2001) found that, although the introduction of Key Stage 2 tests in England was linked to an overall rise in education standards, there were also signs that they had led to increased stress amongst pupils. This finding was then replicated within another small-scale follow-up survey (Connor, Citation2003). Importantly, Connors et al. (Citation2009:9) described how there was ‘a distinct temporal dimension’ about pupils’ feelings towards the Key Stage 2 tests, with many nervous beforehand (particularly in the period following the Easter holiday) but then experienced ‘a sense of relief once the SATs were over and done with’. In a large-scale survey, Hutchings (Citation2015) found that most teachers strongly agreed with the statement that ‘many pupils become very anxious/stressed in the time leading up to SATs’ (Hutchings, Citation2015:55), with a teacher stating in a qualitative interview that ‘In the lead up to SATs, I have had pupils in tears, feeling sick, feeling stressed because they were so worried about the results from the tests’ (Hutchings, Citation2015:56).
On the other hand, it is also worth noting the counterarguments as to why the Key Stage 2 tests may not be negatively associated with pupil wellbeing. Three possibilities stand out. First, tests are not inherently high or low stakes, with this depending upon (and differing across) stakeholders. Thus, while Key Stage 2 tests may well be high-stakes for teachers and schools (due to the publication of school league tables) this may not be the case for children (and, in turn, their parents), given that there are no major educational consequences for them based upon the results. Children may therefore not feel any added pressure from Key Stage 2 tests in comparison to the likely alternatives, such as schools/teachers using their own end-of-year tests or a greater reliance upon teacher assessment. Second, given that Key Stage 2 tests may well be considered high-stakes for teachers and schools, it has been argued that these groups may in-turn increase the academic pressure they put upon pupils via ‘fear appeals’ (Putwain & Von Der Embse, Citation2018). Yet we do not currently have a good estimate of how prevalent the use of such fear appeals are amongst teachers of Key Stage 2 pupils across England as a whole. Indeed, many primary school teachers may be more concerned about the welfare of their pupils, rather than how they perform on the Key Stage 2 tests, and thus may actually try to protect them from such pressures, rather than to try and use them as a performance-enhancing tool. Moreover, the impact such fear appeals have upon children across the population as a whole is not clear, with there likely to be heterogeneous effects. For instance, while some Key Stage 2 pupils may see such fear appeals as threatening, others may respond positively to them as a challenge. This is consistent with the work of Putwain et al. (Citation2012:299), who noted how there were a ‘variety of experiences of SATs – some as anxiety-provoking and stressful, consistent with threat appraisals, and some as more positive (e.g. excitement), consistent with a challenge appraisal’. At the population level, it is hence possible that negative effects upon the wellbeing of some pupils may be offset by positive effects upon others. Finally, the impact that Key Stage 2 tests have upon children could be domain-specific, having a narrow impact upon their attitudes and feelings about school. This may – or may not – spill over into their general wellbeing overall.
Although the work cited above are insightful, important gaps in the evidence on the link between Key Stage 2 tests and pupil wellbeing remain. Much of the work in this area is of a qualitative nature, or based upon small convenience samples. Moreover, very few studies have attempted to contrast findings against a meaningful control group, who have not had to sit the Key Stage 2 tests at the same time. Similarly, few studies have attempted to evaluate whether children’s socio-emotional outcomes, such as their mental wellbeing, happiness, self-esteem or enjoyment of school, improves once the Key Stage 2 tests have passed. This, in turn, leaves several important questions unanswered. For instance, is the wellbeing of primary school children who face taking high-stakes national tests lower than those who do not? Does the wellbeing of primary pupils decline in the approach to these tests, but then return to a more normal state afterwards (as suggested by much of the existing evidence base described above)? And how much of a problem is this really in England, where national tests for primary schools carry particular importance (at least for schools)?
This paper attempts to make this contribution to the existing literature. Using Millennium Cohort Study (MCS) data from the United Kingdom, we draw comparisons of pupil wellbeing across England (where Key Stage 2 tests are sat at the end of primary school) and the rest of the UK (where Key Stage 2 tests are not taken). Importantly, a large part of the age 11 MCS fieldwork was conducted during the Key Stage 2 test period, meaning we can also examine how pupil wellbeing changes as these high-stakes tests approach. Finally, we also investigate whether pupil wellbeing is associated with performance on the Key Stage 2 tests in England. In other words, do pupils who feel unhappy in the build-up to Key Stage 2 tests end up with lower scores on these tests?
To preview key findings, this paper largely presents a story of null effects. No consistent evidence is found of children’s mental wellbeing, happiness, self-esteem or enjoyment of school being associated with the timing of Key Stage 2 tests in England. Differences in these socio-emotional outcomes between England and the rest of the UK are also typically small in terms of magnitude, with little sign that they differ before and after the Key Stage 2 tests take place. Similarly, no link is found between children’s socio-emotional state (such as their happiness, wellbeing or enjoyment of school) and their scores on the Key Stage 2 tests. Hence, in stark contrast with existing literature and conventional wisdom, this paper concludes that there is no suggestion that primary school children’s wellbeing is substantially affected by the presence of national tests, and that there is insufficient evidence to support calls for the Key Stage 2 tests to be scrapped.
The paper now proceeds as follows. The Millennium Cohort Study (MCS) data is described in section 2, along with our empirical methodology. Results are presented in section 3, with discussion and conclusions in section 4.
2. Methodology
2.1 Data
The Millennium Cohort Study (MCS) is a rich, nationally-representative longitudinal study of UK children. A stratified, clustered survey design was used, with geographic areas (electoral wards) selected as the primary sampling unit, and then households with newly born children randomly selected from within (see Plewis, Citation2004 for further details). Six waves have been conducted between 2000/01 and 2015, when children were nine months, 3, 5, 7, 11 and 14 years old. Parents, children and their teachers have been interviewed within the various waves. In total, 19,243 cohort members participated in the first survey, when children were nine months old (12,224 in England). Within this paper, the focus is upon data from the fifth survey wave when children were in the final year of primary school. Unless stated otherwise in the table/figure notes, the MCS wave 5 survey weight is applied throughout the analysis, with standard errors adjusted for the clustering in the MCS survey design.
Key stage 2 tests and the timing of MCS fieldwork
In England, children sit national Key Stage 2 tests at the end of primary school. These focus upon children’s skills in English (reading, writing, spelling, punctuation and grammar) and mathematics. They are ‘high-stakes’ for schools, who get publicly ranked in school league tables based upon the results (Bew, Citation2011). For pupils, information on Key Stage 2 performance may be used by secondary schools to determine their set allocation and target GCSE grades (The School Run, Citation2020). Importantly, it is only children in England, and not the rest of the UK, who take these tests. Key Stage 2 total mathematics scores are used as outcome variables in parts of the analysis (analogous results for English and total average Key Stage 2 point scores are provided in Appendix F). These have been standardised to mean zero and standard deviation one (using all MCS fifth wave respondents with data available) so that estimates can be interpreted in terms of effect sizes.
Key Stage 2 tests take place in one specific week of the academic year. In 2012, this was the week beginning 14th May. illustrates how the timing of the test is related to the fifth wave MCS fieldwork. There is clearly quite substantial overlap, with the MCS fieldwork in England taking place in the build up to the Key Stage 2 test week.
Table 1. The number of MCS surveys completed between March and August 2012 by week
Measures of pupil wellbeing
Within the fifth MCS survey wave, children answered a self-completion questionnaire. Throughout this paper, the following outcomes are of interest, measured using standardised scales:
Mental well-being. Children were asked: ‘In the last four weeks, how often did you (a) feel happy; (b) get worried about what would happen to you; (c) feel sad; (d) feel afraid or scared; (e) laugh; (f) get angry?’. Answers to each of the above statements were given using a five-point scale (never, almost never, sometimes, often, always). Cronbach alpha = 0.75.
Self-esteem. Children were asked: “How much do you agree or disagree with the following statements about you? (a) On the whole, I am satisfied with myself; (b) I feel that I have a number of good qualities; (c) I am able to do things as well as most other people; (d) I am a person of value; (e) I feel good about myself. Answers were provided to each statement using a four-point scale (strongly agree to strongly disagree). Cronbach alpha = 0.74.
Happiness. Children were asked: ‘On a scale of 1 to 7 where ‘1ʹ means completely happy and ‘7ʹ means not at all happy, how do you feel about (a) your school work; (b) the way you look; (c) your family; (d) your friends (d) the school you go to; (e) your life as a whole?’ Cronbach alpha = 0.83.
School enjoyment. Children were asked: ‘How much do you (a) like school (b) like English; (c) like maths; (d) try your best at school; (e) find school interesting; (f) feel unhappy at school; (g) get tired at school; (h) feel school is a waste of time (i) I care how well I do at school’. These statements were answered using either three-point or four-point scale. Cronbach alpha = 0.78.
Two-Parameter Item-Response Theory (IRT) models are used to create the four outcome scales, based upon the questionnaire items outlined above. These scales are standardised to mean zero and standard deviation one across all wave 5 MCS respondents, with all results hence presented in terms of effect sizes. (An item-level analysis, where results are reproduced for each question separately, rather than combining them into scales, is presented in Appendix E).
Background data
A wide array of information has been collected from children and their families in previous survey waves. As well as information on demographic background (gender, ethnicity, parental education) this includes attitudes and enjoyment of school at age 7, behavioural issues (as measured by the Strengths and Difficulties questionnaire) and scores on a range of low-stakes cognitive tests (including in reading and mathematics). Such information are used as controls within the analysis.
2.2 Methodology
Differences in socio-emotional outcomes between England and the rest of the UK
To begin, the four socio-emotional outcomes of interest will be compared across England (where Key Stage 2 tests are taken) and the rest of the UK (where they are not). The sample is first restricted to only those children who completed the MCS survey between Friday 30 March 2012 and Thursday 17 May 2012 (the end of the Key Stage 2 test window). Average scores for each of the four scales (and upon each item) are then compared between children who live in England and children who live in other parts of the UK. If Key Stage 2 tests really do have a substantial negative impact upon children’s wellbeing, then one would anticipate that school enjoyment, happiness, self-esteem and mental wellbeing to be lower in the former (England) than the latter (rest of the UK). For reference, provides a comparison of the background characteristics of children in England and the rest of the UK. This comparison is presented both before and after the sample restriction discussed above has been imposed.
Table 2. Background characteristics of the MCS sample
To check that the results are not being driven by differences in the composition of the sample across countries, the following OLS regression model will be estimated to supplement the descriptive analysis outlined above:
Where:
Oij= The socio-emotional outcome scale of interest.
= A dummy indicator for whether the child lives in England (1) or not (0).
= A vector of controls for children’s background characteristics (ethnicity, household income, single parent household, parental education, gender).
= Academic achievement of the child measured at age 7, based upon scores in the MCS maths, pattern construction and reading tests.
= A vector of socio-emotional outcomes measured for the child at age 7, including happiness, SDQ scores, school enjoyment and mental wellbeing.
= The error term.
i = Child i.
j = Primary sampling unit j.
The model presented in Equationequation (1)(1)
(1) includes controls for gender, family background and a range of socio-emotional and cognitive measures gathered in the prior (age 7) survey wave, with imputation used to account for any missing covariate data. The parameter of interest from this model is β; the extent that wellbeing, self-esteem, happiness and enjoyment of school is lower amongst children in England than the rest of the UK in the build-up to the Key Stage 2 tests.
The robustness of these results will be tested by re-producing estimates having either extended the time horizon used to determine the sample window (e.g. to include those interviewed between March 1st and 17 May 2012) or reducing it (e.g. to between April 17th and 17 May 2012).
Changes in socio-emotional outcomes around the key stage 2 test date
Next, I investigate how socio-emotional outcomes of children change as the Key Stage 2 test date approaches. The expectation is that, if these tests really do have a negative impact upon children’s well-being, then there should be a spike in the percentage of young people reporting poor socio-emotional outcomes (e.g. unhappiness at school and more generally in life) the closer the MCS wave 5 survey was to the Key Stage 2 test date. In particular, one would anticipate that those who completed the MCS survey close to the test week (May 14th) would have worse socio-emotional outcomes than those who completed the survey a long time beforehand (e.g. February 2012) or afterwards (e.g. June/July 2012). Importantly, such a pattern should only be observed in England – and not the rest of the UK – as England is the only country which runs Key Stage 2 tests.
The analysis will begin by simply plotting the average score on each of the four outcome measures by the date (week) the MCS survey was completed (separately for England and the rest of the UK). However, in order to place a causal interpretation on these results, one must assume that the timing of the MCS interviews is not systematically related to the Key Stage 2 tests. For instance, if children with certain characteristics (e.g. children with particularly low levels of wellbeing) managed to move their survey date to avoid a clash with the Key Stage 2 tests, then such an assumption would be unlikely to hold. Unfortunately, such detailed information about the MCS interview schedule is not available within the data held. It is however possible to control for the background characteristics of cohort members in the analysis (including their wellbeing measured at the prior – age 7 – survey wave) to provide some reassurance that this is not driving the results.
Consequently, our primary analysis will be based upon the following OLS regression model:
Where:
= One of the outcomes of interest (e.g. mental well-being scale).
Surveyweeki= The week when the child/family completed the MCS survey (entered as a set of dummy variables).
= A vector of background characteristics measured prior to the age 11 survey wave. This includes gender, socio-economic status, prior academic achievement and socio-emotional outcomes (e.g. happiness, SDQ scores) at age 7.
i = Child i.
j = Electoral ward j (the primary sampling unit in the MCS).
= Error term.
The parameter of interest from model (2) is . This reveals the strength of the association between the MCS survey week and children’s socio-emotional outcomes after key potential confounders (such as gender, socio-economic status, prior academic achievement, prior measures of happiness, self-esteem and well-being) have been controlled. To summarise results from this model, predicted scores for each outcome are generated, with the average of these predictions then presented by survey week. It is of particular interest as to whether there are non-linearities in these average predicted values, and whether one observes a ‘spike’ in poor socio-emotional outcomes (e.g. unhappiness) the closer the MCS survey was to the Key Stage 2 test week.
The link between pupil wellbeing and key stage 2 performance
Finally, I am also interested in the link between children’s wellbeing in the build-up to the Key Stage 2 tests and their subsequent test performance. The MCS sample is first restricted to children in England who were surveyed between Friday 30 March 2012 and Thursday 17 May 2012 (the end of the Key Stage 2 test window), where consent was obtained by the survey organisers to link the data to administrative records (the National Pupil Database). This leaves an analytic sample size of 1,977 pupils.
The mental state of this group of children in the lead up to Key Stage 2 tests is known. This includes how happy they were at school, their self-confidence as well as their general well-being. These variables will be used as the key covariates in a regression model, investigating whether they are associated with children’s Key Stage 2 scores. The models will again include a wide array of controls for potential confounding factors, including demographics, socio-emotional outcomes and prior achievement measured in previous MCS sweeps (captured by the wide array of cognitive tests conducted as part of the MCS). Formally, this model will be specified:
Where:
= Key stage 2 scores.
= Indicators of children’s mental state in the lead up to the Key Stage 2 tests (e.g. low scores on the mental well-being scale).
= A range of potential confounders (e.g. demographics).
= Measures of children’s achievement at age 7.
= Measures of children’s socio-emotional outcomes at age 7.
Multiple imputation will be used to adjust for item non-response, with Huber-White adjustments made to the estimated standard errors to take the complex survey design into account. The parameter of interest ( will capture the extent that children’s mental state (recorded in the six-week period before their Key Stage 2 tests) is associated with the scores they achieved on this test (controlling for the other factors in the model). Importantly, this will include rich controls for prior achievement and for their socio-emotional outcomes in previous MCS waves. These estimates will thus provide new insight into how children’s mental state in the run-up to their Key Stage 2 tests is linked to their performance on this test, over and above previous experience of socio-emotional issues (e.g. low self-confidence, behavioural problems).
Four specifications of this model will be estimated. First, the unconditional bivariate association will be presented (i.e. a model with no controls). The second model specification will then add controls for children’s demographic background, with measures of prior academic achievement added in model three. The final model – which is the preferred specification – will include controls for demographic characteristics, prior academic achievement (measured at age 7) and prior socio-emotional outcomes (also measured at age 7). The robustness of these results will also be tested to altering the time window used to define the analytic sample (see Appendix C and D). In the main text, results are presented using Key Stage 2 mathematics scores as the outcome variable. Analogous results focusing upon Key Stage 2 English and total average point scores can be found in Appendix F.
3. Results
Differences in socio-emotional outcomes in the build-up to key stage 2 tests
begins by presenting differences in the four socio-emotional outcome measures between children in England and the rest of the UK. Recall that the sample has been restricted to those children who completed the MCS age 11 survey up to six weeks before the Key Stage 2 tests took place. Panel (a) presents unconditional estimates, with results from the regression models presented in panel (b). All estimates refer to effect sizes, with positive (negative) values indicating better (worse) outcomes in England than the rest of the UK.
Table 3. Socio-emotional outcomes prior to Key Stage 2 tests. Differences between children in England and the rest of the UK
In the build-up to Key Stage 2 tests, children’s mental wellbeing is lower in England than in other parts of the UK. This holds true in both panel a (unconditional) and panel b (conditional), with the addition of controls leading to essentially no change in the parameter estimates. In terms of magnitude, the difference is modest, standing at an effect size difference of around 0.17 standard deviations (statistically significant at the five percent level). hence provides clear evidence that, at least in the period leading up to Key Stage 2 tests, the mental wellbeing of pupils in England is lower than in other parts of the UK.
On the other hand, the final row of suggests that the opposite holds true for children’s enjoyment of school. Specifically, school engagement is actually reported to be slightly higher amongst children who live in England in the build-up to the Key Stage 2 tests, compared to those who live elsewhere. Again, the difference is relatively small, standing at 0.19 standard deviations in panel a (unconditional estimates) and 0.11 standard deviations in panel b (conditional estimates), with the latter sitting just on the boundary of statistical significance at the conventional five percent threshold (p = 0.05; t = 1.96). Nevertheless, there is clearly no evidence from that the Key Stage 2 tests lead pupils to stop enjoying or becoming disengaged from school, with it quite possible that the opposite (to a small extent) holding true.
Results for the other two outcomes (happiness and self-esteem) are slightly more mixed. In the unconditional estimates, differences between children in England and the rest of the UK are essentially zero. These differences increase in the conditional estimates presented in panel (b), up to around 0.1 standard deviations, with children in England displaying slightly lower levels of happiness and self-esteem. For both outcomes, the difference between England and the rest of the UK is on the boundary of statistical significance in the conditional estimates, though the magnitude is small. Hence, overall, there is little evidence of a substantive difference in happiness and self-esteem of children in England and children in the rest of the UK as the Key Stage 2 test week approaches.
Variation in socio-emotional outcomes around the key stage 2 test week
The analysis now turns to variation in children’s mental wellbeing in the period before and after the Key Stage 2 test week. If preparation for the Key Stage 2 tests has an influence upon pupils’ socio-emotional outcomes, one would expect a decline (in mental wellbeing, for instance) in England as the tests approach (e.g. due to the increased workload and pressure induced by the test). One would then expect there to be reversion towards the mean after the tests have been completed, as any stress, anxiety and pressure from the test fades away. Similarly, differences in socio-emotional outcomes between England and the rest of the UK should increase up to the Key Stage 2 test week and then decline afterwards.
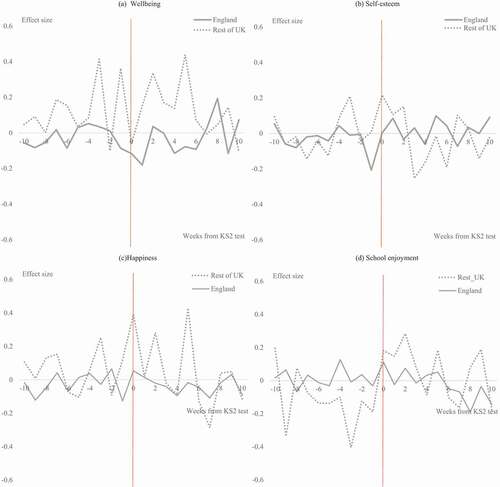
considers whether such a pattern can be observed within the MCS data, presenting local polynomial smoothing estimates of the link between the MCS age 11 survey date and the four socio-emotional outcomes of interest. Alternative estimates plotting the mean scale score for each outcome by survey week can be found in Appendix A.
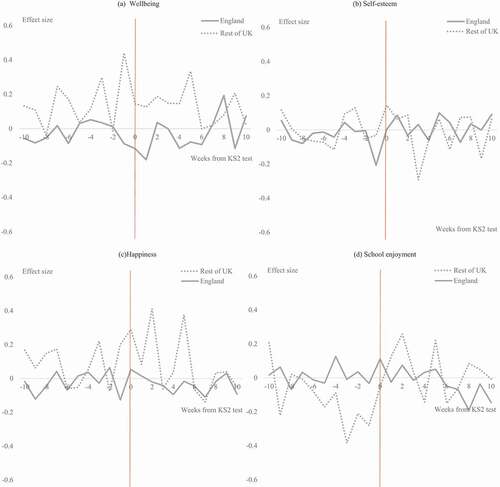
Figure 1. Variation in socio-emotional outcomes around the Key Stage 2 test date. Pupils in England compared to the rest of the UK. (a) Wellbeing; (b) Self-esteem; (c) Happiness and (d) School enjoyment
Panel (a) begins with the estimates for mental wellbeing. There are three key points to note. First, the estimates for England are always lower than the estimates for the rest of the UK. This in part reflects the finding already presented from ; children’s mental wellbeing tends to be slightly lower in England than elsewhere. Second, the trend line for England is essentially flat; one does not observe any clear, systematic fluctuation in the estimates around the Key Stage 2 test date. Finally, there is some suggestion that the gap in mental wellbeing between children in England and the rest of the UK widens slightly as the Key Stage 2 test week approaches and falls slightly afterwards (this can be seen via the arch in the dotted line for the rest of the UK). This should be caveated, however, by the fact that (i) it is driven by changes in the results for the rest of the UK (and not England) and (ii) the magnitude of any change over this period is small (0.1 standard deviations or less). Overall, panel (a) therefore does little to suggest that the mental wellbeing of children in England is linked to the Key Stage 2 tests.
Panels (b) and (c) present analogous estimates for children’s self-esteem and their levels of happiness. Regarding the former, the trend lines for England and the rest of the UK always sit close together, with neither showing any clear association with the MCS survey date. In particular there is no evidence that children in England suffer from lower self-esteem at the time that Key Stage 2 tests take place. With respect to the latter, children in England report lower levels of happiness than their peers elsewhere in the UK (effect size difference = 0.1). Yet this holds true throughout the period under investigation, with no evidence that this difference is related to the survey date, or that there is any ‘peak’ around the Key Stage 2 test week. Indeed, a similar gap in children’s happiness between England and the rest of the UK continues to be observed even when the MCS survey was conducted during the school summer holidays (i.e. the period around 70 days after the Key Stage 2 test week). Put another way, the two trend lines plotted in ) are always parallel. There is consequently little to suggest that the self-esteem and happiness of children in England are, on average, related to the fact that they sit Key Stage 2 tests.
Finally, results for school enjoyment are plotted in panel (d). Interestingly, the figures for England and the rest of the UK start off reasonably close together (e.g. at around 90 days before the Key Stage 2 tests are taken). Then, from around 60 days before the Key Stage 2 tests, the two lines start to diverge. From this point until the Key Stage 2 test week, school enjoyment amongst pupils in England is, on average, marginally higher than in the rest of the UK (effect size difference of around 0.1). Then, after the Key Stage 2 tests have finished, the two lines then come together. A cautious interpretation of this finding is that it provides little evidence that children’s enjoyment of schools is negatively affected by the Key Stage 2 tests, with it possible that the opposite might even hold true.
provides similar estimates, but are now conditional results based upon the regression models specified in section 2.2 (which includes controls for demographic background, prior academic achievement and socio-emotional outcomes of children at age 7).
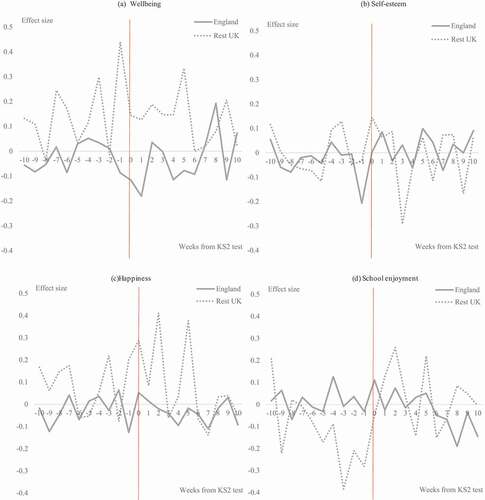
Figure 2. Differences in socio-emotional outcomes between England and the rest of the UK around the Key Stage 2 test week. Conditional estimates. (a) Wellbeing; (b) Self-esteem; (c) Happiness; (d) School enjoyment
On the whole, the key findings from these conditional estimates follow a similar pattern to those for the unconditional estimates presented in above. The mental wellbeing of children in England is always slightly lower than the mental wellbeing of children elsewhere in the UK (see )). Yet there is no sign that this varies systematically around the Key Stage 2 test week, with any difference in the mental wellbeing of children in England and other parts of the UK apparently greatest after the Key Stage 2 tests have been taken. This reiterates the substantive conclusion presented above; there is little to suggest that Key Stage 2 tests in England have any clear link to children’s mental wellbeing.
A similar pattern emerges with respect to children’s self-esteem ()) and their happiness in general ()). In the former, the estimated trend line for England is essentially flat, overlaps with the line for the rest of the UK, with no evidence of there being any peak near the Key Stage 2 test week. Likewise, there is no evidence that children in England reported being happier after the Key Stage 2 tests had passed, or that they were any less happy as the tests approached (see )). There is hence again no evidence that children’s level of happiness or self-confidence is linked to the Key Stage 2 tests.
Finally, in ), one once again observes enjoyment of school to be slightly higher in England than the rest of the UK in the six weeks prior to the Key Stage 2 tests taking place (a difference of up to 0.2 standard deviations). However, once the Key Stage 2 tests have finished, school enjoyment amongst children in England is similar to the rest of the UK. Note though that this result is not being driven by changes in school engagement in England, with average scale scores broadly flat in this country over the 20-week period considered. Rather, the change seems to be driven by lower levels of school enjoyment elsewhere in the UK during the first summer half-term. Regardless, ) continues to support the conclusion of there being no evidence of a negative association between Key Stage 2 tests and children’s enjoyment of school in England.
The link between pupil wellbeing and key stage 2 performance
To conclude, considers the link between each of the four age 11 socio-emotional scales and children’s Key Stage 2 mathematics scores (see Appendix F for analogous results for English and total average point scores). Recall that the sample has been restricted to children in England who completed the MCS survey in the six weeks prior to the Key Stage 2 test week. Estimates refer to effect size changes in Key Stage 2 mathematics scores for a one standard deviation increase in the relevant socio-emotional scale. Model M3 is the preferred specification (with the richest set of background controls) and is hence the focus of discussion.
Table 4. The link between children’s socio-emotional state prior to the Key Stage 2 tests and their mathematics test scores
Starting with children’s mental wellbeing, there is no evidence that this is linked to performance on the Key Stage 2 tests. This holds true even in the most basic model specification without any controls (M0), with a one standard deviation increase in children’s mental wellbeing associated with just a 0.02 standard deviation change in Key Stage 2 mathematics test scores. The estimated effect size is hence consistently small and not statistically significant at conventional thresholds.Footnote1 Key Stage 2 scores hence do not seem to be related to children’s mental wellbeing.
A similar result emerges for the link between children’s happiness, self-esteem and their Key Stage 2 scores. Although there does appear to be a positive association in Model M0 (no controls) and M1 (demographic controls only), the estimated effect sizes fall rapidly once prior achievement measured at age 7 (model M2) and prior socio-emotional outcomes measured at age 7 (model M3) have been controlled. Hence, in the preferred model specification (M3), a one standard deviation increase in children’s self-esteem or their happiness is associated with only a very small (and statistically insignificant) 0.02–0.03 standard deviation change in Key Stage 2 mathematics scores. There is hence little evidence that happier or more self-confident children perform better in their Key Stage 2 tests.
The final column of concludes with the results for the association between Key Stage 2 mathematics scores and children’s enjoyment of school. A small association remains in model specification M3, with a one standard deviation increase in school enjoyment linked to a 0.04 standard deviation increase in Key Stage 2 mathematics test scores (this sits on the boundary of statistical significance – p = 0.025; t = 2.24 – at the conventional five percent level). Yet caution should be exercised when interpreting this result, for at least two reasons. First, it should be emphasised that any association between these two variables is weak, with a very large change in the school enjoyment scale (of around three standard deviations) needed to generate even a 0.1 standard deviation increase in Key Stage 2 scores. Second, it is possible that there are unobserved confounders that have not been controlled, which may further drive the effect towards zero (following the declining effect size observed when additional controls are added between model M0 and M3). The most appropriate interpretation hence seems to be that the link between enjoyment of school in the build-up to the Key Stage 2 tests and performance on these tests is weak (at best).
Bringing these results together, overall, there is little evidence to suggest that children’s socio-emotional state (such as their happiness, mental wellbeing, self-esteem or enjoyment of school) is related to their scores on the Key Stage 2 tests.
Robustness tests
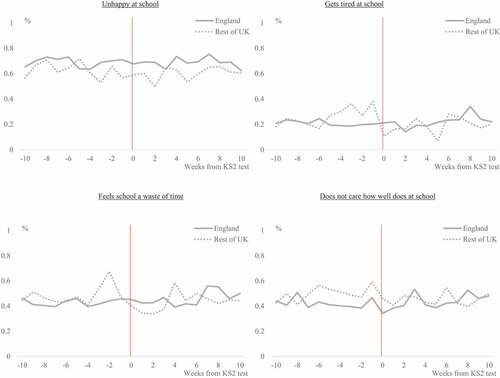
The appendices to this paper present a series of alternative estimates to illustrate the sensitivity of the results to different analytic choices. In Appendix B, the ‘rest of the UK’ is restricted to children living in Wales and Scotland only, given that the high-stakes ‘transfer test’ (which determines grammar school entry) is also taken by Northern Irish pupils in the final year of primary school (albeit much earlier – typically around November, with results released in January – in the academic year). The exclusion of Northern Irish pupils does little to change the substantive results. Appendix C restricts the sample selection used in parts of the analysis (e.g. ) to a shorter period of time before the Key Stage 2 test date. Similarly, Appendix D extends the sample selection to a longer period of time. Again, results do not materially differ to those from the main analysis presented above. Appendix E provides an item-level analysis. Specifically, rather than constructing four scales from the various questionnaire items, responses to each question are analysed individually. The motivation is that some questions on some scales may theoretically be more likely to be linked to the Key Stage 2 test than others. Take the happiness scale, for instance. Arguably, responses to the items asking children how happy they are about their school work and the school they go to are more relevant for the analysis than the items asking about children’s happiness with their looks or their friendship groups. Overall, little consistent evidence emerges that the results presented above are driven by responses to particular items, including those most clearly tied to children’s experiences at school. Finally, Appendix F investigates the links between the wellbeing measures and pupils performance on the Key Stage 2 English tests, as well as their total Key Stage 2 point scores. Consistent with the results focusing upon mathematics scores presented in , we generally find the association between the wellbeing of primary school pupils and their performance on the Key Stage 2 tests to be weak.
4. Conclusions
National examinations are becoming an increasingly common feature of education systems across the globe. Proponents of such tests argue that they provide vital information about school, teacher and pupil performance, which can then be used to hold educational institutions and their staff to account (Figlio & Loeb, Citation2011). Yet a concern held by many is that these tests may be having a severe negative effect upon the wellbeing and socio-emotional development of children (UK Education Select Committee, Citation2020). Although this is most often associated with those in their mid-to-late teens as they approach their end-of-school exams, it is claimed that the same holds true for national tests held during primary school (Hutchings, Citation2015). Nowhere is this more apparent than in England, with stories regularly appearing in the media about how the ‘stress of SATs [Key Stage 2 tests] gives children nightmares’ (Ward, Citation2018). Such notions have also been supported by some qualitative research or small-scale survey data, with quotes from parents, pupils and teachers used to illustrate the negative impact these tests are having upon children in primary school.
But is this really true? Existing evidence linking national tests (and, in particular, the Key Stage 2 tests) to lower levels of pupil wellbeing have been limited by the fact that most are of a qualitative nature, tend to rely upon small convenience samples and – critically – do not draw comparisons to a meaningful control group. For instance, do children become much happier once the Key Stage 2 tests are over, and are young people elsewhere in the UK (where the Key Stage 2 tests do not take place) happier and more self-confident than their peers in England? Addressing such issues is important in order to better understand the pros and cons of holding high-stakes national tests at the end of primary school, guiding key education policy issues such as whether the Key Stage 2 tests should be scrapped.
This paper has investigated such issues, presenting new evidence on the link between Key Stage 2 tests held annually in England and primary school children’s socio-emotional outcomes. Running against conventional wisdom – and the main thrust of previous research – little evidence is found that the Key Stage 2 tests in England are associated with lower levels of mental wellbeing, happiness, self-esteem or school enjoyment amongst its primary pupils. In particular, there is no sign children from other parts of the UK (where Key Stage 2 tests are not hold) have significantly better outcomes on these measures, or that there is any meaningful systematic variation around the time of the Key Stage 2 test date. Similarly, there is no evidence that pupils who report higher levels of wellbeing in the build-up to the Key Stage 2 tests then go on to perform any better in these tests. These null effects are robust to different analytic approaches and various robustness tests. The central conclusion of this paper is hence that the Key Stage 2 tests do not seem to be negatively associated with children’s socio-emotional outcomes. Similarly, there is no evidence that pupils who are happier or more self-confident in the build-up to the Key Stage 2 tests achieve higher scores.
These findings should be interpreted in light of the limitations of the research. Four issues particularly stand out. First, estimates refer to associations between different aspects of children’s wellbeing around the time of the Key Stage 2 tests. Although a range of possible confounders have been controlled, the estimates may not capture cause and effect. Second, although the MCS contains a wide array of measures, it has not asked children directly about test anxiety or whether they feel under pressure due to the Key Stage 2 tests. Yet, as pointed out by an anonymous referee, this could equally be interpreted as a strength of this paper, with the more ‘neutral’ measures used in this study being particularly well suited to capturing the potential effects of the Key Stage 2 tests on pupils’ general wellbeing. Third, comparisons have been drawn between England and the rest of the UK, noting how in the latter Key Stage 2 tests do not take place. Yet this does not necessarily mean that children are not tested at all; rather, it may just be done somewhat less formally. Fourth, the data we analyse were collected in 2012, with a number of reforms made to national assessments in England over recent years. Although this is unlikely to undermine the key findings, a stronger relationship between Key Stage 2 tests and pupil wellbeing could be found if the importance attached to these tests has increased. Fifth, the findings are clearly only applicable to primary school children, with results not necessarily generalisable to pupils of older ages. Finally, although the empirical findings suggest that a negative association does not exist in the population, it is possible that there are (potentially small) sub-groups of pupils who do experience well-being issues due to the Key Stage 2 tests. Unfortunately, considering heterogeneity between sub-groups has not been possible in the analysis due to the limited sample size.
It is also important to consider why results from this paper are in stark contrast to most of the existing literature. One possibility is that, rather than seeing Key Stage 2 tests as threatening, some children may respond positively to them as a challenge. This is consistent with our finding that children’s enjoyment of school is not negatively affected by the approach of the Key Stage 2 tests – at least not on average, at population level. Hence one possible explanation for our null findings is that the Key Stage 2 tests may have heterogeneous effects – positive for some groups, but negatives for others – which end-up cancelling one another out. Indeed, much of the previous work in this area (and subsequent media attention) has tended to focus upon the downsides of the Key Stage 2 tests, while ignoring the potential positives. Alternatively, the wellbeing of the average Year 6 pupil may not be affected by the Key Stage 2 tests because they simply do not feel them to be particularly high-stakes, as there is little consequence for them personally from the results. Relatedly, given the lack of individual consequences, pupils may not feel pressure about these tests from their parents. From a policy point of view, this is particularly important when one considers the likely counterfactual to Key Stage 2 tests if they were to be scrapped (as some policymakers have suggested). Children may not feel any more or less pressurised by Key Stage 2 tests than the likely alternatives, such as tests set by their class teacher, greater use of teacher assessment or more emphasis being placed upon end-of-year school reports. On the other hand, it seems unlikely that the difference between results in this paper and the conventional wisdom is due to our focus upon more general measures of wellbeing. Specifically, even for a more domain-specific measure (school enjoyment) we continue to find largely null effects. It hence seems improbable that the findings reported here are due to a lack of spillover between how Key Stage 2 tests affects children’s attitudes and feelings about school and their general wellbeing overall.
In addition, there are also some important methodological differences between this study and previous work. For instance, the data used in the present study are drawn from a large, nationally representative cohort study, with children answering questions about their happiness and wellbeing in the context of a much broader social survey. This is rather different from previous work, which typically either involved qualitative interviews or a survey focused specifically upon experiences of Key Stage 2 tests. Relatedly, this study is one of the first to consider the counterfactual and to try to draw comparisons to a meaningful control group. Hence, although previous research has suggested that children in England may be unhappy around the time of the Key Stage 2 tests, few have presented any evidence that children would be better off had the Key Stage 2 tests not taken place. A third issue is that some of the studies within the literature (e.g. Hutchings, Citation2015) have had ‘industry’ involvement (e.g. teaching unions have sponsored the study) with there being potential conflicts of interest and agendas to promote. Indeed, this plays into a broader concern with this literature – that teachers and the wider education community generally dislike the Key Stage 2 tests and how they are now used for school accountability – with many wanting them to be scrapped. Cynically, being able to point towards research evidence illustrating how the Key Stage 2 tests harm children’s wellbeing is useful to support this narrative. Finally, there is the issue of publication bias, with it well-known that null results are less likely to be reported and subsequently published (Jerrim & De Vries, Citation2015). This may, in turn, have led to an overly negative view of the link between Key Stage 2 tests and children’s socio-emotional outcomes emerging in the literature, with it possible that many other null findings in this area having simply not been written up.
What do the results then suggest for education policy in England? Given the results of this paper, and considering the findings of the wider literature, evidence on substantial negative effects of Key Stage 2 tests upon pupils simply does not seem strong enough to support calls for these tests to be scrapped. Yet, at the same time, there is also a dearth of hard evidence that Key Stage 2 tests have substantial benefits for pupil’s learning and academic development. Thus, given the fundamental role that Key Stage 2 tests currently play in England (feeding into both primary and secondary school accountability metrics), they should continue for the foreseeable future in their current form. However, further high-quality research needs to be conducted to better understand both the positive and negative effects that such tests have upon young people. This includes work which seeks to identify particular sub-groups which may suffer from negative wellbeing effects, as well as those who may respond more positively. This will help teachers, policymakers and the broader education community to better understand the trade-offs such testing involves, and whether such policy advice should change in the future.
Disclosure Statement
No potential conflict of interest was reported by the author(s).
Additional information
Funding
Notes on contributors
John Jerrim
John Jerrim is a professor of education and social statistics at the UCL Social Research Institute.
Notes
1. Results for model M2 is an exception, where the parameter sits on the boundary of statistical significance at the five percent level.
References
- Allen, R., Burgess, S., & McKenna, L. 2014. School performance and parental choice of school: Secondary data analysis. Department for Education Research Report. Department for Education, London: England. Accessed 13/Apr/2020 from https://assets.publishing.service.gov.uk/government/uploads/system/uploads/attachment_data/file/275938/RR310_-_School_performance_and_parental_choice_of_school.pdf
- Amato, P., & Keith, B. (1991). Parental divorce and the well-being of children: A meta-analysis. Psychological Bulletin, 110(1), 26–46. https://doi.org/https://doi.org/10.1037/0033-2909.110.1.26.
- Amoako, I., Quainoo, E., & Adams, F. (2019). High-stakes test accountability: A controversial issue in educational measurement. International Journal of Latest Research in Humanities and Social Science, 2(10), 94–96.
- Amrein, A., & Berliner, D. 2003. The effects of high-stakes testing on student motivation and learning. A research report. Educational Leadership 32–38. Accessed 13/Apr/2020 from https://people.wou.edu/~girodm/611/testing_and_motivation.pdf
- Berliner, D. (2011). Rational responses to high stakes testing: The case of curriculum narrowing and the harm that follows. Cambridge Journal of Education, 41(3), 287–302. https://doi.org/https://doi.org/10.1080/0305764X.2011.607151.
- Bew, P. 2011. Independent review of Key Stage 2 testing, assessment and accountability: final report (consultation documents, call for evidence and progress reports). Department for Education, London: UK. Accessed 13/Apr/2020 from https://dera.ioe.ac.uk/3729/
- Bitler, M., Corcoran, S., Domina, T., & Penner, E. 2019. Teacher effects on student achievement and height: A cautionary tale. NBER Working Paper No. 26480.
- Bradbury, A. 2019. Pressure, anxiety and collateral damage. The headteachers’ verdict on SATS. More Than a Score research report. Accessed 13/Apr/2020 from https://www.morethanascore.org.uk/wp-content/uploads/2019/09/SATs-research.pdf
- Cho, E., & Chan, T. (2020). Children’s wellbeing in a high-stakes testing environment: The case of Hong Kong. Children and Youth Services Review, 109(1), 104694. https://doi.org/10.1016/j.childyouth.2019.104694
- Connor, M. (2001). Pupil stress and standard assessment tasks. Emotional and Behavioural Difficulties, 6(2), 103–111. https://doi.org/https://doi.org/10.1080/13632750100507660
- Connor, M. (2003). Pupil stress and standard assessment tasks (SATs) an update. Emotional and Behavioural Difficulties, 8(2), 101–107. https://doi.org/https://doi.org/10.1080/13632750300507010
- Connors, L., Putwain, D., Woods, K., & Nicholson, L. 2009. Paper 3: Causes and consequences of test anxiety in key stage 2 pupils: The mediational role of emotional resilience. British Educational Research Association Conference 2nd – 5th September 2009. University of Manchester. Accessed 21/Apr/2020 from http://www.leeds.ac.uk/educol/documents/184268.pdf
- Education Committee, 2020. High-stakes testing harming teaching and learning in primary schools. UK Parliament. Accessed 13/Apr/2020 from https://www.parliament.uk/business/committees/committees-a-z/commons-select/education-committee/news-parliament-2015/primary-assessment-report-published-16-17/
- Figlio, D., & Loeb, S. (2011). School Accountability. In E. A. Hanushek, S. Machin, & L. Woessmann (Eds.), Handbooks in Economics (Vol. 3, pp. 383–421). North-Holland.
- Frith, E. 2017. Social media and children’s mental health: A review of the evidence. Education Policy Institute. Education Policy Institute. Accessed 13/Apr/2020 from https://epi.org.uk/wp-content/uploads/2018/01/Social-Media_Mental-Health_EPI-Report.pdf
- Gottschalk, M. G., & Domschke, K. (2017). Genetics of generalized anxiety disorder and related traits. Dialogues in Clinical Neuroscience, 19(2), 159–168. doi:https://doi.org/10.31887/DCNS.2017.19.2/kdomschke
- Howard, E. 2020. A review of the literature concerning anxiety for educational assessments. Ofqual Research Report. Ofqual, Coventry. Accessed 13/Apr/2020 from https://assets.publishing.service.gov.uk/government/uploads/system/uploads/attachment_data/file/865832/A_review_of_the_literature_concerning_anxiety_for_educational_assessment.pdf
- Hutchings, M. 2015. Exam factories? The impact of accountability measures on children and young people. Report for the National Union of Teachers. National education Union. Accessed 21/Apr/2020 from https://www.basw.co.uk/system/files/resources/basw_112157-4_0.pdf
- Jerrim, J., & De Vries, R. (2015). The limitations of quantitative social science for informing public policy. Evidence & Policy: A Journal of Research, Debate and Practice, 13(1), 117–133. https://doi.org/https://doi.org/10.1332/174426415X14431000856662
- Minarechová, M. (2012). Negative impacts of high-stakes testing. Journal of Pedagogy, 3(1), 82–100. https://doi.org/https://doi.org/10.2478/v10159-012-0004-x
- NHS Digital. 2018. Mental health of children and young people in England, 2017. NHS digital. Accessed 13/Apr/2020 from https://digital.nhs.uk/data-and-information/publications/statistical/mental-health-of-children-and-young-people-in-england/2017/2017
- Plewis, I. 2004. Millennium cohort study first survey: Technical report on sampling. Centre for Longitudinal Studies (CLS), London. Accessed 16/Jun/2017 from file:///C:/Users/john/Downloads/MCS1_Technical_Report_on_Sampling_June_2004%20(3).pdf
- Putwain, D., Connors, L., Woods, K., & Nicholson, L. (2012). Stress and anxiety surrounding forthcoming Standard Assessment Tests in English schoolchildren. Pastoral Care in Education, 30(4), 289–302. https://doi.org/https://doi.org/10.1080/02643944.2012.688063
- Putwain, D., & Von Der Embse, N. (2018). Teachers use of fear appeals and timing reminders prior to high-stakes examinations: Pressure from above, below, and within. Social Psychology of Education, 21(5), 1001–1019. https://doi.org/https://doi.org/10.1007/s11218-018-9448-8
- Reay, D., & Wiliam, D. (1999). I’ll be a nothing structure, agency and the construction of identity through assessment. British Educational Research Journal, 25(3), 343–354. https://doi.org/https://doi.org/10.1080/0141192990250305
- Run, T. S. 2020. What are SATs results used for? Times Educational Supplement. Accessed 13/Apr/2020 from https://www.theschoolrun.com/what-are-sats-results-for
- Ward, H. 2018. Stress of SATs gives children nightmares. Times Educational Supplement 9th July 2018. Accessed 13/Apr/2020 from https://www.tes.com/news/stress-sats-gives-children-nightmares
- Weale, S. 2017. More primary school children suffering stress from SATs, survey finds. The Guardian Monday 1st May 2017. Guardian. Accessed 13/Apr/2020 https://www.theguardian.com/education/2017/may/01/sats-primary-school-children-suffering-stress-exam-time
- Webb, R., & Vulliamy, G. (2006). Coming full circle? The impact of new labour’s education policies on primary school teachers’ work. The Association of Teachers and Lecturers.
- Wyse, D., & Torrance, H. (2009). The development and consequences of national curriculum assessment for primary education in England. Educational Research, 51(2), 213–228. https://doi.org/https://doi.org/10.1080/00131880902891479
Appendixes
Figure A. Variation in socio-emotional outcomes around the Key Stage 2 test date. Pupils in England compared to the rest of the UK. Raw unconditional estimates (not smoothed)
Appendix B.
Alternative estimates excluding Northern Ireland from the ‘rest of UK’ sample
Table B1. Socio-emotional outcomes prior to key stage 2 tests. Differences between children in England and the rest of the UK
Figure B1. Variation in socio-emotional outcomes around the Key Stage 2 test date. Pupils in England compared to the rest of the UK. Wellbeing; (b) Self-esteem; (c)Happiness; (d) School enjoyment
Figure B2. Differences in socio-emotional outcomes between England and the rest of the UK around the Key Stage 2 test week. Conditional estimates. (a) Wellbeing; (b) Self-esteem; (c)Happiness; (d) School enjoyment
Appendix C.
Alternative estimates narrowing the window before the Key Stage 2 tests
Table C1. Socio-emotional outcomes prior to Key Stage 2 tests. Differences between children in England and the rest of the UK
Table C2. The link between children’s socio-emotional state prior to the key stage 2 tests and their mathematics test scores
Appendix D.
Alternative estimates extending the test window
Table D1. Socio-emotional outcomes prior to Key Stage 2 tests. Differences between children in England and the rest of the UK
Table D2. The link between children’s socio-emotional state prior to the Key Stage 2 tests and their mathematics test scores
Appendix E.
Item-level estimates
Table E1. Socio-emotional outcomes prior to Key Stage 2 tests. Differences between children in England and the rest of the UK
Table E2. The link between children’s socio-emotional state prior to the Key Stage 2 tests and their mathematics test scores
Figure E1. Variation in socio-emotional outcomes around the Key Stage 2 test date. Pupils in England compared to the rest of the UK
Figure E1. continue
Figure E1. continue
Figure E1. continue
Figure E2. Differences in socio-emotional outcomes between England and the rest of the UK around the Key Stage 2 test week. Conditional estimates
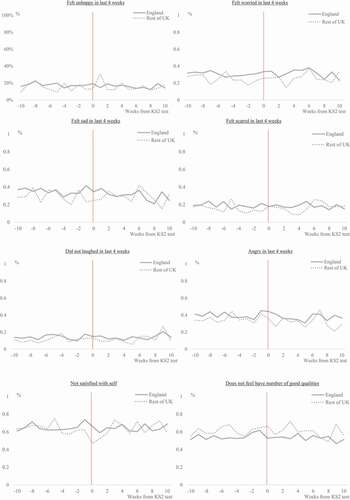
Figure E2. continue
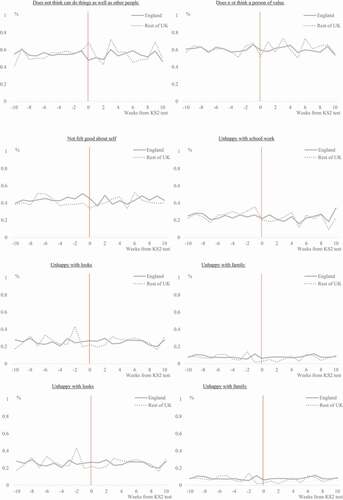
Figure E2. continue
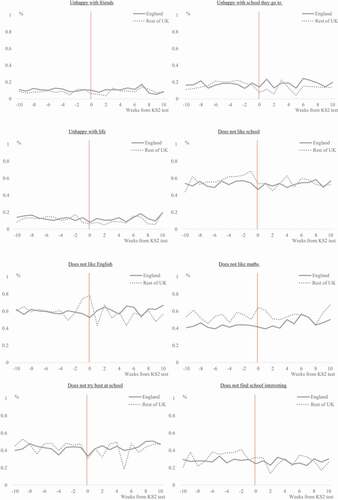
Figure E2. continue