
Abstract
A study was conducted to assess genetic heterogeneity among 14 chicken populations using 16 microsatellite markers. All the microsatellite loci except MCW048 were polymorphic. The number of alleles varied from 2 to 6. The polymorphic information content of the microsatellite markers varied from 0.21 to 0.87. The average observed number of alleles across the microsatellites varied from 3 to 3.8, while effective number of alleles varied from 1.9 to 3.0. The average observed and expected heterozygosities were in the range of 0.3–0.6 and 0.4–0.6, respectively. The markers, MCW049, MCW044, MCW041, ADL176, MCW059, ADL136 and MCW110 showed heterozygosity excess and ADL158, MCW043, ADL102, MCW014, ADL023, ADL210 and MCW007 markers revealed heterozygosity deficiency in the populations. The genetic distance between layer and broiler lines was found to be high ranging from 0.22 to 0.38. The Indigenous populations were more closely related to broiler lines than layer ones. In conclusion, it is stated that Indigenous, broiler and layer chicken populations were heterogeneous in nature and Indigenous chicken populations were distantly related from the broiler and layer chicken populations.
1. Introduction
Poultry has been domesticated for thousands of years and consequently many genetic changes have been made by the poultry growers through natural breeding among better birds. Several changes have been occurred in poultry farming right from backyard poultry to intensive poultry. Today poultry sector has been one of the most promising industries among different livestock sectors. It is known that all populations of domesticated chickens descended from a single ancestor, the Red Jungle Fowl (RJF), which is originated from Southeast Asia. All the chicken breeds and lines developed across the globe were developed from RJF through crossing and long-term selection. These breeds or lines are phenotypically and performance-wise distinct. Consequently, commercial breeding initiated in twentieth century has created the significant loss of genetic diversity and consequently, few highly specialized pure lines are available today. Many breeds evolved from domestication for centuries are now at the risk of being lost or extinct on account of cross-breeding and lack of attention. These breeds may, however, represent a resource of genes for future breeding and research. Therefore, it is utmost important to assess the diversity of various chicken populations at molecular level in order to conserve threatened populations as well as to use them in future breeding programme.
Recent advancement in molecular biology has provided new opportunities to assess genetic variability at DNA level, which can be of immense use in measuring heterogeneity among populations. Several markers are available to estimate genetic heterogeneity of which microsatellite markers are widely used as they are abundant in the population, distributed randomly in the genome, highly polymorphic and co-dominancy in nature (Groen et al. Citation1994; Karaca et al. Citation1999). Microsatellite markers have also been used as suitable tool for linkage mapping, identification of quantitative trait loci, parentage determination, etc. (Bruford & Wayne Citation1993). Crooijmans et al. (Citation1996) and Ponsuksili et al. (Citation1996) suggested usefulness of microsatellites in estimation of genetic relatedness and diversity in chickens. Approximately 500 fluorescently labelled primers for microsatellite analysis in chickens have already been described and are commercially available in the form of mapping kits (Cheng et al. Citation1998). The microsatellites were developed and mapped by the East-Lansing group, Chickmap (Roslin Institute) and Wageningen Agricultural University (Crooijmans et al. Citation1993; Cheng & Crittenden Citation1994). Some studies have been conducted in native Japanese chicken breeds to estimate diversity among Japanese breeds (Tadano et al. Citation2007). Keeping these facts in mind, the present study was designed with the objective to assess genetic heterogeneity among 14 chicken lines using 16 microsatellite markers.
2. Material and methods
2.1. Population
A total of 14 chicken populations namely IWH, IWI, IWK and layer control (layer lines), PB-1, PB-2, broiler control, Naked neck and Dwarf (broiler lines), PD-1, PD-2 and PD-3 (rural variety), PD-4 and PD-5 (Indigenous chicken) maintained at the Directorate were used for the present study. A total of 60 birds (30 male and 30 female) from each population were taken randomly for the present study.
2.2. Collection and isolation
Blood samples are collected aseptically from all the birds under study. Genomic DNA was isolated from blood samples following phenol-chloroform extraction method. DNA concentration was quantified by spectrophotometric method at optical density 260: 280. The high-quality genomic DNA was used for further study.
2.3. Microsatellites
A total of 16 microsatellite markers namely, MCW049, MCW044, MCW041, ADL176, MCW059, ADL136, MCW110, ADL020, ADL158, MCW043, ADL102, MCW014, ADL023, ADL210 and MCW007 were used for the present study. These microsatellites were evenly distributed across different chromosomes ().
Table 1. Microsatellite information and amplification conditions used for analyzing individual sample.
2.4. PCR amplification and genotyping
The PCR reaction was composed of 50 µg of DNA template, 10 ng of each primer, 1.5 mM of MgCl2, 100 µM of each dNTP, 1X assay buffer and 0.25 U of Taq DNA polymerase (MBI Fermentas). The polymerase chain reaction (PCR) programme for optimal amplification was initial denaturation at 94°C for 5 minutes, 30 cycles of denaturation at 94°C for 30 seconds, annealing at specific temperature for particular microsatellite (mentioned at ) for 30 seconds and extension at 72°C for 30 seconds with a final extension at 72°C for 10 minutes. Amplified products were electrophoresed at 4°C on 8% non-denaturing polyacrylamide gel electrophoresis containing acrylamide and bis-acrylamide (29:1). The gel was run at 250 V for 4 h in 1XTBE and stained with 0.1% silver nitrate following standard protocol (Bhattacharya et al. Citation2007). The gel was visualized and documented under white light in the gel documentation system.
The genotype of each bird was performed manually from the gel. Allele size was determined by comparison with standard ladder DNA using Quantity one software (Biorad Laboratories, USA).
2.5. Statistical analysis
Frequencies of alleles were estimated in the population by gene counting method. The polymorphic information content (PIC) was calculated with allele frequencies using following formula stated by Botstein et al. (Citation1980):
where xi and xj are the frequencies of ith and jth alleles.
Heterozygosity was calculated following the standard formula. Popgene1.31 was used to obtain genetic parameters including observed and expected heterozygosity, observed and effective number of alleles, Shanon's information index, Wright's fixation index and Nei's genetic distance (Nei Citation1972).
3. Results and discussion
3.1. Alleles
All the microsatellite markers except MCW048 were found to be polymorphic with presence of more than 1 allele (). In MCW049 microsatellite marker, a total of 6 alleles having size of 112, 118, 120, 122, 124 and 126 bp were found across the chicken lines. In MCW044 microsatellite, two alleles with size of 140 and 146 bp were obtained. In MCW043 marker, four alleles having size of 126, 134, 140 and 148 bp were found whereas in ADL176 marker, alleles of 184, 192, 194, 196, 202 and 212 bp were determined. In ADL023 marker, five alleles, namely, 164, 168, 172, 180 and 188 bp were observed across the population. In ADL158, MCW059 and ADL210 four alleles were found whereas in ADL136 and MCW110 markers, six alleles were determined across the lines. In ADL102 microsatellite, five alleles, namely, 96, 102, 106, 114 and 118 bp were observed. Similarly, MCW014 and ADL020 microsatellite revealed five alleles in different chicken lines. In MCW041 marker, three alleles, namely, 152, 164 and 172 bp were found whereas in MCW007 microsatellite, 300 and 330 bp alleles were detected across the chicken population. The number of alleles was found to be varied from 2 to 6 across the population while average number of alleles was 4.4 per microsatellite. Our results were in agreement with the findings of Marle-Koster and Nei (Citation2000) where they reported 2.3–4.3 alleles in Koekoek and Mozambique lines of chicken. Groen et al. (Citation1994) also revealed similar trend of allele numbers in broiler and layer varieties. The higher average numbers of alleles (5.9) were reported by Muchadeyi et al. (Citation2005), which could be attributed to the evaluation of more number of populations with different microsatellite markers. Our findings of moderate number of alleles may be due to higher homogeneity of the populations, which were rather close populations for several generations.
3.2. Marker informativeness
The marker informativeness of the microsatellite was estimated in terms of PIC of the loci. The PIC of any marker reveals the strength and stringency of polymorphism expressed by the marker itself over the distribution of alleles in the population. In the present study, the PIC of microsatellite marker varied from 0.21 to 0.94. The lowest (0.21) PIC was observed in MCW044 marker whereas ADL176 marker revealed highest (0.94) magnitude of the estimate. More than 50% PIC value was found in ADL020, MCW014, ADL102, MCW110, ADL136, ADL210, MCW059, ADL158, ADL023, ADL176, MCW043 and MCW049 microsatellite markers. The lower magnitude of PIC was found in MCW007 and MCW044 markers (). Muchadeyi et al. (Citation2005) revealed PIC estimate with an average of 0.55 which was in agreement with our findings. More than 0.5 PIC is desirable for microsatellite markers for better efficiency of marker in analyzing genetic diversity among populations.
3.3. Genetic diversity
The observed number of allele (Na) across the microsatellite markers was more than 3 in all the 14 chicken populations. The highest (3.8) number of alleles was found in PB-1 and PD-4 lines whereas the lowest (3.1) number of alleles was observed in IWI line. The effective number of alleles was found to be highest (3.5) in PD-2 line whereas the lowest (1.9) effective allele number was determined in IWH line. Overall, the effective number of alleles was less than the observed number of alleles. The heterozygosity was estimated to be the highest (0.6) in PD-1 and PD-3 lines while PB-2 and IWK line revealed the lowest (0.3) heterozygosity. Overall, the heterozygosity across the population varied from 0.3 to 0.6 (). About 50% or more observed heterozygosity was found in PD-1, PD-2, PD-3, PD-4, PD-5 and NN population, which revealed the heterogeneity of the populations. More than 40% heterozygosity was found in all the populations except IWK and PB-2 lines. The effective heterozygosity estimate varied from 0.4 to 0.6. The highest effective heterozygosity was observed in PD-4 and PD-5 lines whereas the lowest estimate was detected in IWH, IWI, PB-2 and control broiler line. The observed as well as effective heterozygosity were more or less very close together, which indicates the efficiency of the marker used in the study and random distribution of alleles in the populations. Our results were in agreement to the findings of Tadano et al. (Citation2007) where observed and effective heterozygosity varied from 0.27 (Koeyoshi line) to 0.52 (Shoukoku line) and from 0.29 (Koeyoshi line) to 0.54 (Satsumadori line), respectively. It is desirable to have more or less same magnitude of observed and effective heterozygosity indicating efficiency of the marker and accuracy of diversity estimate. The diversity of the population was also estimated by Wright's fixation index (FIS), which reveals the measure of heterozygosity excess or deficiency of marker present in the population. The heterozygosity excess was found in MCW049, MCW044, MCW041, ADL176, MCW059, ADL136, MCW110 and ADL020 microsatellite markers. The estimate of heterozygosity excess varied from 0.02 (ADL020) to 0.9 (ADL136). The heterozygosity deficiency was found in ADL158, MCW043, ADL102, MCW014, ADL023, ADL210 and MCW007 markers. The estimates of heterozygosity deficiency varied from –0.05 to –0.93 (). Both heterozygosty estimates and Wright's fixation index commensurate the heterohgeneity of the population in terms of allelic distribution. All the population analyzed here was non-inbred and alleles segregated randomly without having any bias towards specific alleles although some alleles were novel having frequency of less than 0.01.
Table 2. Genetic heterogeneity estimates in different chicken populations estimated from microsatellite analysis.
Table 3. Wright's fixation index across the populations.
3.4. Genetic distance and phylogenetic relationship
The genetic distance among 14 different lines was presented in . The least distance (0.04) was found between PB-1 with PB-2 and PB-1 with control broiler line. The highest (0.56) genetic distance was observed between PD-3 and IWH lines. The distance among the layer lines varied from 0.07 to 0.12 whereas the distance among the broiler lines varied from 0.04 to 0.24 (Dwarf vs Naked neck). The distance between layer and broiler lines varied from 0.22 to 039 (Dwarf vs IWI). The distance between native chicken lines (PD-4 vs PD-5) was 0.06. The distance between native chicken and layer lines was higher than that from broiler lines. The genetic distance among the rural germplasm varied from 0.14 (PD-1 vs PD2) to 0.36 (PD-1 vs PD3).
Table 4. Nei's genetic identity and distance estimates among different chicken lines.
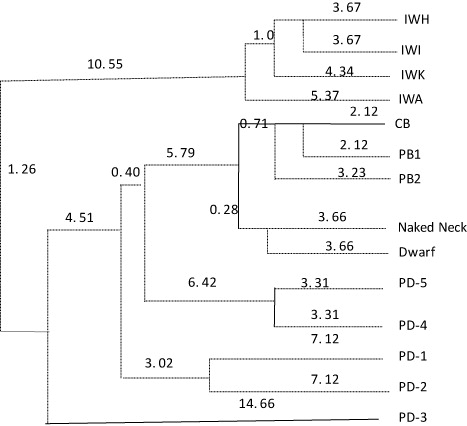
The Nei's genetic distances were used to prepare dendogram tree to delineate phylogenetic relationship among populations. All the layer lines formed a single cluster whereas broiler lines formed separate cluster (). PD-4 and PD-5 lines formed another cluster whereas rural germplasm particularly, PD-1 and PD2 formed single cluster. However, PD-3 line was relatively more distant from PD-1 and PD-2 lines. The native germplasms were more closely related to broiler lines as compared to layer lines. Likewise, rural germplasm was more closely related to broiler lines as compared to layer lines. The rural and native germplasms were very closely structured. The most distantly related lines were PD-3 and IWH. The present study of diversity analysis suggests that microsatellite markers can be judiciously used to unravel genomic structure of the population, although they are close population with having certain degree of homogeneity. The study revealed that microsatellite delineated underlined variability of the population in terms of repeat sequences, which mainly occupies the most of the genomic content embedded in the individual.
4. Conclusion
We conclude that Indigenous, broiler and layer chicken populations were heterogeneous in nature and Indigenous chicken populations were distantly related from the broiler and layer chicken populations. The layer lines were also divergently related to the broiler lines, which were estimated by analyzing microsatellite markers.
References
- Bhattacharya TK, Rani S, Maiti SK, Dayal S, Kumar P, Sharma A. 2007. Polymorphism of ZuBeCa3 microsatellite and its association with mammary tumor in dogs. Int J Immunogenetics. 33:161–165. 10.1111/j.1744-313x.2007.00639.x
- Botstein DR, White RL, Skolnick M, Davis RW. 1980. Construction of a genetic linkage map in man using restriction fragment length polymorphisms. Am J Human Genetics. 32:314–331.
- Bruford MW, Wayne RK. 1993. Microsatellites and their application to population genetic studies. Curr Opin Genet Dev. 3:939–943. 10.1016/0959-437X(93)90017-J
- Cheng HH, Burt DW, Dodgson JB. 1998. Recent advances in poultry genome mapping. In: Proceedings of Symposium Series 1 of the 8th World Conference on Animal Production; 1998 June 28–July 4; Seoul (Korea): Seoul National University; p. 168–178.
- Cheng HH, Crittenden LB. 1994. Microsatellite markers for genetic mapping in the chicken. Poult Sci. 73:539–546.10.3382/ps.0730539
- Crooijmans RPMA, Van Kampen AJA, Van Der Poel JJ, Groenen MAM. 1993. Highly polymorphic microsatellite markers in poultry. Anim Genet. 24:441–443.10.1111/j.1365-2052.1993.tb00360.x
- Crooijmans RPMA, Van Oers PAM, Strijk JA, Van Der Poel JJ, Groenen MAM. 1996. Preliminary linkage map of the chicken (Gallus domesticus) genome based on microsatellite markers: 77 new markers mapped. Poult Sci. 75:746–754.10.3382/ps.0750746
- Groen AF, Crooijmas RPMA, Van Kampen AJA, Van Der Beek S, Van Der Poel JJ, Groenen MAM. 1994. Microsatellite polymorphism in commercial broilers and layers. In: Proceedings of 5th World Symposium on Genetics and Applied Livestock Production; 1994 August 7–12; Guelph (Canada); p. 94–97.
- Karaca M, Karaca FG, Patel C, Emara MG. 1999. Preliminary analysis of microsatellite loci in commercial broiler chickens. In: Plant and Animal Genome VII Conference; 1999 January 17–21; San Diego (CA); p. 300.
- Marle-Koster EVM, Nei ELH. 2000. Genetic characterization of native Southern African chicken population: evaluation and selection of polymorphic microsatellite markers. South Afr J Anim Sci. 30:1–6.
- Muchadeyi FC, Weigend S, Gondwe TN, Wollny CBA. 2005. Determination of genetic structure of Malawi local chickens using microsatellite markers. In: Proceedings of Symposium on Role of Biotechnology; 2005 March 5–7; Turin (Italy); p. 215–216.
- Nei M. 1972. Genetic distance between populations. Am Nat. 106:283–292. 10.1086/282771
- Ponsuksili S, Wimmers K, Horst P. 1996. Genetic variability in chickens using polymorphic microsatellite markers. Thai J Agric Sci. 29:571–580.
- Tadano R, Sekino M, Nishibori M, Tsudzuki M. 2007. Microsatellite marker analysis for the genetic relationships among Japanese long-tailed chicken breeds. Poult Sci. 86:460–469. 10.1093/ps/86.3.460