
Abstract
Livestock is one of the fastest-growing sectors in agriculture. If carefully managed, they have potential opportunities for economic growth and poverty reduction in rural areas. South Asian countries, i.e. Afghanistan, Bangladesh, India, Nepal, Pakistan and Sri Lanka, are home to more than 1.58 billion people, having a large majority living in poverty and rearing livestock. In this paper, we compare the demand of livestock meat, i.e. beef, mutton and poultry, for 2030 for the six South Asian countries and analyse this demand with respect to three factors, i.e. (1) water scarcity (WS), (2) CO2 fertilization and (3) climatic-change vulnerability. We carry out the analysis using related data from diverse sources, which were extracted, transformed and integrated before usage. The collective impact of the three main factors had an overall positive effect on the production of meat for Sri Lanka but an adverse impact on Afghanistan. High similarity was found between CO2 fertilization and WS, i.e. higher than that between production of beef and mutton for the six countries considered. Overall, the three factors do not seem to be favourable for the six South Asian countries considered. This point lead to the possibility of a vegetarian predicted 2030, with poor livestock holders expected to remain poor.
1. Introduction
The demand for animal source foods in developing countries is growing rapidly, which is driven by population growth, increasing incomes and in some cases resulting in highly concentrated demand. This trend could continue till it reaches a point of saturation, i.e. a more prosperous population using a proportional or even increasing proportion of its growing income on animal source foods. Economists describe this as income elasticity. For example, in Nepal, income elasticity for meat is 0.798 and for fish is 0.909. This means that for every percentage point increase in income, expenditure on meat and fish will increase by 0.798% and 0.909%, respectively (USDA Citation1996). However, among demand, production and purchase there are many factors that can affect the delicate ecosystem negatively and/or positively. Although there are many studies discussing the impact of different factors such as CO2 fertilization, water scarcity (WS), etc. on meat production for South Asia, there are hardly any studies which address the issues that we have discussed for individual South Asian countries.
We know with a high degree of confidence that global population will continue to grow in the near term (more in South Asia) and that the fertility rates are projected to continue to decline, but the world’s population will increase from 6.8 billion to 8.3 billion by 2030. Consequently, it is expected that the demand for grain will continue to increase and a growing middle-class population desiring more animal source foods and dairy products. We also know that with the increase in population, requirement of extra agriculture land and growth in industry will result in the increase in demand for fresh water. Finally, we expect that the world’s climate will continue to change in ways that could impede food production and dislocate people (PI Citation2010). The objective of this paper is to know and analyse the impact of some of these factors such as (1) WS, (2) CO2 fertilization and (3) climatic-change vulnerability on the production of meat for six South Asian countries, i.e. Afghanistan, Bangladesh, India, Nepal, Pakistan and Sri Lanka in 2030. This being a data-intensive study, therefore, along with the traditional data analysis techniques we will also use data mining.
2. Materials and methods
Records on consumption and production of beef, mutton and poultry for 2000 and 2030 projection along with projected change in production of meat are given in different tables for 104 countries in the Food and Agriculture Organization (FAO) 2011 report (Robinson & Pozzi Citation2011) by considering the social and other differences. With such a large data-set, the change in production of meat for a region such as South Asia can get hidden, especially for small countries (in terms of area and population) such as Afghanistan and Nepal to name a few. Thus, it is necessary not only to closely analyse the data for six South Asian countries, i.e. Afghanistan, Bangladesh, India, Nepal, Pakistan and Sri Lanka, but to do so with respect to (w.r.t) different factors (among many) such as CO2 fertilization, climatic-change impacts and WS by extracting, transforming and integrating data from diverse sources. Because of the data-intensive nature of the problem, in this paper we will analyse the collective data, i.e. percentage change in meat production predicted from 2000 to 2030 w.r.t the three factors using traditional techniques as well as data mining.
To limit the scope of the study, and to keep the scope manageable, the data on pork (Robinson & Pozzi Citation2011) are ignored because for most of the countries considered in this paper pork is not consumed there. For the same scope-related reasons, data on eggs and milk are also not considered, milk cannot be compared with meat on weight basis, as milk is mostly water. Furthermore, as per FAO (Citation1992) ‘Milk is approximately 87% water, so it is a good source of water in the diet’. In Table 3 of Robinson and Pozzi’s (Citation2011) study, cattle, buffalo, sheep and goats (excluding camels) have been grouped under the category of ‘milk and dairy products’, for the aforementioned scope-related reasons we have neither addressed this category in this study nor pooled it with animal meat production which is covered in this study.
2.1. CO2 fertilization
According to Mintz (Citation2013), CO2 fertilization is the process when high CO2 levels enable a leaf during photosynthesis (where green plants convert sunlight into energy) to lose less water to the air or extract more carbon from the air or both. If every single leaf uses less water, then the plant will correspondingly respond by increasing its leaf production.
Climate change and variability affect thermal and hydrological systems, which consequently influence the structure and functionality of the ecosystems and human livelihoods. One can define a climate change scenario as a physically coherent set of changes in the meteorological variables, based on normally accepted projections of CO2 (and other trace gases) levels. Climate change scenarios developed by Fischer (Citation2009) using Agro-Ecological Zone family of crop models were used in order to estimate their effects on crop yields, extents of land cultivation potential, and the number and type of crop combinations that can be cultivated.
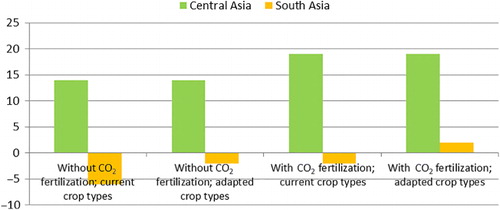
Fischer (Citation2009) has projected that in 2050 except for the Central Asian countries, the impact of climate change on wheat production will be generally negative for developing countries. In contrast, rain-fed wheat production capacity of current cultivated land in Oceania, Europe and Russia was projected to increase. The net global balance for 2050 was a projected reduction of production by 5–10%. More precisely, from (Fischer Citation2009) we can observe that even with CO2 fertilization for adopted crop types, the increase in production of cereals is South Asia will be just 2%, however, this being 14–19% in Central Asia without CO2 fertilization.
The CO2 fertilization results of (Fischer Citation2009) for 2050, however, do not directly help us because the level of detail is at the region level, i.e. South Asia instead of an individual South Asian country, which is the focus of this paper. Therefore, we need average country-level CO2 fertilization figures, which are then mapped to 2030/2050; how we do this is explained in the following paragraphs.
For CO2 fertilization at country level, we use the corresponding colour-coded image data (Mintz Citation2013) as shown in that cover the period from 1982 to 2010 and uses different colours to indicate the increase or reduction in leaf production. We proceed by determining the average CO2 fertilization for each South Asian country considered and then adjusting it w.r.t prediction for 2030 for the entire South Asian region.
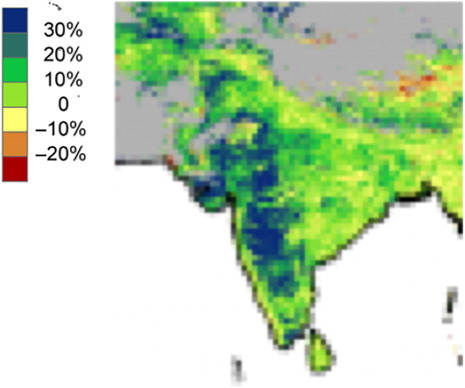
To get an average value of CO2 fertilization for each South Asian country considered, the best way is to determine the change in water use efficiency (WUE) for that country while assuming a universal change in CO2 concentration for the studied period using data available at Mauna Loa (Tans & Keeling Citation2012). Subsequently, the change in vapour pressure deficit for that country for the time-period being considered was calculated. However, pursuing this methodology is beyond the scope of this paper, especially because it is hard to figure out how the change in WUE is shared between assimilation and transpiration. Therefore, we performed online image processing of the satellite image for each South Asian country for the percentage amount that foliage cover has changed from 1982 to 2010 (); this was done using Image Color Summarizer available online at http://mkweb.bcgsc.ca/color_summarizer/? For density-based clustering supporting image processing, cognitive approach was adopted (Abdullah & Hussain Citation2014).
Since there was no reduction in leaf production for the six countries considered as indicated by red colour in , the red and green colours of the image were combined to create yellow colour, i.e. 0 to −10% CO2 fertilization. Subsequently, the average blue, green and yellow values of each country image were combined as per Equation (Equation1) to get an overall average CO2 fertilization for that country:
Table 1. Average CO2 fertilization for six South Asian countries for 2010.
2.2. Global climatic-change vulnerability
Climate change is never linked to any specific event but is considered to be an added effect, stress or change with positive or negative consequences. McKinnon et al. (Citation2010) have studied pre-existing characteristics of society that are known to be affected by climate change and mapped them to the level of vulnerability. Subsequently, they analysed the expected impacts as indicated by the effect that real or projected changes in the climate will have. The factors considered were (1) HEALTH IMPACT: additional mortality to climate sensitive diseases, (2) WEATHER DISASTERS: additional mortality and damage in storms, floods and wildfires, (3) HABITAT LOSS: additional loss of human habitat to rising seas, and degrading arid lands and (4) ECONOMIC STRESS: extra losses in the primary/agricultural sectors of the economy and to key natural resources. Some 50 countries were considered to be acutely vulnerable to climate change today, collectively suffering by most of all climate impacts. Afghanistan, Haiti, Myanmar, Sierra Leone and Somalia were proven to be the worst affected countries.
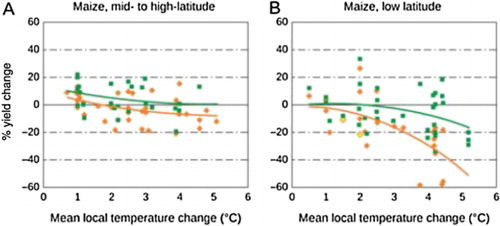
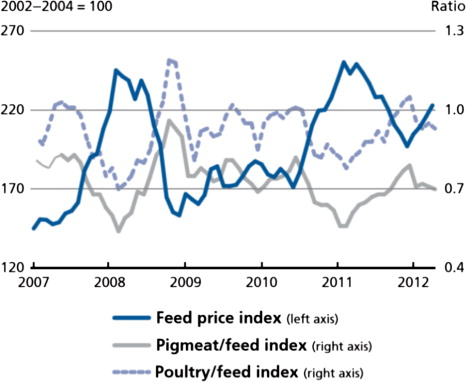
As per Vyas and Patel (Citation2011), ‘the vulnerability to climate change is systematically greater in developing countries like India-which are mostly located in lower, warmer latitudes. In these regions, cereal grain yields are projected to decline’. Hans-Joachim and Manderscheid (Citation2012) have studied model-based projections of overall climate change effects on future crop yields and found that it strongly depends on the integration of the direct CO2 fertilization effect. Using simulation models, it was established by Erda et al. (Citation2005) that if the direct effect of CO2 is included, average yields are projected to increase for rain-fed maize and decrease for irrigated maize in China. (Jayaraman Citation2011) shows the results of data-points derived from the results of 69 published studies at multiple simulation sites; this was done against mean local temperature which was changed as a proxy to indicate the magnitude of climate change in each study. The decline in the yield of maize with rising temprature especially in the low altitude regions is evident. In FAO (Citation2012), variable feed prices and price movements have been studied over a five-year period as shown in . From , a negative correlation between the two parameters can be observed, i.e. collectively a strong relationship between poultry feed yield, poultry feed price and poultry price.
In McKinnon et al.’s (Citation2010) study, the vulnerability due to climatic change is visually displayed for each country using four main factors. The impact of each of those factors is also represented using ordinal values such as Acute (11), Severe and High with finer gradation of + and – followed by Moderate and Low (1). We replaced the 11 ordinal values with interval-scaled numeric variables for each of the countries considered; subsequently, the average of the percentage changes was taken for each country, and the results of overall vulnerability index are shown in .
Table 2. Climatic-change vulnerability index for the six South Asian countries.
2.3. Water scarcity
As per the United Nations Water Scarcity Report (UNDESA Citation2005), WS is defined as the point at which the cumulative impact of all users infringes on the supply or quality of water under prevalent arrangements to the level that the demand by all segments, including the environment, cannot be fully satisfied (Doorenbos & Kassam Citation1979). Thus, WS is a relative concept and can occur at any degree of supply or demand. Scarcity may be a social concept (a product of prosperity, expectations and routine behaviour) or it may be the result of transformed supply patterns, for example, rooted in climate change. Hydrologists typically judge scarcity by considering the population–water equation. An area is considered water stressed, when annual water supplies drop below 1700 m3 per person. When annual water supplies drop below 1000 m3 per person, the population is considered to be water scarce, and below 500 m3 ‘absolute scarcity’ (UNDESA Citation2005). In this paper, we will use the WS figures based on Outlaw and Engelman’s (Citation1999) study.
2.4. Data mining
Data mining is an exploratory approach of knowledge discovery, where automatic browsing is performed using proven algorithmic techniques. Data mining can reveal previously unknown something that is non-trivial and valuable to the end user. Hence, in data mining we expect the unexpected. More formally, suppose we have N objects to be clustered and are denoted by Σ:
Σ={o1, …, oi, …, on}, where oi is the ith object. A partition δ breaks Σ into subsets or clusters {C1, C 2,…, Cm} satisfying the following: Ci ∩ Cj = ϕ where i ≠ j and C1 ∪ C2 ∪ … Cm = Σ
Thus, the act of dividing meaningful groups of objects that share common properties is called clustering, such that the objects in a group (or cluster) are similar to each other (in some sense) and dissimilar to objects in other groups or clusters. Clustering the similarity matrix corresponding to the records (or the attributes) of a database (or a data matrix) gives a global view of the data and is called one-way clustering. Density-based clustering can be one-way having a broad range of applications ranging from monitoring moving objects to stock trade analysis. Although several methods for efficient extraction of density-based clusters have been studied in the literature (Yang et al. Citation2011), however, the problem of matching and summarizing of such clusters with complex cluster structures and arbitrary shapes is still an unsolved problem (Abdullah & Hussain Citation2014).
2.5. Hierarchical clustering
Generally, all hierarchical clustering (HC) heuristics begin with n clusters, where n is the number of elements or records. Subsequently, the two most similar clusters are combined to form n – 1 clusters, i.e. first item is ranked. In the next iteration, n − 2 clusters are formed, i.e. two items ranked, following the same logic this process continues until we are left with only one cluster, i.e. all items ranked. In various HC heuristics, only the rules used to merge clusters differ. For example, in the ‘Simple Linkage’ approach, clusters are merged by finding the minimum distance between one observation in one cluster and another observation in the second cluster. In ‘Furthest Neighborhood’ approach, the farthest distance between two observations is taken, while in the ‘Average Linkage’ approach the average distance between observations belonging to each cluster is considered, subsequently merging them with a minimum average distance between all pairs of observations in the respective clusters.
There are a number of similarity measures used to calculate the pair-wise distance between the pairs of objects, some of those measures are Euclidean distance, Standardized Euclidean distance, Minkowski distance, Chebyshev distance, Mahalanobis distance, Hamming distance, Jaccard distance to name a few. For HC, we will use Hierarchical Clustering Explorer (HCE 3.5) available online at http://www.cs.umd.edu/hcil/multi-cluster/.
3. Results and discussion
In this section, we will first present and discuss the results using the algebraic approach, which will be followed by the data mining-based approach.
3.1. Algebraic approach
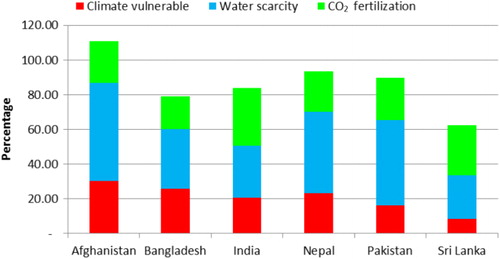
First, we did a collective comparison of the three factors considered in this paper for the six South Asian countries. The WS figures are from Outlaw and Engelman’s (Citation1999) study; CO2 fertilization figures are based on Mintz’s (Citation2013) and Fischer’s (Citation2009) studies; and global climatic-change vulnerability figures are based on McKinnon et al.’s (Citation2010) study. provides a comparison of the three factors for each of the six South Asian countries considered in this paper.
We start by exploring the meat consumption for the six South Asian countries for the individual meat, i.e. beef, mutton and poultry. First, we will compare the six South Asian countries considered based on the collective effect of percentage change in CO2 fertilization, WS and percentage vulnerability due to climatic change on the percentage change in meat production. The analysis will be first done using traditional algebraic techniques with results shown in histograms, followed by analysis using data mining.
Let us first consider WS. A direct relation exists between water consumed through transpiration and biomass production. A consequence of water stress and reduced transpiration is reduced biomass production that usually also reduces yields. In the FAO Irrigation and Drainage Paper (Doorenbos & Kassam Citation1979), the yield response to water approach linked a reduction in evapotranspiration to a proportional reduction in yield. Thus, a high WS is undesirable as it indicates weak prospects of crop for humans and fodder for animals (i.e. feed for poultry). Crop yield generally responds positively to increased atmospheric high CO2 fertilization, and according to Fischer (Citation2009), higher CO2 concentration indicates higher yields both for current and adapted crops. Thus, increase in yield of crops and corresponding fodder for animals (i.e. feed for poultry), is directly proportional to meat production. To calculate the climate change vulnerability, we consider four sub-factors (McKinnon et al. Citation2010) which are (1) health impact in 2030, (2) weather disasters 2030, (3) habitat loss 2030 and (4) economic stress 2030. None of these four factors has a positive effect on the production and actually results in loss of production. Therefore, we define the effective percentage change in production, i.e. EPCP as per Equation (Equation2):
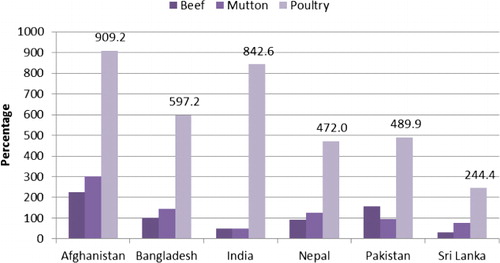
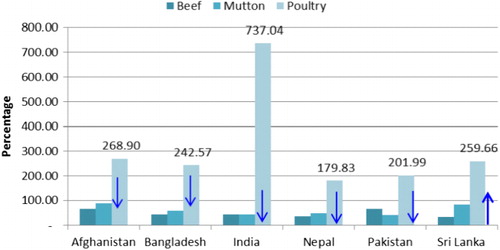
EPCP is effective percentage change in production with the three considered factors. For example, the percentage change in production of poultry for India without considering the three factors is projected to be 842.6% for 2030 (). However, when we look at this from the perspective of poultry feed, the prospects are not very bright. For example, as per FAO report on poultry feed (FAO Citation2014), ‘Practical poultry diets are formulated from a mixture of ingredients, including cereal grains, cereal by-products’. According to Ravindran (Citation2011), the main ingredient used in poultry feed is cereals (mainly maize), cereal by-products while wheat and sorghum are widely used in some parts of the world, also ‘Possible feed resources for the local birds raised in this system include: … iii) crop residues, fodders and water plants; and iv) by-products from local small industrial units {cereal by-products, etc.}’ (Ravindran Citation2013). According to Vyas and Patel (Citation2011), ‘the vulnerability to climate change is systematically greater in developing countries like India-which are mostly located in lower, warmer latitudes. In these regions, cereal grain yields are projected to decline’. Thus, the impact of climatic change on poultry feed cannot be ignored. Thus, with the three factors considered, the effective production of poultry for India is expected to decline to 737.04% ().
By comparing with , we can observe that there is more than 30% reduction in production of meat for Afghanistan in 2030 for the three factors considered; however, in the case of Sri Lanka there is an increase of 6% in production for 2030. Hence, Sri Lanka is actually benefiting from CO2 fertilization with a positive impact. The results for Sri Lanka are not very difficult to explain; from it can be observed that as compared to other South Asian countries, in 2030 Sri Lanka is predicted to have the lowest WS, least climatic-change vulnerability and highest CO2 fertilization.
3.2. Data mining approach
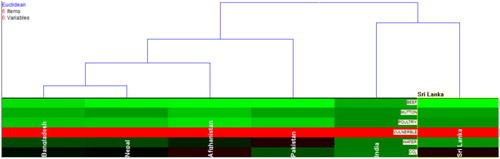
The traditional methodology adopted until now is algebraic and based on individual comparison; hence, it does not incorporate the collective pair-wise comparison among the rows, i.e. the countries and among the columns or attributes, i.e. meat and the three factors. Therefore, we explore the hidden relationships in the data from a data mining perspective, i.e. using HC. and show the HC results w.r.t columns and rows, respectively. HC was performed using HCE 3.5 with complete linkage and Euclidian distance.
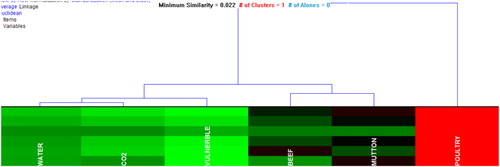
Some interesting results can be observed from that show the clustering of columns, i.e. three factors and the three meat types. Note that based on similarity, the order of columns has changed, for example, WS moved adjacent to CO2 fertilization. As we have already seen from and , there is an increase in production of poultry for all the six countries, which appears as solid red block for poultry in , high similarity between mutton and beef production can be observed for four countries except for Afghanistan and Bangladesh. However, the more interesting observation is the high similarity, i.e. 0.99 (on a scale of 0–1, with 1 being highest) between WS and CO2 fertilization, which is higher than the similarity between beef and mutton production, i.e. 0.89.
In native and semi-natural grasslands with no fertilizer adjustments, the seasonal biomass response to elevated CO2 appears to be more pronounced in dry years, as a result of the CO2-induced stomatal reduction of transpiration. Most grasslands are therefore, characterized by periods of water shortage (Campbell et al. Citation1997) and thus experience this indirect water relations benefit. Thus, the high similarity, i.e. 0.97 between WS and CO2 fertilization, validates our results for the six countries considered.
shows the results of clustering the rows, i.e. the countries; note that the order of countries has changed, for example, Bangladesh moved adjacent to Nepal. From , we can observe the clustering of Sri Lanka and India based on the comparison of six factors with a similarity of 0.358 for 2030. However, based on the comparison of the same six factors, the similarity is much higher between Bangladesh and Nepal, i.e. 0.896. Afghanistan and Pakistan do not seem to have a direct similarity with a distinct country. Note that such quantifiable comparisons ( and ) cannot be done using traditional techniques.
4. Conclusions and future work
Livestock is one of the fastest-growing sectors of agriculture and has potential opportunities for economic growth and poverty reduction in rural areas. In this paper, we have analysed the projected meat production in 2030 for six South Asian countries by extracting, transforming and integrating data from diverse sources. As per the World Bank, the six countries, i.e. Afghanistan, Bangladesh, India, Nepal, Pakistan and Sri Lanka are in the category of low- and lower middle-income countries. Increase in production of meat is projected from 2000 to 2030 for these countries. Except Sri Lanka, other South Asian countries are expected to be adversely affected by WS and vulnerability due to climate change. The country having the most adverse effect is likely to be Afghanistan, pointing to early mitigation efforts/plans. Furthermore, from FAO’s (Citation2014), Ravindran’s (Citation2011, Citation2013), Hans-Joachim and Manderscheid’s (Citation2012), Erda et al.’s (Citation2005), FAO’s (Citation2012) and Jayaraman’s (Citation2011) studies, it is evident that since the yield and price of major ingredients of poultry feed (cereals, mainly maize) are affected by CO2 fertilization and climate change, therefore, in view of these factors, poultry meat production cannot correspondingly remain unaffected. Thus, before nature forces us into a vegetarian lifestyle by 2030 as predicted, we may start adjusting our meat consumption habits from today. As part of future work it would be interesting to study in finer detail the cultural aspects of food consumption for the countries considered, i.e. a good population of India and Sri Lanka being vegetarian, while the population in Pakistan, Afghanistan and Bangladesh being mutton consumers. Also expanding the breadth of the future study by including production of eggs and milk as animal source foods. Finally, our results may not be perfect, some of the forecasts and conclusions may draw criticism for being either overstressing or understating. However, without this kind of work, the gaps in our understanding might remain unfilled.
Acknowledgement
The authors also, acknowledge with thanks Science and Technology Unit, King Abdulaziz University for technical support.
Disclosure statement
No potential conflict of interest was reported by the authors.
Additional information
Funding
References
- Abdullah A, Hussain A. 2014. A cognitively inspired approach to two-way cluster extraction from one-way clustered data. Cogn Comput. 7(1):161–182. doi:10.1007/s12559-014-9281-0
- Campbell BD, Stafford Smith DM, McKeon GM. 1997. Elevated CO2 and water supply interactions in grasslands: a pastures and rangelands management perspective. Global Change Biol. 3:177–187. 10.1046/j.1365-2486.1997.00095.x
- Doorenbos J, Kassam AH. 1979. Yield response to water. FAO Irrigation and Drainage Paper No. 33. Rome (Italy): FAO (Food and Agriculture Organization).
- Erda L, Wei X, Hui J, Yinlong X, Yue L, Liping B, Liyong X. 2005. Climate change impacts on crop yield and quality with CO2 fertilization in China. Philos Trans R Soc Lon B Biol Sci. 360:2149–2154.
- FAO (Food and Agriculture Organization). 1992. Milk testing and quality control. Milk Process Guide Ser. 2. Available from: http://www.fao.org/ag/againfo/resources/documents/mpguide/mpguide2.htm
- FAO (Food and Agriculture Organization). 2012. Food outlook – global market analysis. Available from: http://www.thepoultrysite.com/articles/contents/1205FAO_al989e00.pdf
- FAO (Food and Agriculture Organization). 2014. Animal production and health. Poultry and nutrition and feed. Available from: http://www.fao.org/ag/againfo/themes/en/poultry/AP_nutrition.html
- Fischer G. 2009. World food and agriculture to 2030/50. Paper presented at: Technical paper from the Expert Meeting on How to Feed the World in 2050; FAO (Food and Agriculture Organization), Rome, June 24–26.
- Hans-Joachim W, Manderscheid R. 2012. Crop growth responses to free air CO2 enrichment and nitrogen fertilization: rotating barley, ryegrass, sugar beet and wheat. Eur J Agron. 43:97–107.
- Jayaraman T. 2011. Climate change and agriculture: a review article with special reference to India. Rev Agrarian Stud. 1:16–78
- McKinnon M, Suárez LF, Uhl G. 2010. Climate vulnerability monitor 2010 – the state of the climate crisis. Available from: http://daraint.org/climate-vulnerability-monitor/climate-vulnerability-monitor-2010/download-the-report /
- Mintz Z. 2013. Deserts are ‘greening’ from carbon dioxide fertilization, satellite imagery saw arid regions bloom. International Business Times. Available from: http://www.ibtimes.com/deserts-are-greening-carbon-dioxide-fertilization-satellite-imagery-saw-arid-regions-bloom-photo
- Outlaw T, Engelman R. 1999. Sustaining water, easing scarcity: a second update: revised data for the Population Action International report, sustaining water: population and the future of renewable water supplies. Washington (DC): Population and Environment Program, Population Action International.
- PI (Population Institute). 2010. 2030: The “Perfect Storm” scenario. Available from: http://www.populationinstitute.org/external/files/reports/The_Perfect_Storm_Scenario_for_2030.pdf
- Ravindran V. 2011. Poultry feed availability and nutrition in developing countries – main ingredients used in poultry feed formulations. FAO (Food and Agriculture Organization) Poultry Development Review. Available from: http://www.fao.org/docrep/013/al705e/al705e00.pdf
- Ravindran V. 2013. Poultry feed availability and nutrition in developing countries – alternative feedstuffs for use in poultry feed formulations. FAO (Food and Agriculture Organization) Poultry Development Review. Available from: http://www.fao.org/docrep/013/al706e/al706e00.pdf
- Robinson TP, Pozzi F. 2011. Mapping supply and demand for animal-source foods to 2030. Animal Production and Health Working Paper No. 2. Rome (Italy): FAO (Food and Agriculture Organization).
- Tans P, Keeling R. 2012. Trends in atmospheric carbon dioxide. Available from: www.esrl.noaa.gov/gmd/eegg/trends/
- UNDESA (United Nations Department of Economic and Social Affairs). 2005. International Decade for Action “Water for Life” 2005-2015. 2005. Available from: http://www.un.org/waterforlifedecade/scarcity.shtml
- USDA (United States Department of Agriculture). 1996. USDA database. Available from: http://www.ers.usda.gov/data/InternationalFoodDemand/
- Vyas P, Patel HR. 2011. Climate change and its impact on wheat and maize yield in Gujarat. Challenges and opportunities in agrometeorology. Berlin: Springer.
- Yang D, Rundensteiner EA, Ward MO. 2011. Summarization and matching of complex patterns in streaming environment. Proc VLDB Endowment. 5:121–132. Available from: http://vldb.org/pvldb/vol5/p121_diyang_vldb2012.pdf.