
Abstract
Principle of ‘dynamic similarity’ is frequently applied in biomechanic research as a tool to extrapolate data between animals from the same species, but, in dogs, different breeds entail different conformations. For that reason, comparison of dynamic parameters among dogs of different breeds should not be only based in weight and relative velocity. By means of the use of force platform and high-speed videography in 12 dogs corresponding with four breeds of different conformations, we showed how most of kinetic and kinematic variables are highly independent of weight or relative velocity and other factors as morphometric values and ratios are determinant.
1. Introduction
Under the principle of dynamic similarity, animals of different sizes can use the same patterns of locomotion (Griffin et al. Citation2004; Bullimore & Burn Citation2006). This theory assumes that they maintain geometric similarity over a range of body mass and the ratio of all the forces and time intervals that operate in the animal dynamic are similar. Based on this premise, the principle of dynamic similarity should allow to determine the relationship among velocities, frequencies or duration of stride phases of an animal in movement with its body size, moving at equal relative velocities. With this approach, factors such as head, neck or limb length, muscle mass or general body build are ignored.
Quadrupeds use different transport velocities as well as different gaits depending on the velocity at which they move. Due to this, to compare the dynamic similarity of animals of different size, it is necessary to use the velocity at which the animals are performing equivalent movements (Grossi & Canals Citation2010). Based on this, any attempt to obtain biomechanic or even biometric data should seek that animals should necessarily move at the same gait pattern and the same relative velocity.
Re-scaling the gait parameters according to the theory of dynamic similarity is based on the assumption that every dog has the same basic shape but, in domestic dogs, gait parameters may be expected to change because different breeds entail differing conformations (Alphonsus et al. Citation2010). For this reason, dogs place limb segments and joints in variable positions during the gait cycle, especially at critical periods (e.g., the initiation and termination of the stance phase; Colborne et al. Citation2005).
How and how much body conformation is affecting the kinematic and/or kinetic parameters developed by the limbs has not been extensively studied, but these factors should highly determine the specific dynamic efficiency that dogs with different body conformations could show, although if the weight and relative velocity were similar.
Different methods have been used to analyse gait parameters in order to evaluate sound or lame subjects. Videographic techniques are currently the most used methods for the kinematic (angular, temporal and linear) analysis in domestic animals; these methods result precise and non-invasive. Combined with the treadmill it is possible to perform these analyses under controlled conditions and incorporate additional devices (Khumsap et al. Citation2004). The main methods to obtain data regarding these parameters consist of visual markers fixed on the skin at specific anatomic references using cyanoacrylate glue (Vilar et al. Citation2010).
As previously reported, treadmill allows to insert additional devices for gait analysis; between them, force plate analysis is an objective, sensitive and accurate method to evaluate limb loading in dogs (Vilar et al. Citation2013); however, force plate gait analysis provides large variation of normal ground reaction forces (GRFs) that prevent meaningful direct comparison of data between different dogs or dog groups (Voss et al. Citation2010). To minimize this, some authors try to homogenize the animal groups using dogs of the same breed (Vilar et al. Citation2014). If this is not possible, comparative studies with animals of different conformations necessarily require a res-caling, harmonization or normalization of methods.
Because GRFs are closely related to body mass, force data are usually normalized to body mass or body weight (BW), the latter often expressed in percentage (%) of BW. To evaluate the velocity dependency of GRFs most authors limit dog velocity ranges to 0.3–0.4 m/s and try to keep the horizontal acceleration to 0.4–0.5 m/s2 (Riggs et al. Citation1993). Despite this, considerable variation was observed comparing dogs with different BWs to each other, because BW and peak vertical forces (PVFs) had a negative correlation (Budsberg et al. Citation1987).
For all these reasons the standard procedure in veterinary medicine for comparing force plate data between animals is to keep dog velocity and acceleration or deceleration within a narrow range, and to normalize data to BW (Voss et al. Citation2007). Nevertheless, GRF and stance times of dogs still varied by approximately 10%, even after full data normalization as showed Voss et al. (Citation2010) in a study with 129 dogs of different breeds trotting at a range of velocity of 2.0 ± 0.15 m/s. Differences in fully normalized gait parameters were found between Greyhounds and Labrador Retrievers indicating that these two breeds have certain distinctive and specific gait patterns (Bertram et al. Citation2000).
Starting from the hypothesis that some kinetic and kinematic parameters of pelvic limbs could have significant independency on dog size, weight and relative velocity. The purpose of this study was to demonstrate our hypothesis assessing and comparing a series of kinematic and kinetic parameters of the hip, stifle and tarsal joints in 12 clinically normal dogs at the highest velocity that they could develop at walk on a treadmill. The animals belonged to four breeds with different conformations.
2. Materials and methods
2.1. Animals
Twelve healthy adult male dogs were selected for this study: three beagles (Bea), three Belgian shepherd (Bsh), three German shepherd (Gsh) and three Canarian warren hound (War). Every dog had a complete clinical gait and orthopaedic examination. Inclusion criteria were no history of musculo-skeletal pathology, absence of clinically detectable lameness and absence of abnormal findings on orthopaedic examination.
Mean (± SD) values were: age for all dogs was 2.2 ± 0.8 years; BW for War group was 15.1 ± 1.7 kg, for Bea was 16 ± 0.8 kg, for Gsh was 38.5 ± 2.3 kg and for Bsh was 18.3 ± 1.6 kg.
Mean (± SD) values of velocity for War group was 1.3 ± 0.02 ms, for Bea was 1.16 ± 0.02 ms, for Gsh was 1.66 ± 0.07 ms and for Bsh was 1.62 ±0.03 ms.
Owners were informed about the procedure and a signed document of acceptance was requested.
2.2. Morphometric data
Morphometric measurements included BW, withers height (WH) and body length (BL).
WH was the distance from the ground to the dorsal scapular rim, and BL was the distance from the cranial aspect of the shoulder joint to the caudal aspect of the ischiatic tuberosity. BL ratio was calculated: BLR = WH/BL. A BLR of 1 would describe a dog with a perfectly square body build, a ratio smaller than 1 would indicate a dog with a long body (or short limbs) and a ratio larger than 1 would indicate a dog with a short body (or long limbs).
Mean WH for War group was 54 ± 1 cm, for Bea was 45 ± 1 cm, for Gsh was 67 ± 2 cm and for Bsh was 57 ± 1 cm; BL for War group was 46 ± 1 cm, for Bea was 54 ± 0.8 cm, for Gsh was 73 ± 3 cm and for Bsh was 64 ± 1 cm.
BLR for War = 1.17, Bea = 0.80, Gsh = 0.91 and Bsh = 0.89.
2.3. Kinematic measurements
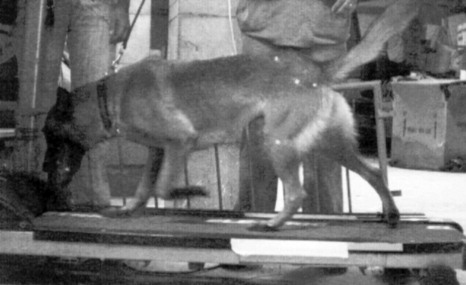
Flat retroreflective markers (5 mm in diameter) were affixed to the skin overlying the dorsal cranial iliac spine, ischiatic tuberosity, greater trochanter of the femur, lateral collateral ligament of the stifle joint, lateral malleolus of the tibia and over the distal point of the fifth metatarsal bone of each of the 12 dogs. Following application of the markers, the dogs were allowed to become familiarized with the runway used for gait analysis by walking and trotting on it the necessary sessions before data collection, until they showed a smooth and coordinated gait.
A high-speed video camera (Sportscam, Fastec) recorded to 250 frames/s. The device was placed laterally in order to record the left side. A minimum of five complete strides were recorded for each hind limb of each dog (). Beginning of the stride was considered when the support phase started.
Variables were obtained by means of a PC software (Metric©, PCE GmbH).
The temporal variables that were obtained were: stride duration (ST), per cent stance phase duration of the stride (% ST), per cent swing phase duration of the stride (% SwT).
The linear variables were: stride length (SL), per cent stride length/BL (% SL/BL) and per cent stride length/WH (% SL/WH).
The obtained angular variables were: hip ROM, knee ROM and tarsal ROM.
2.4. Velocity calculations
In order to collect data from dogs at the ‘same dynamic status’, velocity was progressively augmented to reach a maximum where dogs were still at walk.
2.5. Kinetic calculations
A force platform (pasco®) was placed under the rubber band of the treadmill in order to register the PVF of stance phase. Five valid trials were recorded to 250 data/s. Trials were considered acceptable when the paw of a walking dog landed squarely on the force platform within the area bound by the force transducers. PVF data were expressed as % BW in Newtons (N).
2.6. Statistical analysis
Due to the skewness present in the collected data, box–cox transformations were used to achieve normality. Once variance analysis was performed, comparisons between dogs were performed using the Tukey HSD test. Level of significance was established in p value ≤ 0.05. Confidence level was established in 95%.
3. Results
Kinetic and kinematic data are summarized in ().
Comparison between breeds showed the following ():
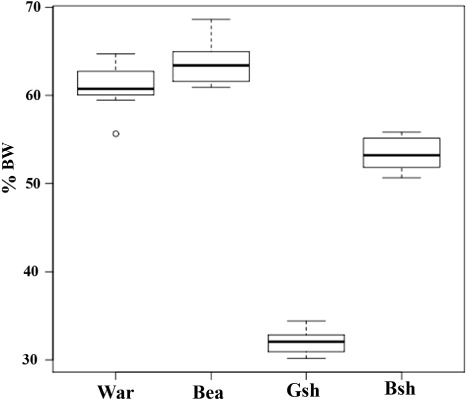
% BW: no differences were found between Bea and War ().
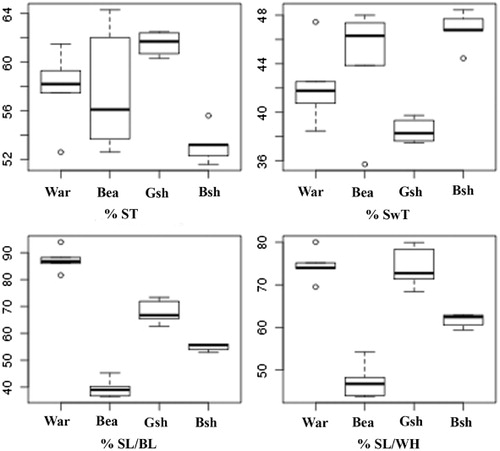
ST: War and Gsh showed no differences between them.
SL: all the dogs showed differences between them.
% ST: significant differences between Bsh and Gsh.
% SwT: between Gsh and Bsh and between Gsh and Bea.
% SL/BL: all the breeds had significant differences between them.
% SL/WH: only differences between Gsh and War are not significant, for the rest of comparisons p value was <0.001 ().
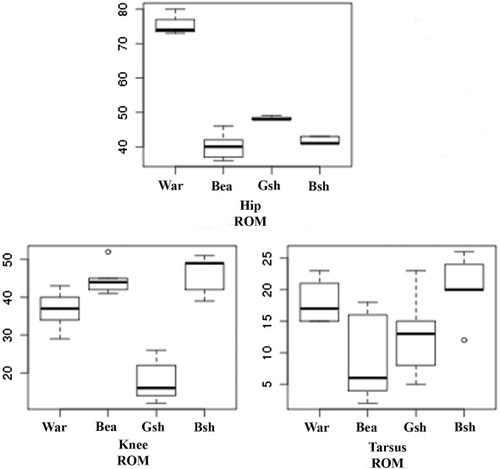
Hip ROM: only Bea and Bsh showed no differences. War showed very high statistical differences compared with the other breeds.
Knee ROM: no differences between dogs were found.
Tarsal ROM: no differences between dogs were found ().
Table 1. Mean ± SD of kinetic and kinematic values of four groups of dogs: Canarian warren hound (War), beagle (Bea), German shepherd (Gsh) and Belgian shepherd (Bsh).
Table 2. Resultant p values from the comparison of kinetic and kinematic parameters between the four studied breeds.
4. Discussion
In this study, four breeds of dogs with different conformations were walked on a treadmill with a force platform in order to assess different kinetic and kinematic parameters. As a result, gross differences in gait mechanics were evident between these four breeds of dogs.
Normalization of these parameters to BW and WH according to the theory of dynamic similarity should enable the comparison of results between dogs of different sizes (Alexander & Jayes Citation1983; Hof Citation1996). A difficult (but mandatory) prerequisite is to compare the subject's values at equal relative (normalized) velocities, but if dogs were walked at a same (given) velocity, smaller dogs need to travel at a relatively higher speed than large dogs (Bertram et al. Citation2000), or even to change the gait pattern. Time-associated variables are therefore largely dependent on dog size and its relative velocity. Some authors (Colborne et al. Citation2005) obtained this temporal parameters allowing dogs to trot at their own, self-selecting speeds in an attempt to provide gait mechanics at typical velocities relevant to each dog. When a treadmill is used, velocity is preassigned and then animals cannot ‘choose’ speed; for this reason, the appropriate speed should be when different dogs move at the ‘same dynamic status’. Given that a dog can walk at a wide range of velocities even at the same gait, data were obtained when dogs developed their maximum velocity at walk.The use of the treadmill with an integrated force platform allowed us to collect parameters under controlled conditions such as velocity or track characteristics, which contribute to obtain more homogenous data; in this way, influence of trial repetitions and deviations in velocity during the repetitions when using single force platform systems is nullified (Bockstahler et al. Citation2007) .
An important factor to take into account is the potential variation of parameters by means of the habituation of the animals to the device. However, repeated-measure analysis of variance of the variance coefficient on dogs of different breeds on a treadmill regarding the stance time did not show any indication of a training effect (Bockstahler et al. Citation2007); in accordance with this, we started to measure dogs when they showed habituation.
An important factor to take into account is the potential variation of parameters by means of the habituation of the animals to the device. However, repeated-measure analysis of variance of the variance coefficient on dogs of different breeds on a treadmill regarding the stance time did not show any indication of a training effect (Bockstahler et al. Citation2007); in accordance with this, we started to measure dogs when they showed habituation.
One limitation of treadmills was the size of the dog; this made it necessary to select breeds that did not overreach the limits of the force plate. To solve this, a recent publication (Kapatkin et al. Citation2014) proposed to accommodate various devices in series when larger size dogs are evaluated.
Another limitation is that treadmill-force plate system only allowed measurement of vertical forces.
Analysing % BW, enormous differences were found between Gsh and the other breeds. Gsh dogs exerted approximately with their pelvic limbs half of the force compared with War; in our opinion, this fact would demonstrate how selection can radically change the balance, i.e., versus the thoracic limbs.
War dogs showed highest BLR, % SL/BL, % SL/WH and hip ROM ratios. This means that this breed is capable of covering longer distances in less strides than the others, even if their weight doubled War weight or were taller. In addition, a high BLR ratio means longer limbs and then a more proximal centre of mass, which results in less force required to overcome the inertia of the appendicular structure (Grossi & Canals Citation2010).
5. Conclusions
Based in our results, most of kinetic and kinematic parameters are independent of BW and relative velocity, making these sources insufficient to correlate data from different dogs, based on the ‘dynamic similarity’ principle. Body size and ratios seem to play the most important role in terms of dynamic efficiency. These conclusions would be stronger supported if further studies include more animals and/or breeds.
Disclosure statement
No potential conflict of interest was reported by the authors.
References
- Alexander RMcN, Jayes SA. 1983. A dynamic similarity hypothesis for the gaits of quadrupedal mammals. J Zool. 201:135–152.
- Alphonsus C, Akpa GN, Oni OO, Rekwot PI, Barje PP, Yashim SM. 2010. Relationship of linear conformation traits with bodyweight, body condition score and milk yield in Friesian × Bunaji cows. J Appl Anim Res. 38:97–100.
- Bertram JEA, Lee DV, Case HN, Todhunter RJ. 2000. Comparison of the trotting gaits of Labrador Retrievers and Greyhounds. Am J Vet Res. 61:832–838.
- Bockstahler B, Skalicky M, Peham C, Muller M, Lorinson D. 2007. Reliability of ground reaction forces measured on a treadmill system in healthy dogs. Vet J. 173:373–378.
- Budsberg, SC, Verstraete MC, Soutas-Little RW. 1987. Force plate analysis of the walking gait in healthy dogs. Am J Vet Res. 48:915–918.
- Bullimore SR, Burn JF. 2006. Dynamically similar locomotion in horses. J Exp Biol. 209:455–465.
- Colborne R, Innes JF, Eithne J, Comerford EJ, Owen M, Fuller C. 2005. Distribution of power across the hind limb joints in Labrador Retrievers and Greyhounds. Am J Vet Res. 66:1563–1571. 10.2460/ajvr.2005.66.1563
- Griffin TM, Kram S, Wickler SJ, Hoyt DF. 2004. Biomechanical and energetic determination of the walk-trot transition in horses. J Exp Biol. 207:4215–4223.
- Grossi B, Canals M. 2010. Comparison of the morphology of the limbs of juvenile and adult horses (Equus caballus) and their implications on the locomotor biomechanics. J Exp Zool. 313:292–300.
- Hof AL. 1996. Scaling gait data to body size. Gait Posture. 4:222–223. 10.1016/0966-6362(95)01057-2
- Kapatkin AS, Kim JY, Garcia-Nolan TC, Kim SY, Hayashi K, Hitchens PL, Stover SM. 2014. Modification of the contact area of a standard force platform and runway for small breed dogs. Vet Comp Orthopaedics Traumatology. 27:257–262.
- Khumsap S, Lanovaz JL, Clayton HM. 2004. Verification of skin-based markers for 3-dimentional kinematic analysis of the equine tarsal joint. Equine Vet J. 36:655–658.
- Riggs CM, DeCamp CE, Soutas-Little RW, Braden TD, Richter MA. 1993. Effects of subject velocity on force plate-measured ground reaction forces in healthy Greyhounds at a trot. Am J Vet Res. 54:1523–1526.
- Vilar JM, Batista M, Morales M, Santana A, Cuervo B, Rubio M, Cugat R, Sopena J, Carrillo JM. 2014. Assessment of the effect of intraarticular injection of autologous adipose-derived mesenchymal stem cells in osteoarthritic dogs using a double blinded force platform analysis. BMC Vet Res. 10:143.
- Vilar JM, Morales M, Santana A, Batista M, Miró F, Spinella G. 2013. Long-term valuation of oral mavacoxib in osteoarthrosic dogs using force platform analysis. Pak Vet J. 33:229–233.
- Vilar JM, Ramirez G, Spinella G, Martinez A. 2010. Kinematic characteristics of myositis ossificans of the semimembranosus muscle in a dog. Can Vet J. 51:289–292.
- Voss K, Galeandro L, Wiestner T, Haessig M, Montavon PM. 2010. Relationships of body weight, body size, subject velocity, and vertical ground reaction forces in trotting dogs. Vet Surg. 39:863–869. 10.1111/j.1532-950X.2010.00729.x
- Voss K, Imhof J, Kaestner S, Montavon PM. 2007. Force plate gait analysis at the walk and trot in dogs with low-grade hindlimb lameness. Vet Comp Orthopaedics Traumatology. 20:229–304.