
Abstract
In this study the possibility of body size estimation of new born lambs using image processing and its effect on the genetic gain of a simulated population has been investigated. The body size of 158 new born lambs of Zandi sheep was evaluated via appraisal method, digital image processing and metric methods. The correlation coefficients between metric lamb size with quantities were calculated from image processing method and appraisal method were 0.88 and 0.48, respectively (P < 0.01). In the next step, two populations were randomly simulated using R2.15 programming environment, and two different scenarios based on two lamb size measurement methods were studied. In the first scenario, it was assumed that the animal body size is determined using image processing technique in continuous values, while in the second scenario it was assumed that the body size is determined via appraisal method in discrete values. As results, the accuracies of breeding value estimations in the first and second scenario were 0.89 and 0.78, and the genetic trends were 0.46 and 0.28, respectively (P < 0.01). The results showed that determination of lamb size based on proposed image processing method is feasible, and replacement of this new method instead of human appraisal method could increase the genetic gain in the breeding herds.
1. Introduction
In animal breeding, many traits such as body condition score, meat quality and carcass characteristics same as quantitative traits are under controlling of multiple genes, but they are measured same as qualitative trait in discrete scales. These traits are called as threshold traits (Gianola Citation1982; Abdel-Azim & Berger Citation1999). Each threshold trait has an underlying variable with normal distribution which is under controlling of some genetic and environmental factors. Due to the lack of accurate measurement tools the underlying variable of threshold trait is not visible and its phenotype is measured in two or more distinct levels (Gianola Citation1982). Whatever the accuracy of phenotypic measurement of a threshold trait is improved, the portion of error in the phenotypic variance is reduced, and the higher genetic gain in the breeding population will be expected (Abdel-Azim & Berger Citation1999; Hayes & Goddard Citation2010).
In the pelt sheep (e.g. Karakul and Zandi sheep), characteristics related to the pelt quality such as curl type, pattern score and lustre of pelt are known as threshold traits (Schoeman & Albertyn Citation1992). Zandi sheep is a dual-purpose breed (pelt and meat) that is kept at the central region of Iran. At the birth, Zandi lambs are evaluated for different pelt traits such as curl type, pattern score and lamb size by trained appraisers. Pelt traits are evaluated by the allocation of scores. Score allocation is done on an ordinal scale. For example Lustre is scored on Scales 5, 8 and 10. This means that the 8 is taken as the mid value and 5 and 10 as the minimum and maximum values (Khojastehkey et al. Citation2006). It seems that use of appraisal method to evaluate the pelt traits is not an accurate method. Vilarrasa et al. (Citation2010) indicated that due to the items such as differences in experience and skill, time limitation, the lack of accurate measuring instruments and evaluator changes during different years, incidence of human error in the appraisal method is inevitable.
In the recent two decades, use of artificial intelligence methods has been developed in military, medical, aerospace, identification, robotics and security systems, and used instead of human sense for diagnosis (Onder et al. Citation2010). In recent years some efforts to use of artificial intelligence in the agriculture and animal science have been started. Estimation of live weight in pigs (Wang et al. Citation2009), estimation of body area in broiler chickens (Junior et al. Citation2011), estimation of leaf area in plant (Banerjee et al. Citation2012), identification and classification of plant disease (Al-Hiary et al. Citation2011), separation of fruit genotypes (Alipasandi et al. Citation2013), size estimation and classification of tea granules (Borah et al. Citation2007) and linear regression analyses for predicting carcass tissue composition of kids (Arguello et al. Citation2001) are some examples of using artificial intelligence to prediction and classification in the agriculture.
As far as we know, there are not any reports in use of artificial intelligence to determine the pelt quality of new born lambs. In this study, using image processing technology a new method to estimate the body size of new born lambs was introduced, and the effect of this new method on the genetic progress at a simulated population was investigated.
2. Material and methods
2.1. Phenotypic recording and image acquisition
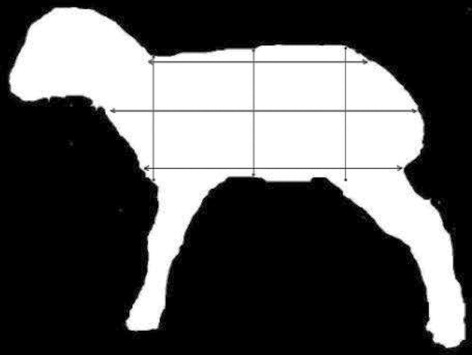
This study was conducted in Zandi sheep breeding centre (Khojier) located between Tehran and Abali. At birth, 300 lambs were identified, and date of birth, sex, type of birth and weight were recorded. In Day 2 or 3 afterbirth, all lambs were characterised for pelt traits by expert appraisers. The lamb body size was one of the pelt traits which evaluated by the allocation of scores: 1, 3 and 5. This means that the 3 was taken as the mid size and 1 and 3 as the minimum and maximum sizes. Simultaneously, to have more accurate measurement of body size, some metric dimensions including length and height of lambs was measured by metre (). Afterwards, some images with size of 4320 × 3240 pixels were taken from lateral view of each lamb using canon digital camera SX 150, considering the fixed 60 cm imaging distance.
2.2. Image processing
All images were processed using image processing tools (IPTs) of MATLAB 7.8.0 software. In the first step, to improve the images quality, series of preprocessing practices was done on each digital image. Conversion of the colour images to the grey images, brightness adjustment, images segmentation, selecting the region of interest and applying a series of morphological operators to eliminate noise and unwarranted points was some of these preprocessing operations.
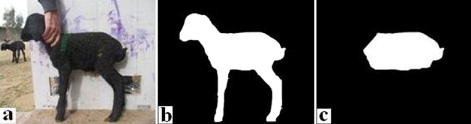
Body size of lambs was estimated using two image crops: the first crop was an image with a complete side view of lambs () and the second crop was lamb image without head, neck and limbs (). The steps of images preprocessing are shown in .
2.3. Feature extraction
To estimate the area of lateral side of lambs, an input image was labelled using the bwlabeln function in the IPT of MATLAB, and then some important morphological features such as area, perimeter, major axis length and minor axis length were calculated using the regionprops function. Considering the fixed imaging distance and equal size of all input images, area of lateral side of each lamb was estimated through counting the number of white pixels in the binary image. The Pearson and Spearman–Kendall procedures of SPSS (16) were used to estimate the correlation coefficients between lamb body size measurements in metric system, image processing system and appraisal system.
2.4. Simulation of population
In this study, a base population including 300 animals (50% ewes and 50% rams) was randomly simulated using R2.15 software. This overlap population was bred up to 10 generations, and each animal depending on defined scenario participated in the mating programme for 3 generations. In all scenarios the lambing rate of ewes was considered 90%, and only one lamb per each generation was produced from each ewe.
2.5. Definition of trait
The body size of lambs was simulated based on the metric body dimensions which were measured in the previous step, using normal distribution with mean of 8.1, standard deviation of 1.2 dm2, and heritability of 0.25. Considering of the measurement method, two scenarios were designed in the simulated population. In the first scenario, it was assumed that the animal body size is measured via the image processing method as continuous quantitative values. While, in the second scenario, it was assumed that the animal body size was measured via the appraisal method in three scales: small, medium and large scales. Derived from the mean and variance of a trait, Number 8 was allotted to the medium-sized lambs and Numbers 5 and 11 were allotted to the small and large lambs, respectively. Description of simulated population for two scenarios is shown in .
Table 1. Description of simulated population for two scenarios.
2.6. Estimation of breeding values and selection of animals
In each generation, breeding value of animals was estimated using a simple single-trait animal model through best linear unbiased prediction (BLUP) method. The BLUP method had been used in several studies for analysis of categorical traits (Van Vleck & Gregory Citation1992). The statistical model to estimate the breeding value of animals was as follows:
In the above equation, Y is the value of each observation, m is the mean of trait, ai and eij are the random effects and residual of the model, respectively. In each generation rams and ewes with higher breeding values were selected to produce next generation. The true breeding value of each animal was calculated using following equation:
In the above equation, go is the true breeding value of animal, gs and gd are the true breading values of sire and dam of animal, respectively, and gm is the Mendelian sampling effect (Falconer & Mackay Citation1996). The Mendelian sampling effect was calculated using the following equation:
In the above equation, Fs and Fd are the inbreeding coefficients of sire and dam of animal, respectively (Falconer & Mackay Citation1996). The accuracy of breeding value estimations was determined as correlation coefficient between estimated breeding values and true breeding values for each animal. Each scenario was run for 10 replicates, and results of different scenarios were compared using the generalized linear model procedure of SPSS (16) software.
3. Results and discussion
3.1. Estimation of lamb body size
The mean of lamb size and their correlations are shown in and , respectively. According to the results, the correlation coefficients between lamb body size which was measured using the metric method, with values obtained by the appraisal method and by the image processing method were 0.48 and 0.88, respectively. This observation suggests that the image processing method for estimating lamb size is more accurate tool than human assessment method. There are some reports in the size estimation of object or organisms using image processing methods. The leaf area of a medicinal plant was estimated by Banerjee et al. (Citation2012) using image processing techniques with precision of 98%. The leaf area of tomato and corn was estimated by Garcia et al. (Citation2009) using image processing techniques with precision of 98.1% and 96.2%, respectively. In another study, body area of broiler chicken was estimated by Junior et al. (Citation2011) using image processing method with precision of 99%. These reports are in agreement with the results of present study.
Table 2. The mean of lateral size of lambs that were measured using different methods.
Table 3. Correlation coefficients between lamb body sizes estimated using different methods.
3.2. Results of population simulation
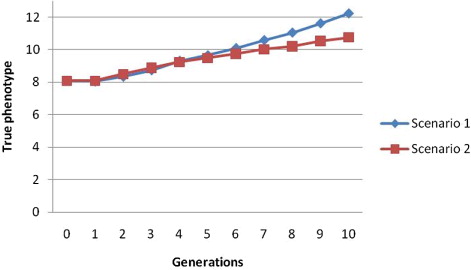
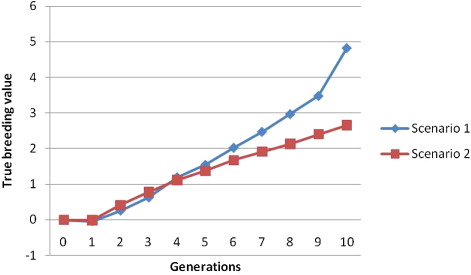
Comparison of some estimated parameters between two scenarios is shown in , and phenotypic trends and genetic trends are shown in and , respectively. The accuracy of breeding value estimations in the first and second scenarios was 0.89 and 0.78, respectively (P < 0.01). This observation may be related to use of more accurate instrument to measure the lamb body size in the first scenario (image processing).
Table 4. Genetic and phenotypic means of simulated populations in each scenario.
The accuracy of breeding value estimations may be influenced by the factors such as heritability coefficient, rate of pedigree evolution and quality and quantity of phenotypic data (Stalder Citation1999). Whatever the accuracy of phenotypic values for a threshold trait is increased, the portion of error in the phenotypic variance is reduced and the higher genetic improvement will be expected (Abdel-Azim & Berger Citation1999). In the present study, when the lamb size was just measured in three scales (small, medium and large scales), the major part of the phenotypic variance of the trait was discounted, and the error variance was increased; so the accuracy of breeding value estimations and genetic trend was decreased in the population.
According to Hossein-Zadeh (Citation2007) and Bates (Citation1999), if the extent of residual error in the phenotypic variance is decreased (e.g. recording errors), the phenotypes would be better index to indicate genetic differences among animals, and consequently the correlation between estimated breeding values and true breeding values is increased. The reduction in accuracy of genomic prediction for ordered categorical data compared to continuous observations is reported by Kizilkaya et al. (Citation2014). These reports are in agreement with the results of current study.
The true genetic trends for lamb body size in the first and second scenarios were estimated 0.46 and 0.28, respectively (P < 0.01). Due to the IPTs produced more accurate phenotypes and more accurate breeding value estimations than human appraisal method, so the chance of weak animal selection in different generations is reduced, and therefore the genetic trend of population is improved.
According to the Abdel-Azim and Berger (Citation1999) and Meuwissen et al. (Citation1995), the increasing in the accuracy of phenotypic measurement of a threshold trait results in a higher genetic gain in the breeding population because of decreasing in the deviation between estimated breeding values and true breeding values. These reports are in accordance with the results of present study.
4. Conclusion
The results indicated that, not only human appraisal method can be replaced by IPTs to measure the pelt size of new born lambs, but also this substitution could increase the genetic gain at the breeding herds.
Acknowledgement
Comments by staff of Khojir sheep breeding centre are gratefully appreciated.
Disclosure statement
No potential conflict of interest was reported by the authors.
References
- Abdel-Azim A, Berger PJ. 1999. Properties of threshold model predictions. J Anim Sci. 77:582–590.
- Al-Hiary H, Bani-Ahmad S, Reyalat M, Braik M, ALRahamneh Z. 2011. Fast and accurate detection and classification of plant diseases. Int J Comput Appl. 17:31–38.
- Alipasandi A, Ghaffari H, Alibeyglu SZ. 2013. Classification of three varieties of peach fruit using artificial neural network assisted with image processing techniques. Int J Agron Plant Prod. 9:2179–2186.
- Arguello A, Capote J, Gines R, Lopez JL. 2001. Prediction of kid carcass composition by use of joint dissection. Livest Prod Sci. 67:293–295.
- Banerjee K, Jasrai YT, Jain NK. 2012. An accessible and accurate image analysis for root length and leaf area estimation: a case application to Azadirachta indica seedlings. Am Eurasian J Agric Environ Sci. 12:64–76.
- Bates RO. 1999. Performance records and their use in genetic improvement. Purdue extension. [cited 2012 April 12]. Available from: http://www.ces.purdue.edu/extmedia/NSIF/NSIF-5/NSIF-FS5.PDF
- Borah S, Hines EL, Bhuyan M. 2007. Wavelet transform based image texture analysis for size estimation applied to the sorting of tea granules. J Food Eng. 79:629–639.
- Falconer DS, Mackay TCF. 1996. Introduction to quantitative genetics. 4th ed. Harlow (UK): Longmans Greed.
- Garcia ER, Hernandez-Hernandez F, Zaraguza SGM, Herrera SG. 2009. Two new methods for the estimation of leaf area using digital photography. Int J Agric Biol. 11:397–400.
- Gianola D. 1982. Theory and analysis of threshold characters. J Anim Sci. 54:1079–1096.
- Hayes B, Goddard M. 2010. Genome-wide association and genomic selection in animal breeding. Genome. 53:876–883.
- Hossein-Zadeh NG. 2007. Effect of the threshold nature of traits on heritability estimates obtained by linear model. Pak J Biol Sci. 10:145–147.
- Junior YT, Silva E, Junior RAB, Lopes MA, Damascene FA, Silva GCDAE. 2011. Digital surface area assessment of broiler chickens. Engenharia Agrícola. 31:468–476.
- Khojastehkey M, Emamjome KN, Vaez TR. 2006. A study of pelt and growth traits in Zandi sheep. Proc N Z Soc Anim Prod. 66:206–208.
- Kizilkaya K, Fernando RL, Garrick DJ. 2014. Reduction in accuracy of genomic prediction for ordered categorical data compared to continuous observations. Genet Sel Evol. 46:37–50.
- Meuwissen TH, Engel B, Vander-Werf JH. 1995. Maximizing selection efficiency for categorical traits. J Anim Sci. 73:1933–1939.
- Onder H, Arl A, Ocak S, Eker S, Tufekci H. 2010. Use of image analysis in animal science. J Inf Techol Agric. 1:1–4.
- Schoeman SJ, Albertyn JR. 1992. Estimates of genetic parameters and genetic trend for fur traits in a Karakul stud flock. S Afr J Anim Sci. 22:75–80.
- Stalder K. 1999. Performance records on relatives. Purdue extension. [cited 2012 April 12]. Available from: http://www.ces.purdue.edu/extmedia/NSIF/NSIF-7/NSIF-FS7.html
- Van Vleck LD, Gregory KE. 1992. Multiple-trait restricted maximum likelihood for simulated measures of ovulation rate with underlying multivariate normal distributions. J Anim Sci. 70:57–65.
- Vilarrasa ER, Bünger L, Brotherstone S, Macfarlane JM, Lambe NR, Matthews KR, Haresign W, Roehe R. 2010. Genetic parameters for carcass dimensional measurements from video image analysis and their association with conformation and fat class scores. J Livest Sci. 128:92–100.
- Wang Q, Deng X, Ren Y, Ding Y, Xiong L, Ping Z, Wen Y, Wang S. 2009. Egg freshness detection based on digital image technology. Sci Res Essays. 4:1073–1079.