ABSTRACT
In this study, the effect of short-term starvation (0, 1 and 2 weeks) on biochemical parameters and non-specific immune response of tinfoil barb (Barbonymus schwanenfeldii) was investigated. Fish in three different groups were deprived of feed for 0 (control), 1 (S1) and 2 (S2) weeks, respectively. At the end of the experiment, blood samples were collected for biochemical and immunological analyses. The results indicated that plasma glucose, cholesterol and peroxidase levels and haemolytic complement activity were significantly lower in starved fish for 2 weeks than those in fed fish and in starved fish for 1 week. Plasma lysozyme activity significantly changed in different starvation periods in all treatment groups. However, no significant effect was observed on plasma antiprotease activity. There were significant differences between the control and the food-deprived groups in plasma triglyceride levels. Starvation increased plasma total protein, albumin and globulin in the deprived groups compared with the control group. The results of this study showed significant changes in non-specific immune parameters, plasma glucose levels and other metabolites in this species after feed deprivation that are indicative of the relationship between starvation effects and the extension of starvation period.
1. Introduction
The ability of fishes to tolerate starvation differs between species. As reviewed by Navarro and Gutiérrez (Citation1995) and McCue (Citation2010), the majority of fishes may only tolerate several days or weeks of starvation, whereas some fishes such as European eel, Anguilla Anguilla, are reported to survive nearly four years of starvation (Boetius & Boetius Citation1985). Food availability can vary over the time of day or month (e.g. during migrations and reproduction in natural environments and because of handling and pathogens in captivity) (Navarro & Gutiérrez Citation1995; McCue Citation2010; Davis & Gaylord Citation2011). The patchy distribution of planktonic preys as well as inter and intra specific competition can lead to variation in food availability (Mommsen Citation1998).
Blood glucose concentration remained steady during periods of food deprivation. The blood glucose response to food fluctuations or depletion largely occurs at the expense of liver glycogen, at least during the initial stage of starvation (Navarro & Gutiérrez Citation1995). During fasting the most available fat reserve seems to be triglycerides (Larsson & Lewander Citation1973). Starvation decreases plasma glucose, triglyceride and total cholesterol levels during food deprivation periods (Perez-Jiménez et al. Citation2007). However, some studies have reported an increase or steady levels of plasma triglyceride at the early stages of starvation (Echevarría et al. Citation1997; Kirchner et al. Citation2005). The metabolic responses of fasting depend on many variables including environmental conditions, period of food deprivation, fish species and the previous feeding history (Navarro & Gutiérrez Citation1995). Fish immune responses may be influenced by nutritional states and feed deprivation (Kiron Citation2012). While a large number of studies have been conducted to investigate the effects of starvation on growth and metabolic responses of fish species of interest for aquaculture (Blasco et al. Citation1992; De Pedro et al. Citation2003; Pérez-Jiménez et al. Citation2007; Costas et al. Citation2011; Falahatkar Citation2012; Furné et al. Citation2012; Pérez-Jimenez et al. Citation2012; Yarmohamadi et al. Citation2012), few studies have focused on the influence of fasting on the fish immune responses (Sakai Citation1983; Caruso et al. Citation2010, Citation2011, Citation2012).
Cyprinid fish are one of the most important groups of ornamental fish in the world. Culture of ornamental fish, especially Cyprinidae, has increased in recent decades due to a growing demand and pressure on wild resources. Tinfoil barb (Barbonymus schwanenfeldii) is a suitable species between cyprinids for fish production in several Asian countries (Bailey & Cole Citation1999). Similar to the other ornamental fish, tinfoil barb is exposed to different starvation periods during the rearing, transportation and marketing process. However, the influence of feed deprivation of the immunological and physiological responses remained unknown. Hence, this study was conducted to investigate the influence of starvation on physiological parameters (glucose, total protein, triglyceride, cholesterol, albumin and globulin) and non-specific immune responses (alternative complement pathway haemolytic activity (ACH50), trypsin inhibition, plasma peroxidase and lysozyme activity) of tinfoil barb.
2. Material and methods
2.1. Fish rearing and experimental design
Prior to the beginning of the experiment, the fish were acclimatized to the diet (commercial diet: moisture 12%, crude protein 41%, crude fat 6% and fibre 2%) and rearing conditions for 2 weeks. Ninety juvenile tinfoil barbs weighing 16.20 ± 0.13 g were randomly distributed into 9 rectangular glass aquaria (50 × 30 × 35 cm, 52 L). This study was performed in triplicate (10 fish per aquarium; 3 aquaria per treatment). Soluble oxygen was maintained throughout the experiment by aeration and filtration using compressed air. Water in each tank was changed at a rate of 30% volume per day using dechlorinated city water. Water temperature (26.9 ± 0.14°C), pH (7.3 ± 0.4), dissolved oxygen (6.3 ± 0.3 mg/L), hardness (193.4 ± 13.2 mg/L) and ammonia (0.14 ± 0.004 mg/L) were recorded during the trial. Oxygen and temperature were assayed using an oximeter (WTWoxi 33oi, Weilheim, Germany), whereas the measurement of other water quality parameters followed the methods of Tripathi and Govil (Citation2001). The three groups were deprived of the feed for 0 (C), 1 (S1) and 2 (S2) weeks, respectively. In this study, fish were fed to apparent satiation two times daily.
2.2. Sample collection
Three fish per tank (nine per treatment) were randomly sampled at the end of the experiment. Blood samples were rapidly collected from the caudal vein using heparinized syringes under anesthesia (clove powder 400 mg L−1) condition. Plasma was immediately detached after centrifuging blood samples in 3000 × g for 10 min and then stored at –70°C until immunological parameters and metabolites analyses.
2.3. Biochemical assays
Plasma biochemical parameters were analysed using an auto analyser (Technicon RA-1000, Technicon Instruments, New York, NY, USA), with commercial clinical investigation kits (Pars Azmoon Kit, Tehran, Iran). Plasma glucose levels were assayed by a standard enzymatic-colorimetric test, based on the glucose oxidase-peroxidase method using a commercial kit. Plasma total protein concentration was determined on the basis of the Bradford (Citation1976) method with a commercial clinical kit and using bovine serum albumin as a standard protein. Plasma albumin was colorimetrically detected according to Rehulka (Citation2000) and globulin was calculated by distracting albumin from total protein. Serum biochemical parameters including triacylglycerol (TG) and cholesterol (CHL) were determined with GPO-PAP and CHOD-PAP (commercial clinical kit) methods, respectively, according to Fynn-Aikins et al. (Citation1992).
2.4. Immunological assays
The natural haemolytic complement activity (ACH50) was measured by utilizing sheep red blood cells as target cells as described in Eslamloo et al. (Citation2013).
Peroxidase activity in plasma samples was determined using 3, 3′, 5, 5′ tetramethylbenzidine hydrochloride and hydrogen peroxide as the peroxidase enzyme substrate as in Eslamloo et al. (Citation2012).
Total antiprotease activity was assayed as an indicator of the plasma capacity for inhibiting trypsin activity (Magnadóttir et al. Citation1999). The antiprotease activity was expressed as the percentage of trypsin inhibition (Zuo & Woo Citation1997).
Lysozyme activity in serum was determined according to the method of Demers and Bayne (Citation1997). For this, a turbidometric method was used based on the lysis of the lysozyme-sensitive Gram-positive bacterium, Micrococcus lysodeikticus (Sigma) as described in Eslamloo et al. (Citation2013).
2.5. Statistical analysis
The Kolmogorove–Smirnov test was performed in a first step in order to estimate the normality of data. Later, according to the obtained data, statistical differences among the three groups were assayed by one-way ANOVA. Post-hoc comparisons between sample means were tested by Duncan's test and P < .05 was taken as the level of significance. All statistical analyses were performed by using SPSS, version 16 for windows.
3. Results
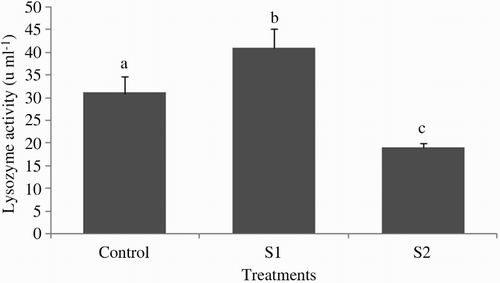
At the end of the experiment, the plasma ACH50 was significantly lower in the S2 group (26.37 ± 2.26) compared with S1 (37.12 ± 2.22) and control groups (42.25 ± 3.69) (P < .05; ). The effect of starvation periods on plasma peroxidase activity was noticeable; thus, peroxidase activity in fish starved for 2 weeks (0.85 ± 0.05) was significantly lower than those of starved for 1 week (1.14 ± 0.03) or fed continuously (1.27 ± 0.09) (P < .05; ). At the end of the experiment, the amount of total antiprotease activity in tinfoil barb did not markedly vary between the control and the feed-deprived groups (P > .05; ). Plasma lysozyme activity was significantly affected by starvation periods (P > .05; ) in all treatments. The highest and lowest levels of plasma lysozyme were found in the S1 group (40.87 ± 4.31) and S2 group (18.87 ± 1.02), respectively.
Figure 1. Plasma natural haemolytic complement activity (ACH50) of tinfoil barb (Barbonymus schwanenfeldii) Control: fed two times daily to apparent satiation; S1: deprivation for 1 week; S2: deprivation for 2 weeks. Different superscripts on each column indicate significant difference between feeding strategies (P < .05).
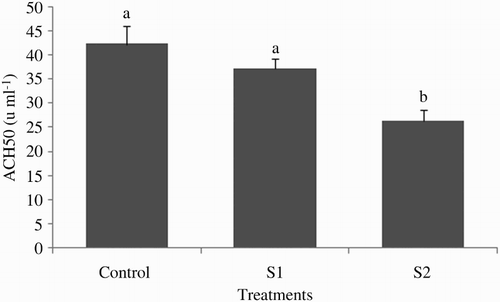
Figure 2. Plasma peroxidase activity of tinfoil barb (Barbonymus schwanenfeldii) Control: fed two times daily to apparent satiation; S1: dprivation for 1 week; S2: deprivation for 2 weeks. Different superscripts on each column indicate significant difference between feeding strategies (P < .05).
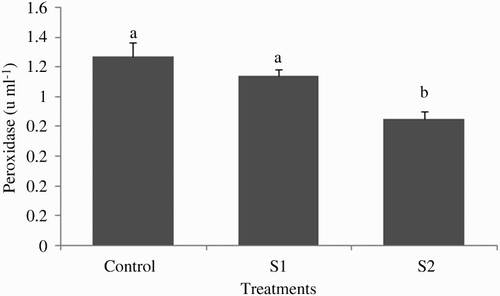
Figure 3. Plasma trypsin inhibition activity of tinfoil barb (Barbonymus schwanenfeldii) Control: fed two times daily to apparent satiation; S1: deprivation for 1 week; S2: deprivation for 2 weeks. No significant difference (P > .05) was observed between treatments.
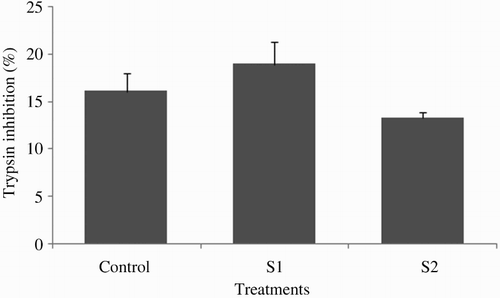
Figure 4. Plasma lysozyme activity of tinfoil barb (Barbonymus schwanenfeldii) Control: fed two times daily to apparent satiation; S1: deprivation for 1 week; S2: deprivation for 2 weeks. Different superscripts on each column indicate significant difference between feeding strategies (P < .05).
Plasma glucose levels significantly decreased in the group starved for 2 weeks compared with other treatments (P < .05; ). The effect of short-term starvation on tinfoil barb biochemical parameters is presented in . The levels of plasma triglyceride were significantly higher in the control group than those of other groups (P < .05). There were significant differences between the control and the food-deprived groups in plasma cholesterol levels (P < .05). The levels of plasma total protein, albumin and globulin significantly declined in the control group than those of S1 and S2 groups (P < .05).
Figure 5. Plasma glucose levels of tinfoil barb (Barbonymus schwanenfeldii) measured in starved groups and control group (mean ± SE). Control: fed two times daily to apparent satiation; S1: deprivation for 1 week; S2: deprivation for 2 weeks. Different superscripts on each column indicate significant difference between feeding strategies (P < .05).
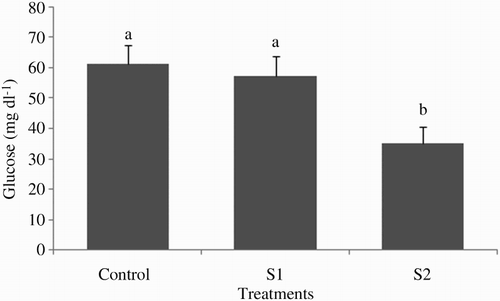
Table 1. Biochemical parameters of tinfoil barb (Barbonymus schwanenfeldii) measured in starved groups and control group (mean ± SE).
4. Discussion
The innate and specific immune responses of fish are reported to be affected by species, size, age, physiological status, environmental conditions and dietary (e.g. quality and quantity of diet) (Waagbø Citation1994; Watts et al. Citation2001; Magnadottir Citation2006). However, to our knowledge, few studies have assessed the immune responses of fish, particularly ornamental fish, to starvation periods. In the present study, there was no fish mortality during the experiment among the treatment groups during the experiment.
The complement activity is an important component of non-specific immune defense for protecting fish against potentially invasive organisms through lysis of their cellular membranes (Muller-Eberhard Citation1988). There are two activation pathways for complement in serum or plasma including classical pathway (CH50) and alternative pathway (SH50). Fish complement activity has been shown to be influenced by starvation (Sakai Citation1983; Caruso et al. Citation2010, Citation2012). It is demonstrated that stress (e.g. starvation) can affect both humoral and cellular components of the innate immune system in fish (Yin et al. Citation1995; Ortuno et al. Citation2001). In this study, alternative pathway of complement (ACH50) significantly decreased in the S2 group in comparison with other treatments. In addition, plasma peroxidase levels were significantly lower in fish fasted for 2 weeks, compared with control and fish fasted for 1 week. Sakai (Citation1983) and Caruso et al. (Citation2010, Citation2012) have reported that starvation periods decrease haemolytic activity (SH50) in coho salmon (Oncorhynchus kisutch), rainbow trout (Oncorhynchus kisutch), European eel (Anguilla anguilla) and red porgy (Pagrus pagrus), respectively. It has been suggested that there is a correlation between the duration of food deprivation and changes in haemolytic activity (Sakai Citation1983). In the present study, a decrease in complement activity and plasma peroxidase level of tinfoil barb in response to starvation can be indicative of impaired immunity.
The plasma antiprotease activities of host are known as anti-enzymes that comprise a capacity for delaying or inhibiting pathogens through stimulation to release proteolytic enzyme (Magnadottir Citation2006). No information is available about effect of starvation on plasma antiprotease activities. In the present study, starvation periods did not significantly change fish plasma trypsin inhibition activity, an inhibitory factor of the non-specific immune response, even though the amount of this factor in the control group was slightly lower than those in the other groups.
Lysozyme variations depend on several factors, such as species, nutritional status, sex, life stage and the studied tissue (Bowden Citation2008; Saurabh & Sahoo Citation2008). In the present study, plasma lysozyme activity significantly increased in fish fasted for 1 week, compared with the control. Additionally, plasma lysozyme activity significantly diminished in the 2-week starvation group. Similarly, Caruso et al. (Citation2010, Citation2011) found a significant decrease in the plasma lysozyme activity of European eel and blackspot sea bream (Pagellus bogarave) after 31 days starvation. One the other hand, no effect of starvation periods has been detected in lysozyme activity of European sea bass (Dicentrarchus labrax) and red porgy (Caruso et al. Citation2011, Citation2012). Moreover, starvation for 42 and 58 days did not significantly affect the lysozyme activity of European eel (Caruso et al. Citation2010). Apparently, the influence of fasting on fish lysozyme activity could vary by the duration of starvation and fish species. The increased plasma lysozyme activity of S1 fish in our study could probably be attributed to individual variations of fish used in each treatment. However, no clear explanation was found for this result.
In the present study, plasma glucose level was significantly lower in the S2 group than those of S1 and control fish, indicating that tinfoil barb is unable to maintain plasma glucose levels for 2 weeks starvation. In agreement with our results, Power et al. (Citation2000) in sea bream (Sparus aurata), De Pedro et al. (Citation2003) in tench (Tinca tinca), Perez-Jimenez et al. (Citation2007, Citation2012) in European sea bass (Dicentrarchus labrax) and dentex (Dentex dentex) and Ceinos et al. (Citation2008) in the rainbow trout (Oncorhynchus mykiss) have observed a reduction in plasma glucose levels during starvation periods. In contrast, other studies have reported that plasma glucose levels were maintained at a constant level during the different periods of starvation (Hochachka & Sinclair Citation1962; Barcellos et al. Citation2010; Caruso et al. Citation2011; Caruso et al. Citation2012). The differences in results between studies could be due to differences between species, nutritional status, different tissues for lipids storage, and the applied strategies for mobilizing energy reserves as well as the duration and severity of starvation (Navarro & Gutiérrez Citation1995; Pėrez-Jimenez et al. Citation2007; Caruso et al. Citation2010).
The results of this study indicated that the plasma triglyceride levels of fish in the various treatments were significantly affected by starvation periods. There were also significant differences between the plasma cholesterol levels of the deprived fish for 2 weeks and control group. Triglycerides are the most available lipid reserve during the early phases of food deprivation (Navarro & Gutiérrez Citation1995). Pérez-Jimenez et al. (Citation2007) have demonstrated that starvation can decrease in plasma total triglyceride and cholesterol levels during food deprivation periods. Numerous studies have reported a reduction in plasma triglyceride and cholesterol levels during starvation (Hung et al. Citation1997; Polakof et al. Citation2006; Pérez-Jiménez et al. Citation2007; Costas et al. Citation2011; Furné et al. Citation2012; Perez-Jimenez et al. Citation2012). The outcome of the present results and other studies revealed that there will be a decline in glycogen reserves, during the food deprivation period followed by decreased plasma glucose level. Consequently, epinephrine and glucagon hormones are released in response to lowered plasma glucose levels; thus, gluconeogenesis and lipolysis processes are activated and will bring on the mobilization of the available fat reserves such as triglycerides and cholesterols (Larsson & Lewander Citation1973).
Proteins are the main serum components that are a basic requirement for efficient immune system (Kumar et al. Citation2005). Based on the present results, starvation periods had effects on plasma total protein, albumin and globulin; in fact these parameters in the deprived groups were significantly higher than the control group. Similar to the results of present study, Hung et al. (Citation1997), Power et al. (Citation2000), Furné et al. (Citation2012) and Ashouri et al. (Citation2013) have reported an increase in plasma protein of several fish species as a result of starvation. In contrast, some studies on teleosts fish have reported the increased levels of plasma protein in response to food deprivation (Heming & Paleczny Citation1987; Friedrich & Stepanowska Citation2001; Polakof et al. Citation2006; Costas et al. Citation2011; Perez-Jimenez et al. Citation2012). Unfortunately, no information regarding plasma albumin and globulin due to starvation is available. However, more research is needed to expand knowledge on the variation of plasma-free amino acids, other metabolites and liver reserves in tinfoil barb during starvation. The increased plasma total protein, albumin and globulin levels in our study suggest that this species mobilize protein reserves as the fourth priority after glycogen, glucose and fat during starvation for obtaining the required energy for metabolism.
In conclusion, the present study indicated that all non-specific immune parameters of tinfoil barb, except for plasma trypsin inhibition activity, were decreased in fish fasted for a 2-week period. Therefore, starvation for 2 weeks leads to a negative effect on the immune response of tinfoil barb. The results of this study showed significant changes in plasma glucose levels and other metabolites in this species after feed deprivation that are indicative of the relationship between starvation effects and the extension of starvation period.
Disclosure statement
No potential conflict of interest was reported by the authors.
References
- Ashouri GH, Yavari V, Bahmani M, Yazdani MA, Kazemi R, Morshedi V, Fatollahi M. 2013. The effect of short-term starvation on some physiological and morphological parameters in juvenile Siberian sturgeon, Acipenser baerii (Actinopterygii: Acipenseriformes: Acipenseridae). Acta Ichthyologica et Piscatoria. 43(2):145–150. doi:10.3750/AIP2013.43.2.07
- Bailey R, Cole B. 1999. Spawning the tinfoil barb, Barbodes schwanenfeldi in Hawaii. Aquafarmer Information Sheet. Publication No. 136. Center for Tropical and Subtropical Aquaculture. University of Hawaii, Honolulu, HI, USA, 8 pp.
- Barcellos LJG, Marqueze A, Trapp M, Quevedo RM, Ferreira D. 2010. The effects of fasting on cortisol, blood glucose and liver and muscle glycogen in adult jundia Rhamdia quelen. Aquaculture. 300:231–236. doi:10.1016/j.aquaculture.2010.01.013
- Blasco J, Fernfindez J, Gutierrez J. 1992. Fasting and refeeding in carp, Cyprinus carpio L.: the mobilization of reserves and plasma metabolite and hormone variations. J Comp Physiol. 162(B):539–546.
- Boetius I, Boetius J. 1985. Lipid and protein content in Anguilla anguilla during growth and starvation. Dana. 4:1–17. doi:10.1089/dna.1985.4.1
- Bowden TJ. 2008. Modulation of the immune system of fish by their environment. Fish Shellfish Immunol. 25:373–383. doi:10.1016/j.fsi.2008.03.017
- Bradford MM. 1976. A rapid and sensitive method for the quantification of microgram quantities of protein. Anal Biochem. 72:248–258. doi:10.1016/0003-2697(76)90527-3
- Caruso G, Denaro MG, Caruso R, Genovese L, Mancari F, Maricchiolo G. 2012. Short fasting and refeeding in red porgy (Pagrus pagrus, Linnaeus 1758): response of some haematological, biochemical and non specific immune parameters. Mar Environ Res. 81:18–25. doi:10.1016/j.marenvres.2012.07.003
- Caruso G, Denaro MG, Caruso R, Mancari F, Genovese L, Maricchiolo G. 2011. Response to short term starvation of growth, haematological, biochemical and non-specific immune parameters in European sea bass (Dicentrachus labrax) and blackspot sea bream (Pagellus bogaraveo). Mar Environ Res. 72:46–52. doi:10.1016/j.marenvres.2011.04.005
- Caruso G, Maricchiolo G, Micale V, Genovese L, Caruso R, Denaro MG. 2010. Physiological responses to starvation in the European eel (Anguilla anguilla): effects on haematological, biochemical, non-specific immune parameters and skin structures. Fish Physiol Biochem. 36:71–83. doi:10.1007/s10695-008-9290-6
- Ceinos RM, Polakof S, Rodriguez Illamola A, Soensas JL, Miguez JM. 2008. Food deprivation and refeeding effects on pineal in doles metabolism and melatonin sylatoninsynthes in the rainbow trout Oncorhynchus mykiss. Gen Comp Endocrinol. 156:410–417. doi:10.1016/j.ygcen.2008.01.003
- Costas B, Aragão C, Ruiz-Jarabo I, Vargas-Chacoff L, Jesús Arjona F, Dinis MT, Mancera JM, Conceição LEC. 2011. Feed deprivation in Senegalese sole (Solea senegalensis Kaup, 1858) juveniles: effects on blood plasma metabolites and free amino acid levels. Fish Physiol Biochem. 37:495–504. doi:10.1007/s10695-010-9451-2
- Davis KB, Gaylord TG. 2011. Effect of fasting on body composition and responses to stress in sunshine bass. Comp Biochem Physiol. 158(A):30–36. doi:10.1016/j.cbpa.2010.08.019
- Demers NE, Bayne CJ. 1997. The immediate effects of stress on hormones and plasma lysozyme in rainbow trout. Dev Comp Immunol. 21:363–73. doi:10.1016/S0145-305X(97)00009-8
- De Pedro N, Delgado MJ, Gancedo B, Alonso-Bedate M. 2003. Changes in glucose, glycogen, thyroid activity and hypothalamic catecholamine's in tench by starvation and re-feeding. J Comp Physiol. 173(B):475–481. doi:10.1007/s00360-003-0355-7
- Echevarría G, Martínez-Bebiá M, Zamora S. 1997. Evolution of biometric indices and plasma metabolites during prolonged starvation in European sea bass (Dicentrarchus labrax, L). Comp Biochem Physiol. 118(A):111–123. doi:10.1016/S0300-9629(96)00416-1
- Eslamloo K, Akhavan SR, Henry MA. 2013. Effects of dietary administration of Bacillus probiotics on the non-specific immune responses of tinfoil barb, Barbonymus Schwanenfeldii (Actinopterygii: Cypriniformes: Cyprinidae). Acta Ichthyologica et Piscatoria. 43(3):211–218. doi:10.3750/AIP2013.43.3.05
- Eslamloo K, Falahatkar B, Yokoyama S. 2012. Effects of dietary bovine lactoferrin on growth, physiological performance, iron metabolism and non-specific immune responses of Siberian sturgeon Acipenser baeri. Fish Shellfish Immunol. 32:976–985. doi:10.1016/j.fsi.2012.02.007
- Falahatkar B. 2012. The metabolic effects of feeding and fasting in beluga Huso huso. Mar Environ Res. 82:69–75. doi:10.1016/j.marenvres.2012.09.003
- Friedrich M, Stepanowska K. 2001. Effects of starvation on nutritive value of carp (Cyprinus carpio L) and selected biochemical components of its blood. Acta Ichthyologica et Piscatoria. 31(2):29–36. doi: 10.3750/AIP2001.31.2.03
- Furné M, Morales AE, Trenzado CE, García-Gallego M, Hidalgo MC, Domezain A, Rus AS. 2012. The metabolic effects of prolonged starvation and refeeding in sturgeon and rainbow trout. J Comp Physiol. 182(B):63–76. doi:10.1007/s00360-011-0596-9
- Fynn-Aikins K, Hung SSO, Liu W, Li H. 1992. Growth, lipogenesis and liver composition of juvenile white sturgeon fed different levels of D-glucose. Aquaculture. 105:61–72. doi:10.1016/0044-8486(92)90162-E
- Heming TA, Paleczny EJ. 1987. Compositional changes in skin mucus and blood serum during starvation of trout. Aquaculture. 66:265–273. doi:10.1016/0044-8486(87)90112-8
- Hochachka PW, Sinclair AC. 1962. Glycogen stores in trout tissues before and after stream planting. J Fish Res Board Can. 19:127–136. doi:10.1139/f62-007
- Hung SSO, Liu W, Li H, Storebakken T, Cui Y. 1997. Effect of starvation on some morphological and biochemical parameters in white sturgeon, Acipenser transmontanus. Aquaculture. 151:357–363. doi:10.1016/S0044-8486(96)01506-2
- Kirchner S, Seixas P, Kaushik S, Panserat S. 2005. Effects of low protein intake on extra-hepatic gluconeogenic enzyme expression and peripheral glucose phosphorylation in rainbow trout (Oncorhynchus mykiss). Comp Biochem Physiol. 140(B):333–340. doi:10.1016/j.cbpc.2004.10.019
- Kiron V. 2012. Fish immune system and its nutritional modulation for preventive health care. Anim Feed Sci Technol. 173:111–133. doi:10.1016/j.anifeedsci.2011.12.015
- Kumar S, Sahu NP, Pal AK, Choudhury D, Yengkokpam S, Mukherjee SC. 2005. Effect of dietary carbohydrate on haematology, respiratory burst activity and histological changes in L. rohita juveniles. Fish Shellfish Immunol. 19:331–344. doi:10.1016/j.fsi.2005.03.001
- Larsson A, Lewander K. 1973. Metabolic effects of starvation in the eel, Anguilla anguilla L. Comp Biochem Physiol. 44(A):367–374. doi:10.1016/0300-9629(73)90489-1
- Magnadottir M. 2006. Innate immunity of fish (overview). Fish Shellfish Immunol. 20:137–151. doi:10.1016/j.fsi.2004.09.006
- Magnadóttir B, Jónsdóttir H, Helgason S, Björnsson B, Jørgensen TØ, Pilström L. 1999. Humoral immune parameters in Atlantic cod (Gadus morhua L.): the effects of environmental temperature. Comp Biochem Physiol. 122(B):173–180. doi:10.1016/S0305-0491(98)10156-6
- McCue MD. 2010. Starvation physiology: reviewing the different strategies animals use to survive a common challenge. Comp Biochem Physiol. 156(A):1–18. doi:10.1016/j.cbpa.2010.01.002
- Mommsen TP. 1998. Growth and metabolism. In: Evans DH, editor. The physiology of fishes 2nd ed. Boca Raton: CRC Press LLC, p. 65–97.
- Muller-Eberhard HJ. 1988. Molecular organization and function of the complement system. Annu Rev Biochem. 57:321–47. doi:10.1146/annurev.bi.57.070188.001541
- Navarro I, Gutiérrez J. 1995. Fasting and starvation. In: Hochachka PW, Mommsen TP, editor. Biochemistry and molecular biology of fishes, vol. 4. New York: Elsevier; p. 393–433.
- Ortuno J, Esteban MA, Meseguer J. 2001. Effects of short-term crowding stress on the gilthead seabream (Sparus aurata L.) innate immune response. Fish Shellfish Immunol. 11:187–197. doi:10.1006/fsim.2000.0304
- Perez-Jimenez A, Cardenete G, Hidalgo MC, Garcia-Alcazar A, Abellan E, Morales AE. 2012. Metabolic adjustments of Dentex dentex to prolonged starvation and re-feeding. Fish Physiol Biochem. 38:1145–1157. doi:10.1007/s10695-011-9600-2
- Pérez-Jiménez A, Guedes MJ, Morales AE, Oliva-Teles A. 2007. Metabolic responses to short starvation and refeeding in Dicentrarchus labrax. Effect of dietary composition. Aquaculture. 265:325–335. doi:10.1016/j.aquaculture.2007.01.021
- Polakof S, Arjona FJ, Sangiao-Alvarellos S, Martin del Rio MP, Mancera JM, Soengas JL. 2006. Food deprivation alters osmoregulatory and metabolic responses to salinity acclimation in gilthead sea bream Sparus auratus. J Comp Physiol. 176(B):441–452. doi:10.1007/s00360-006-0065-z
- Power DM, Melo J, Santos CRA. 2000. The effect of food deprivation and re-feeding on the liver, thyroid hormones and transthyretin in sea bream. J Fish Biol. 56:374–387. doi:10.1111/j.1095-8649.2000.tb02112.x
- Rehulka J. 2000. Influence of astaxanthin on growth rate, condition, and some blood indices of rainbow trout, Oncorhynchus mykiss. Aquaculture. 190:27–47. doi:10.1016/S0044-8486(00)00383-5
- Sakai DK. 1983. Lytic and bactericidal properties of salmonid sera. J Fish Biol. 23:457–466. doi:10.1111/j.1095-8649.1983.tb02926.x
- Saurabh S, Sahoo PK. 2008. Lysozyme: an important defence molecule of fish innate immune system. Aquacult Res. 39:223–239. doi:10.1111/j.1365-2109.2007.01883.x
- Tripathi BD, Govil SR. 2001. Water pollution (An experimental approach). New Delhi, India: CBS Publishers and Distributors.
- Waagbø R. 1994. The impact of nutritional factors on the immune system in Atlanctic salmon Salmo salar L.: a review. Aquacult Res. 25:175–197. doi:10.1111/j.1365-2109.1994.tb00573.x
- Watts M, Munday BL, Burke CM. 2001. Immune responses of teleost fish. Aust Vet J. 79:570–574. doi:10.1111/j.1751-0813.2001.tb10753.x
- Yarmohammadi M, Shabani A, Pourkazemi M, Soltanloo H, Imanpour MR. 2012. Effect of starvation and re-feeding on growth performance and content of plasma lipids, glucose and insulin in cultured juvenile Persian sturgeon (Acipenser persicus Borodin, 1897). J Appl Ichthyol. 28:692–696. doi:10.1111/j.1439-0426.2012.01969.x
- Yin Z, Lam TJ, Sin YM. 1995. The effects of crowding stress on the non-specific immune response in fancy carp (Cyprinus carpio L.). Fish Shellfish Immunol. 5:519–529. doi:10.1016/S1050-4648(95)80052-2
- Zuo X, Woo PTK. 1997. Natural anti-proteases in rainbow trout, Oncorhynchus mykiss and brook charr, Salvelinus fontinalis and the in vitro neutralization of fish α2-macroglobulin by the metalloprotease from the pathogenic haemoflagellate, Crytobia salmositica. Parasitology. 114:375–381. doi:10.1017/S0031182096008578
