
ABSTRACT
In this study, individual cow performance for milk yield, fat yield, protein yield, liveweight and longevity were simulated using a stochastic approach. Additive genetic effects, permanent and temporary environmental effects, and herd and age effects were included in the model along with inclusion of Mendelian sampling. The model generated 10,000 Pabna cows distributed across 200 herds with the herd size ranging between 40 and 60 milking cows. The model ran for 20 years with bulls being selected based on daughter production (progeny testing (PT)) in one scenario and on parent average genetic merit in another. Selection of replacement cows and bulls was based on one of three following objectives: genetic merit for milk yield, milk and survival, and total genetic merit which included all five traits. Each year, 150 cows with the best predicted genetic merit were selected for the production of replacements. The breeding scheme using selection of new bulls and cows based on parent average showed higher genetic gains than the PT for all selection objectives due to the differences between generation interval, accuracy and size of the progeny group/bull. The highest genetic gain was obtained when the selection objective was for milk yield genetic merit (US$15.02/year) compared with total genetic merit (US$10.95/year).
1. Introduction
The breeding objective is a statement of the economic worth of an animal from a genetic perspective (Harris et al. Citation1984; Harris and Newman Citation1994), which can be defined as the combination of economically important traits desirable to improve the achievement of the breeding goal. After setting the breeding objectives it is important to decide which traits can be used to select individuals for breeding, and these traits being known as selection criteria. A selection objective allows animals to be ranked with a single value, termed the aggregate value or index value, which balances the good and poor attributes of each individual. This index can be termed the total merit and is calculated as the sum of the breeding values for each trait each weighted by its economic value (EV). A total economic merit index provided greater economic returns for animal evaluation, than a single trait merit index (Miglior et al. Citation2005).
The traits such as fertility, longevity and resistance to diseases are important for the genetic evaluation of cows and young bulls, but estimations of the breeding values of these traits have less accuracy due to low heritabilities. Among these traits, longevity is an important trait, which affects dairy farm profitability (Madgwick and Goddard Citation1989).
More rapid genetic gains are possible if superior sires are selected and kept for breeding purpose. Sires and cows can be selected on the basis of their dams and/or progeny performance, and their own performance, respectively.
Currently unsystematic dairy cattle genetic improvement programmes operating under the Bangladesh Milk Producers’ Cooperative Union Limited (BMPCUL) are constrained by small herd size, lack of logistical, financial and infrastructure support and inadequate information on different traits and current market values of different items. This means that the experimental analysis using industry herd information is difficult and largely unachievable. Therefore, the use of stochastic computer simulation models is helpful in examining potential genetic improvement programmes for possible future use (Sørensen et al. Citation1992).
The present study was undertaken with the objectives (i) to develop a multi-trait simulation model using a stochastic approach, (ii) to evaluate two breeding schemes with three different selection objectives considering different traits over 20 years of selection and mating and (iii) to study the correlated responses on longevity with other traits.
2. Materials and methods
2.1. Simulation of breeding values and phenotypic observations
In this simulation study, Pabna dairy cattle were considered as a model breed under BMPCUL. The three selection objectives applied were milk yield, milk yield and survivability, and total merit (milk yield, protein yield, fat yield, longevity and liveweight) and these three objectives were applied in two selection schemes (progeny testing (PT) and parent average testing (PAT)). Traits considered as the selection criteria were milk yield, fat yield, protein yield, liveweight and longevity. These traits were considered as they are heritable, correlated and easily measurable, and were adjustable for measurable environmental variation. Genetic parameters were obtained from the literature and their genetic (co)variance matrix was positive definite. The sires and cows to be parents of the next generation were selected on a total index under all three selection objectives, which gave appropriate weights to five traits, thus affecting profitability.
The five traits (milk yield, fat yield, protein yield, liveweight and longevity) of dairy cows were simulated over 20 years with the following model based on quantitative genetic principles (Falconer and Mackay Citation1997).
where Yijkn is the phenotypic value of each of the traits; µ is the overall mean of the population; Hi is the effect of herd; Aj is the effect of age; Gn is the additive genetic effect; Pn is the permanent environmental effect and Eijkn is the temporary effect. The effects of dominance and epistasis were not modelled in this study.
A total of 10000 cows under 200 herds, each herd size ranging from 40 to 60 cows and age structures from 4 to 10 years, were simulated. Phenotypic standard deviations, economic weights and age effects and the (co)variance matrices of herd effects, additive genetic values, permanent and temporary environmental effects were calculated from the parameters given in and and supplementary Table 1. Similar correlations were used for temporary and permanent (co)variances.
Table 1. Simulated traits, their means, standard deviations, EVs and age effects.
Table 2. Genotypic and phenotypic correlations between traits used in the model (Khan, Citation2009).
The herd effects were assumed to be 10–15% of the variation from the phenotypic standard deviations. The vector of herd effects (Hi) of the traits was generated as the product of a Cholesky decomposition matrix of herd effect (co)variance matrix (HD) and a vector of randomly selected pseudo-normal deviates (Φi). The Hi vector was generated as: Hi = HD * Φi.
The age effect was assumed from the mean deviation and was set to 0 for age year 6 and 7. No age adjustments were considered for longevity, therefore cows remained in the herd according to their higher breeding value for longevity. All other age groups were assumed to perform more poorly than the 6 and 7-year-old cows (). The age effect was added to each trait along with the effects of herd, additive genetic and environmental effects.
The genotypic variance () of the base cows was calculated as
, where h2 is the heritability of the traits and
the phenotypic variance for the traits.
A vector of additive genetic values (Gn) for all the traits was generated as the product of a Cholesky decomposition matrix of the genetic (co)variance matrix (AD) and a vector of randomly selected pseudo-normal deviates (Φi). The Gn was generated as
The breeding value of the progeny was simulated as follows:
where GS and GD are the breeding values of the sire and dam, respectively, Fi(Sire) and Fi(Dam) is the coefficient of inbreeding of sire and dam, respectively, and M is the Mendelian sampling deviation as: M = MD * Φi, where MD is the Cholesky decomposition matrix of the genetic (co)variance matrix, which was calculated in consideration of Mendelian sampling and Φi is a vector of randomly selected pseudo-normal deviates.
The temporary () and permanent (
) environmental (co)variances were also calculated separately and the vector of environmental (temporary and permanent) effects (E) for the ith trait was generated as the product of a Cholesky decomposition matrix of environmental variance covariance matrix (ED) and a vector of randomly selected pseudo-normal deviates (Φi) separately. The E was generated as: E = ED * Φi. The temporary and permanent environmental (co)variances are presented in supplementary Table 1.
To generate deviates, D, a Cholesky decomposition was applied to the matrices. The decomposed matrix was post-multiplied by a vector of pseudo-random deviates N(0,1) which returned a vector of correlated pseudo-random numbers. In matrix notation,
where Di is the random multivariate normal deviate of the ith trait, τi,j results from the Cholesky decomposition of the genetic (co) variance matrix, Φi represents randomly selected pseudo-normal deviates for the ith trait and 1, 2, 3, 4 and 5 represent milk yield, fat yield, protein yield, liveweight and longevity, respectively.
All the genotypic and phenotypic parameters are contained in an input file and can be changed to simulate populations with different parameters and scenarios. The variance–covariance structures were assumed to be constant through the entire simulation period.
The base population at steady state simulated all the unrelated cows together. Ninety per cent of the base cows were selected randomly for the first year and maintained up to year four, subsequently 80% of the cows were selected from the previous year's herd, and the remaining 20% from the new progeny. Offspring production and the phenotypic values of the base year cows were changed every year with the change of age and temporary environmental effects. For the production of offspring for the next generation under parent average and PT breeding schemes, the parameters given in were used. For all 20 years of simulation, the estimated breeding values (EBVs) of longevity were set as functions in the model, such that 5% of cows were automatically culled each year as a fixed term according to the lower EBV of longevity. Selected base cows and progeny born in same year were kept together for further evaluation of all five traits.
2.2. Genetic evaluation
EBVs were obtained from a univariate analysis of the base population and from a multivariate analysis of the later generations based on restricted maximum likelihood using the average information matrix as second derivatives in a quasi-Newton procedure using AIREML software (Johnson and Thompson Citation1995). The model of analysis was presented as
where y is vector of phenotypic values; e is the vector of error terms; u is the vector of animal breeding values, random; Z is a matrix relating phenotypic records with animal breeding values; X is a matrix relating phenotypic records with fixed effects and b is a vector of fixed effects, considering all the effects used in the simulation model.
2.3. Selection using PAT performance
Selection based on total merit, was carried out on bulls, heifers and cows. The animal's genes were transmitted to the next generation in four pathways (bulls to breed bulls, bulls to breed cows, cows to breed bulls and cows to breed cows) (Rendel and Robertson Citation1950). The mortality and culling rate for conformation and semen quality for 5, 6 and 7-year-old bulls was 12%. Each year, five bulls were selected based on the total genetic merit of their dams from the bull calves born in the central herd. It was assumed that on average 4000 semen doses per year were used per bull (), and that each bull was available for up to 3 years in the breeding programme.
Table 3. Population biological and technical parameters for the simulation study.
Each year, the 150 genetically best active cows were selected and mated to the 5 selected bulls. In year one, the best (based on total merit) bulls were mated with all base cows and it was assumed that the average progeny breeding value for year one was zero. From years one to four the same best base bulls were used and from years 5 to 20, the best bulls and cows from progeny born within a year were selected and mated. Each year, 20% of the cows were replaced by heifers. In the breeding scheme, cows were used up to 10 years of age, therefore by the ninth year of simulation the entire base herd was replaced by cows of higher genetic merit.
The average genetic merit of all cows born in a particular year was considered as the average genetic merit of the herd for the purpose of calculating the genetic gain. The genetic gain was calculated in 3 periods: from the base year to year 9; from year 9 to 20 years and an overall gain from the base year to year 20. The asymptotic genetic gain for this population was derived by calculating the year-by-year change in genetic values.
2.4. Selection by using PT
A total of 10,000 cows from the 200 different herds were simulated for the PT purpose. However, only 1400 cows were selected and used for testing purpose by natural service. The number of bulls required annually for this herd was approximately 40 (Robertson Citation1957) if 60% of the cows were assumed to be in estrus. The herd bulls were used by natural service (bull to cow ratio was 1:20). The remaining cows were bred by AI and the information from all 10,000 cows was considered when choosing the breeding bulls. The young bulls used for progeny test insemination were selected from the bull calves of the 150 active cows in each year. After PT the best five bulls were selected for the production of replacement bulls and cows, on the basis of their progeny merit. Progeny tests were completed when the bulls were 8 years old because the bulls entered into the PT programme when they were 4 years old.
The mating strategy and calculation of genetic gains was similar to the PAT scheme based on the information provided in .
2.5. Scenarios between selection objectives and selection schemes
Genetic gain and correlated responses were evaluated within six scenarios that combined three selection objectives (selection for milk merit, milk and survival merit, and total merit) and two selection schemes (progeny and PAT). The averaged selection intensities for parent average () and progeny performance (
) schemes were based on the four pathways of selection and differed with the different breeding structure of the two schemes.
The economic selection index values for each animal were calculated as sum of the product of trait EBVs and trait EVs using EVs from Khan (Citation2009). For the milk yield objective, only the EV of milk yield was used, with the EV of all other traits being set to 0. The selection index values for the selection objective of milk and survival merit were calculated by the product of EBVs and the EVs of the two traits (milk and longevity) and the EV of the remaining traits was set to 0. For the selection objective of total merit, the economic selection index value was estimated as the product of EBVs and the EVs of all five traits.
Selection responses for all five traits were calculated from the regression of traits values on the economic selection index.
All combinations were simulated with ten replicates. From these data the average genetic merit for animals born within a year was calculated. Yearly results from all simulation models were analysed by using MIXED procedure of SAS (SAS Citation2000). Stochastic simulation allowed the estimation of correlated responses for all traits considered in the simulation.
3. Results and discussion
The annual rates of genetic gain in the objective traits and milk merit following 20 years of selection for the 2 breeding schemes and three selection objectives for cows and bulls are presented in and . The rate of genetic gain in these traits for breeding bulls following 20 years of selection for the two breeding schemes and milk, survival and total merit scenarios are presented in supplementary Table 2.
Table 4. Mean and standard error (se) of genetic gain (Δg) in US$ per year and R2 value of milk traits, liveweight and longevity of the simulated cow population under PAT and PT selection schemes with a selection objective for milk merit.
Table 5. Mean and standard error (se) of genetic gain (Δg) in US$ per year and R2 value of milk traits, liveweight and longevity of the simulated bull population under PAT and PT selection schemes with a selection objective for milk merit.
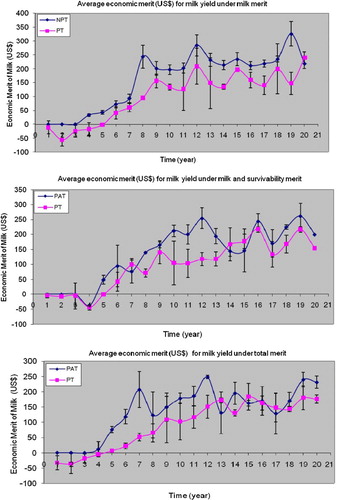
The change in average economic merit (US$) with the standard deviation of a particular birth year for cows for different traits was plotted. The pattern of the curve shapes was similar for all traits, therefore for example only the milk yield of milk merit, milk and survival merit, and total merit () over 20 years of cows are shown.
Figure 1. Average economic merit with standard deviation (bar) for milk yield under PAT and PT breeding scheme with different selection objectives for all cows born in a particular year.
3.1. Shape of the curves for responses of different traits
A rapid increase in economic merit was observed from year 3 or 4 up to year 9, after which the rate of increase for all traits became slower up to year 20 (). For both breeding schemes, the rate of genetic gain was zero or even negative from years 1 to 4. In (a) (milk merit selection) a rapid increase in genetic progress and subsequently an asymptotic response to the year 20 was observed with a similar pattern for milk and survival ((b)). Genetic progress steadily increased from year 5 to 12 ((b)) with rapid increases ((c)) from year 4 to 7, following which the gain declined due to the increased number of similar merit cows in the herd. However, for all the selection objectives, the genetic gains of the milk yield were shown to be steady under PT breeding schemes. For bulls, the steady progresses of all the selection objectives, in both breeding schemes were observed. Similar trends were achieved for fat yield, protein yield, liveweight and longevity for both cows and breeding bulls.
The genetic gains for all traits in both selection schemes and three selection objectives showed rapid progress from years 3 or 4 up to year 9. The primary reason for this rapid gain in years 5–9 compared to later years is that it requires nine years for all the unimproved base cows in the herd to be replaced.
The genetic trends up to year 4 were zero or negative and the genetic gain started from year 5 onwards. Cows calved at 4 years of age and therefore up to year 4 the base cows and base bulls were used for the production of progeny causing lower genetic trends to have occurred up to year 4. The selected bulls and cows have their first progeny in year 5. However, from year 5 and through the remaining years, the male and female progeny born by birth year 1 and onward were used. Higher genetic gains obtained in particular years might be due to the effects of sires and dams in those years. Genetic potentiality of parents was then passed on to the progeny, leading to higher genetic gains in the upcoming generation (Dzama et al. Citation2001). For breeding bulls, a comparatively lower rate of genetic gain was achieved compared with cows under PAT and PT breeding schemes for all three selection objectives of all the traits. In this study, 40 bulls were produced from 150 active cows and out of 40 bulls only 5 selected bulls were used in the breeding scheme. The progeny tests were completed when the bulls were 8 years old, because the bulls entered into the PT programme when they were 4 years old. Therefore, the lower genetic trends may be due to the greater generation interval of bulls.
3.2. Responses of different traits in cows vs. bulls
The annual rate of genetic gains from year 1 to 20 of different traits varied between cows and selected bulls in the two breeding schemes and three selection objectives ( and and supplementary Table 2). In the selection objective of milk merit using a PAT breeding scheme, the genetic gains for milk, fat and protein yield were similar in cows and bulls but the responses of liveweight and longevity for bulls were higher than the cows. Similar results were obtained under the PT breeding scheme, except for the protein yield, which was higher in cows than bulls. In the selection objective of milk and survival merit using the PAT breeding scheme, the genetic gains for milk yield and liveweight was higher in bulls than cows, but all other traits indicated similar results (supplementary Table 2). In this selection objective, using the PT breeding scheme, the genetic merit of longevity for cows was higher than bulls; all other traits showed similar responses for both cows and bulls. The annual rate of genetic gain in the selection objective, total merit under PAT breeding scheme was shown to be similar to the selection objective, milk and survival merit (supplementary Table 2). The only differences were observed in longevity and protein yield under the PT breeding scheme between bulls and cows.
The differences of the genetic gains between cows and bulls might be due to the effects of higher generation interval, selection intensity and accuracy. The generation interval and accuracy have a positive impact on responses (Rendel and Robertson Citation1950). The annual rate of genetic gain for fat and protein yield had no significant differences, between cows and bulls, but for liveweight and longevity, the breeding bulls were higher than cows in both PAT and PT breeding schemes in all selection objectives. Similar results were reported by Dzama et al. (Citation2001) for the response of liveweight.
3.3. Responses of traits under different selection objectives and the breeding schemes
Within the selection objectives between the breeding schemes, the annual rate of genetic gains for milk yield, liveweight and longevity was significantly different. The response of milk yield in the PAT breeding scheme under milk merit objectives was significantly higher than the total merit objectives for cows. The annual rate of genetic gains for fat and protein yield did not show any differences between selection objectives within the breeding scheme.
From the base year up to year 9, the PAT breeding scheme showed comparatively higher responses for all traits ( and ), in the three different selection objectives, compared with the PT breeding scheme for both cow and bull population.
The responses for all traits in all three selection objectives were higher in the PAT than the PT breeding scheme except for liveweight over the 20-year period. This might have been caused by there being only a small number of bulls used; the bull's generation interval was higher and also only a small herd size was simulated. In the PAT breeding scheme, only five superior bulls were selected each year. But in the PT breeding scheme, 40 bulls were progeny tested with 1400 cows each year and all cows were considered in this simulation. This may have led to lower responses per year, as all bulls were involved in PT, and more than 50% of the bulls were below average. This could have affected the lower genetic gains per year. In this study, selection intensities, accuracy of selection and generation intervals of 1.55 vs. 1.64, 0.57 vs. 0.59 and 6.3 year vs. 8 years for PAT vs. PT breeding schemes, respectively, were used in consideration of all selection pathways. The higher generation intervals and lower accuracies could also be a cause of lower genetic gains under PT. The lower numbers of active cows selected from the total population have led to higher selection intensities, and thus greater genetic gains. Similar results were reported by other investigators (Dekkers Citation1992; Everett Citation1984), who concluded that the size of the active cow population (potential bull mothers) has a significant effect on the rate of genetic gain, because high selection intensities can be achieved in the selection of bull mothers.
The genetic gains for milk yield per cow per year, of the PAT breeding scheme, exhibited 10% and 11% higher in the milk merit and milk and survival merit objectives, respectively, than the PT breeding scheme.
The differences in genetic gains between selection objectives were expected, since selection pressure was apportioned differently between the traits under selection by the use of different combinations of EVs. Sørensen et al. (Citation2006) noted the same effect when they observed lower genetic gains for selection of milk merit than that found in this study. This study reported higher genetic gain from milk merit for both selection schemes in comparison to total merit ( and ).
3.4. Responses of individual traits
The highest genetic gain (US$ 15.03/year or 29.3 litre milk/year) was achieved when the selection objective was for milk yield genetic merit compared with US$ 10.95/year or 21.2 litre/year when selection was on total genetic merit over 20 years of selection, and mating under the PAT breeding scheme. However, a lower genetic gain for longevity was observed in those scenarios. The genetic gains for milk yield in consideration of three selection objectives ranged from US$ 12.00/year or 23.3 litre/year to US$ 13.50/year or 26.2 litre milk/year for 20 years of selection and mating using PT for bulls and cows. The genetic gains of protein yield and liveweight, in the selection objective total merit under PAT breeding scheme was lower than all other selection objectives, and also the PT breeding scheme in this selection objective. However, all other traits in the three selection objectives, under the PAT and PT breeding schemes, showed intermediate responses.
In the case of breeding bulls, genetic gain for most of the traits was better for the milk merit and milk and survival merit breeding objectives than the total merit objective. However, the rate of genetic gain for milk yield, fat yield, protein yield and liveweight for the milk merit and milk and survival merit objectives, using a PAT breeding scheme, was lower than that for the total merit objective. On the other hand, using a PT breeding scheme, there were no differences found in fat yield, protein yield and liveweight between selection objectives.
The differences in genetic gains for individual traits were mostly due to differences in breeding scheme design and the selection objectives. While milk yield made the largest contribution to improved profit, the cost-reducing trait (longevity) contributed more than the milk quality traits (fat and protein yield). Similar findings were reported by Lassen et al. (Citation2007) and Sørensen et al. (Citation2006).
In the current model, from year 1 to 20 under all three selection objectives, the annual genetic progress obtained was from 1.2% to 1.6% and from 1.3% to 1.5%, of the mean in the PAT and the PT selection schemes, respectively. These values were higher than the 1% annual genetic gain reported by Lee et al. (Citation1985) but lower than the 2% reported by Specht and Mc Gilliard (Citation1960).
3.5. Correlated responses
The response in longevity is positively correlated with all other traits in the selection objectives for the two breeding schemes (), which indicates that selection for longevity could be achieved through selection for one or more correlated traits. However, different responses between selection schemes within a selection objective and between selection objectives were found. In this simulation, longevity was set to a function, that is, 5% of low survival cows were culled automatically during each year's simulation and leaving the higher longevity animals in the herd. This leads to higher genetic gains for all the traits as a positive correlated response. This could have increased the longevity of the cows. Other investigators (Madgwick and Goddard Citation1989; Wall et al. Citation2003) reported similar findings. Increasing longevity reduces replacement costs, changing herd structures to a higher proportion of older cows in the herd, allowing for an increased culling level for milk yield which leads to increased farm profits (Madgwick and Goddard Citation1989).
Table 6. Correlated response (CRY) with longevity and other traits in consideration of two breeding schemes within three selection objectives.
4. Conclusion
This study showed that the rate of genetic gains differs according to selection schemes and objectives. Selection of animals under PAT breeding schemes produced better gains in milk merit and milk and survival merit objectives than the PT breeding scheme. The model offered an opportunity to utilize longevity as a functional trait, leading to a higher productivity of cows, by increasing the productive life or herd life of the cows. The model developed in this study offers breeders from Bangladesh an opportunity to compare different selection objectives, and also evaluate different breeding schemes.
Supplementary_Tables_TAAR_1150844.doc
Download MS Word (104.5 KB)Acknowledgements
The authors would like to thank the Institute of Veterinary, Animal and Biomedical Sciences, Massey University, Palmerston North, New Zealand for their active cooperation and support to pursue this study. The authors are also very much grateful to Manager, Animal Breeding Section, Bangladesh Milk producer's Cooperative Union Limited for providing the base data. The authors are grateful to the New Zealand Ministry of Foreign Affairs and Trade for their financial support. The first author is funded by NZAID: Postgraduate scholarship for PhD studies sponsored by the ministry.
Disclosure statement
No potential conflict of interest was reported by the authors.
ORCID
M. K. I. Khan http://orcid.org/0000-0001-9344-322X
H. T. Blair http://orcid.org/0000-0003-4415-4282
N. Lopez-Villalobos http://orcid.org/0000-0001-6611-907X
Related Research Data
References
- Dekkers JCM. 1992. Structure of breeding programmes to capitalize on reproductive technology for genetic improvement. J Dairy Sci. 75:2880–2891.
- Dzama K, Walter JP, Ruvuna F, Sanders JO, Chimonyo M. 2001. Index selection of beef cattle for growth and milk production using computer simulation modelling. S Afr J Anim Sci. 31:65–75.
- Everett RW. 1984. Impact of genetic manipulation. J Dairy Sci. 67: 2812–2818.
- Falconer DS, Mackay TFC. 1997. Introduction to quantitative genetics. 4th ed. Harlow: Longmans Green; p. 122–159.
- Harris DL, Newman S. 1994. Breeding for profit: synergism between genetic improvement and livestock production: a review. J Anim Sci. 72:2178–2200.
- Harris DL, Stewart TS, Arboleda CR. 1984. Animal breeding programmes. A systematic approach to their design, USDA-ARS. AAT-NC 8:14.
- Johnson DL, Thompson R. 1995. Restricted maximum likelihood estimation of variance components for univariate animal models using sparse matrix techniques and average information. J Dairy Sci. 78:449–456.
- Khan MKI. 2009. Development of models for the genetic improvements of dairy cattle under cooperative dairying conditions in Bangladesh. PhD thesis, IVABS, Massey University, New Zealand. Available from: muir.massey.ac.nz/bitstream/10179/1378/1/02_whole.pdf.
- Khan MKI, Blair HT, Lopez-Villalobos N. 2012. Lactation curves of different cattle breeds under cooperative dairying conditions in Bangladesh. J Appl Anim Res. 40:179–85. Available from: www.tandfonline.com/dx.doi.org/10.1080/09712119.2011.645039.
- Lassen J, Sørensen MK, Madsen P, Ducrocq V. 2007. A stochastic simulation study on validation of an approximate multitrait model using pre-adjusted data for prediction of breeding values. J Dairy Sci. 90:3002–3011.
- Lee KL, Freeman AE, Johnson IP. 1985. Estimation of genetic change in the registered Holstein cattle population. J Dairy Sci. 68:2629–2638.
- Madgwick PA, Goddard ME. 1989. Genetic and phenotypic parameters of longevity in Australian dairy cattle. J Dairy Sci. 72:2624–2632.
- Miglior F, Muir BL, Van Doormaal BJ. 2005. Selection indices in Holstein cattle of various countries. J Dairy Sci. 88:1255–1263.
- Rendel JM, Robertson A. 1950. Estimation of genetic gain in milk yield by selection in a closed herd of dairy cattle. J Genet. 50:1–8.
- Robertson A. 1957. Optimum group size in progeny testing and family selection. Biometrics. 13:442–450.
- SAS. 2000. User's Guide: Statistics. 8th ed. Carry, NC: SAS Institute Inc.
- Sørensen JT, Kristensen ES, Thysen I. 1992. A stochastic model simulating the dairy herd on a PC. Agr Syst. 39:177–200.
- Sørensen MK, Berg P, Jensen J, Christensen LG. 2006. Stochastic simulation of breeding schemes for total merit in dairy cattle. Department of Animal Breeding & Genetics, the Royal Veterinary and Agricultural University, Groennegaardsvej 3, DK-1870 Frederiksberg C, Denmark.
- Specht LW, Mc Gilliard LD. 1960. Rates of improvement by progeny testing in dairy herds of various sizes. J Dairy Sci. 43:63–75.
- Wall E, Brotherstone S, Woolliams JA, Banos G, Coffey MP. 2003. Genetic evaluation of fertility using direct and correlated traits. J Dairy Sci. 86:4093–4102.