
ABSTRACT
This research was conducted to determine variance component, genetic parameters and breeding values (EBV) for the birth weight (BW) of Holstein calves. In this context, the direct genetic (), maternal genetic (
) and maternal permanent environmental effects, which affect BW, were separately assessed. The multi-trait, derivative-free restricted maximum likelihood programme was used for determining the effect of the genetic parameters by using models that either included or excluded the maternal genetic and/or permanent maternal environmental effects. The estimation of the BW of Holstein calves was optimized by evaluating six different models. The best model was chosen according to the log-likelihood ratio tests. Within the context of the study, a total of 4443 calves were investigated between 1987 and 2006. Among the six different models, model 4 was selected as the best model, since it had the lowest value for the likelihood ratio. The range of the values for direct heritability (
) and maternal heritability (m2) were between 0.07–0.13 and 0.04–0.09, respectively. In conclusion, an estimation of the genetic parameters for BW can be used as a selection criteria for Holstein calves.
1. Introduction
The Holstein is a breed of cattle commonly reared across Turkey, and the calves of this breed are often raised for their meat and milk. The birth weight (BW) of calves is a vital feature of cattle breeding that significantly affects meat and milk production (Bakır et al. Citation2004) as well as the animal’s growth performance. For this reason, BW is a parameter that is generally included in the selection criteria. The BW provides cues regarding a calf’s prenatal development, while also serving as an indicator about its growth following birth. BW is controlled by a multitude of genetic, maternal and environmental factors. Such factors may be associated with the genes of the calf, the genes of the dam or with environmental factors that affect the calf and/or the dam. The overall BW is a polygenic feature that is also influenced by environmental factors. Consequently, efforts to improve live weight through selection requires a consideration of both maternal and direct components (Meyer Citation1992, Citation1993). The number of studies evaluating in the BW of Holstein calves as well as the ram by employing restricted maximum likelihood (REML) is limited. The purpose of the present research was to examine the significance of maternal effects on BW of Holstein calves, applying six animal models including both environmental and genetic effects. Furthermore, the six models were also used to estimate the EBV and the relationships between direct genetic effects and maternal genetic effects.
2. Materials and methods
2.1. Data collection and preparation
The records for a 20-year period (1987–2006) were obtained from the Tahirova Official Farm in Turkey with data on a total of 4433 calves (2152 females and 2281 males) descending from 940 dams and 223 sires. There were on average 3.72 offspring for each dam.
The BW was measured utilizing a scale with 150 g sensitivity within 24 hours after birth. Abnormal records were removed from the data set.
2.2. A preliminary analysis
The fixed effects were determined by using the Minitab (Citation1998) software (version 12.1). Analyses were performed in each one of the models, by taking into account the effects associated with the year of birth, the sex of the calf and the type of calving. Dam age was considered as a linear covariate. Effects determined as non-significant were excluded from the models by using backwards elimination.
2.3. Estimation of variance component, genetic parameters and breeding values
Variance components and genetic parameters were estimated by multi- trait, derivative- free restricted maximum likelihood (MTDFREML) software package (Boldman et al. Citation1995). Six different models were used for each analysis. In all analyses a convergence criteria was used to the value of 10−9. Each analysis was also re-started to avoid a local maximum until reaching the global one. Dam age was considered as a covariate. Random effects associated with the calf, sire and dam were also considered. The parameters estimated by using the six animal models are provided in .
Table 1. Estimates of heritabilities and log-likelihood values.
The analysis was repeated with the estimates at earlier apparent convergence as the starting values until a global minimum of −2 log L was detected, when −2 log L values remained constant to the fifth denary after successive repetition (Lee and Taper Citation2002; Tilki et al. Citation2008). The parameters listed in were estimated using the six different animal models. In the models applied, the animal was considered as a random factor. The was added in the models as a random effect, with no correlation with the other effects in the models (Ap Dewi et al. Citation2002). The
was employed as a second random effect for animals with similar covariance as the direct effect. The models used in the analysis are summarized below.
Model 1: Yijklm = Fijk + al + eijklm
Model 2: Yijklmn = Fijk + al + Pm + eijklmn
Model 3: Yijklmn = Fijk + al + mm + eijklmn with σAM A = 0
Model 4: Yijklmn = Fijk + al + mm + ejiklmn with σAM A≠0
Model 5: Yijklmn = Fijk + al + mm + pm + eijklmn with σAM A = 0
Model 6: Yijklmn = Fijk + al + mm + pm + eijkmn with σAM A≠0
In these equations;
Yijklmn: standardized weights with dam and fixed effect composition.
al: σ2
a, pm: , mm:
, eijklmn: random error
Fijkl: fixed effects bmi + sj + byk + btl + θ(Xijkl − Y)
bmi: the effect of the birth season,
sj: the effect of the calf sex,
byk: the effect of the birth year,
btl: the effect of the birth type,
θ: the regression coefficiency of detected weights on dam age,
Xijkl: dam age, Y: mean dam age,
was determined using the next formula (Willham Citation1972):
The best equality was determined with the likelihood ratio test (Saatcı et al. Citation1999). This test involved comparing a value from the chi square distribution with the −2 Log L, and determining the difference between the two. EBV for BW was determined using the best model. For the EBV, genetic trends were calculated according to the years of birth.
3. Results and discussion
The were higher than the level of
for all traits. Six different model analysis results are summarized in and . In general, the
was higher than the
leading to lower estimates of m2 compared to
.
Table 2. Estimates of parameters and correlations.
3.1. Heritabilities
Model 1, fitting animal as the only random effect, produced considerably higher estimates for and
than other models. Likewise, higher heritability estimates for BW from model one have been informed for different cattle breeds (Abera et al. Citation2011; Sahin et al. Citation2012).
Observed and
(0.11) in model 1 were higher than those in the other models. Except for models 1, 2 and 3, estimated
and
were close to each other.
In model 1, where were disregarded,
was 0.11, while the inclusion of
in models 3, 4, 5 and model 6 decreased the
. When the
was added in the model,
ranged from 0.882 to 1.142.
According to models, the maternal effects were separated into two units, as environment and genetic. In model 2 decrease has been observed in both
and
compared to that in model 1. Including
with no
in model 3 resulted in lowest
and
compared to those estimated in models 4 and 6.
But, inserting with no
in model 4 resulted in higher
and
compared to those estimated in models 2, 3 and 5.
Model 4 ( removed) generated the highest
and
than models 2 and 5. Also, adding
in model 4 gave rise to the highest
and
than models 2 and 5. When the
was disregarded (model 4), the
was attributed to the
, emerging in overestimation of the m2 compared to model 3.
In model 5, was added but σam was removed. Consequently model 5 created lower
and
than the other models.
In model 6, when and
were included, 5% of the
was attributed to the
and 4.3% to the c2.
It was apparent that the model used for analysis considerably affected the relative values for maternal and direct heritability. In general, is lower than
, which leads to higher estimates of
compared to m2. In the current study, the
for BW varied between 0.09 and 0.26. Higher total heritability estimates varying between 0.37 and 0.62 were reported by Abera et al. (Citation2011) for Zebu and their crosses Jersey and Holstein cattle. Furthermore, Tilki et al. (Citation2008) and Sahin et al. (Citation2012) also determined higher
for Brown Swiss cattle.
Estimates of total heritability represent a useful mean for estimating response to selection based on the phenotypic value. Estimates can be influenced by the breeds, models and data size that are used (Solomon and Gemeda Citation2002).
In this research, according to chosen model, varied from 0.07 to 0.11 and m2 ranged from 0.04 to 0.09. Karabulut et al. (Citation2012) reported that estimates for
ranged from 0.02 to 0.48, m2 from 0.12 to 0.45, cam from −0.09 to −0.14, c2 from 0.01 to 0.24 and ram was −1.00 for Holstein calves, respectively. But then Tilki et al. (Citation2008) informed estimates of
from 0.15 to 0.37, m2 from 0.06 to 0.15, ram from 0.73 to 0.92, cam from 0.085 to 0.090, c2 from 0.001 to 0.083 for Brown Swiss calves, respectively. By the preferred model, m2 ranged from 0.04 to 0.09 for BW. Based on model 4 (the best model), the estimates of m2 for BW were 0.09 ± 0.039. In the study of Demeke and Neser Schoeman (Citation2003), a small (yet non-zero) estimate was also reported for maternal heritability for BW. This finding was similar to those in the study of Sahin et al. (Citation2012). Pico (Citation2004) and Plasse et al. (Citation2002a, Citation2002b) previously informed m2 for BW values of 0.11, 0.08 and 0.07 in Brahman cattle; these values are lower than the ones identified in the current study. Furthermore, Aynalem (Citation2006) reported that m2 estimates in Boran and their crosses were 0.25 ± 0.05 and 0.18 ± 0.05, which are closer to the estimates of the current study. Low levels or the complete lack of maternal effects on growth traits indicates that improvement in these traits can be achieved more efficiently through selection based on the direct genetic potential of the animal. In general, maternal effects at birth result from the cytoplasmic effect and prenatal maternal environment (Wasike et al. Citation2006). On the other hand, Wasike et al. (Citation2006) reported a lack of maternal influence on BW in Boran breeds. But then Karabulut et al. (Citation2012) determined higher m2 (0.12–0.45) in Holstein calves and also a negative ram. However, Tilki et al. (Citation2008) estimated higher m2 (0.06–0.15) for Brown Swiss calves and a positive ram.
Meyer (Citation1992) previously demonstrated that models excluding could provide considerably higher estimates for the
, and, hence, higher estimates for
as well. In case maternal effects are not taken into account, part of the maternal variance will be included in the estimate of additive genetic variance. Thus, including
will have the effect of decreasing the estimates of
.
It was observed that the permanent maternal environmental effects (or maternal environmental variance) varied between 0.023 and 0.472 for BW. Gemeda et al. (Citation2003) attributed the in BW to the dam’s uterine conditions. The same researchers also noted that the
was associated with the dam’s uterine capacity, maternal behaviour and feeding during late gestation. It is likely that maternal behaviour reflects the rearing ability of a dam. Maniatis and Pollott (Citation2003) previously showed the influence of record in separating maternal environmental and maternal genetic effects from the integrated direct effects. These authors indicated that the accuracy of maternal effect estimates is dependent on the pedigree information, and that the number of progeny per dam as well as the ratio of dams having their own record in the data is significantly affected by the estimation of the variance component.
3.2. Genetic correlations and covariances
The ram was negative and high for models 4 (−0.76 ± 0.027) and 6 (−0.67 ± 0.115). Similarly, genetic correlations estimated by Sahin et al. (Citation2012) for Brown Swiss calves, Karabulut et al. (Citation2012) for Holstein calves were negative and ranged from −0.58 to −1.00. However, compared to the results of the current study, lower ram estimates (−0.35 to −0.37) have been informed for Brahman cattle (Plasse et al. Citation2002a; Pico Citation2004), while similar estimates have been noticed for Nellore cattle (−0.72, Eler et al. Citation1995) and Boran cattle (−0.55, Haile-Mariam & Kassa-Mersha Citation1995).
The negative correlation observed between the ram effects is possibly a symptom of genetic conflict between genes; hence, taking this correlation into consideration during selection programmes is important. Meyer (Citation1992) and Swalve (Citation1993) previously proposed that environmental covariances between offspring and dam that are not taken into account may lead to bias in the ram. For beef cattle, Robinson (Citation1996) noted that negative ram could be the result of other effects in the data rather than an actual negative genetic relationship.
On the other hand, contrary to the results of the present investigation, Demeke and Neser Schoeman (Citation2003) suggested that a large and positive correlation (0.48) between the and
could be associated with bias due to the breed additive effect and the dam’s additive effects not being taken into account. Numerous studies conducted on different breeds have reported a negative association between ram for BW and weaning weight (Maria et al. Citation1993; Tosh & Kemp Citation1994; Ligda et al. Citation2000). But, a number of studies have also reported a positive relationship (Nasholm & Danell Citation1996; Yazdi et al. Citation1997). Nasholm and Danell (Citation1996) described that, in this instance of a positive relationship between ram, selection for augmented weights will also lead to an improvement in the maternal ability. These authors did not provide a conclusive explanation for these negative estimates. They might be associated with natural selection for an intermediate optimal (Tosh & Kemp Citation1994). It is generally assumed that, for body weight, the
is usually negative (Maria et al. Citation1993; Tosh & Kemp Citation1994); however, certain studies have also identified a positive relationship (Nasholm & Danell Citation1996; Yazdi et al. Citation1997).
The cam ranged from 0.060 to 0.073. Cundiff (Citation1972) stated that the negative explained from an evolutionary point of view prevents species from becoming increasingly larger. In this study,
were determined as positive. The findings of the present research were in agreement with those of Meyer (Citation1992) and Tilki et al. (Citation2008). But, this result was not supported by Karabulut et al. (Citation2012). Moreover, some researchers informed that a possible existence of a negative environmental covariance between offspring and dam could result in a biased estimation of ram (Meyer Citation1992; Ligda et al. Citation2000).
Low in model 5 reflects that
is not considerable for BW as mentioned by Rodriguez-Almeida et al. (Citation1995) for Mac Nay and Rhodes calves. In this study,
was estimated as positive. Meyer (Citation1992) reported the positive
for the BW of different calves, which is in line with the conclusions of the current research; nevertheless, Cantet et al. (Citation1988) informed a negative
for BW of Hereford calves. Szwaczkowski et al. (Citation2006) previously demonstrated that, when the maternal contribution is omitted during evaluation, the negative
serves as an indication of the different rankings of individuals. In addition, Swalve (Citation1993) described that the negative
might be associated with the managing scheme. On the other hand, a study directed by Dodenhoff et al. (Citation1999) on various strains of beef steers indicated that breed determines the dependence and ram. Furthermore, Přibyl et al. (Citation2008a, Citation2008b) demonstrated that correcting the records plays a role in determining the genetic parameters, and that it also contains a more complice pedigree and harvests considerably diverse conclusions.
3.3. The likelihood test
The results are shown in . According to the theories of the MTDFREML software package, model 4 with the lowest likelihood ratio is selected as the best model (Van Vleck Citation1993; Ulutas Citation1998; Lee & Taper Citation2002; Ulutas et al. Citation2002). This conclusion is in contradiction with the results of Tilki et al. (Citation2008) who described that model 6 was the best model.
3.4. Breeding values
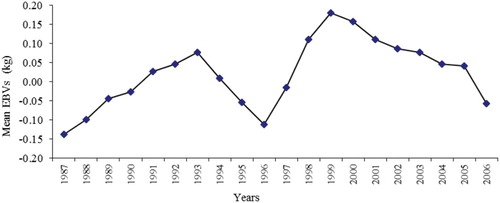
EBV breeding value has been estimated using the best model (model 4). According to birth year, changes of the breeding values are shown in . The genetic trend was estimated to the regression of EBV according to birth year. It was positive, 0.0085 kg/year, and important. A significant trend was not observed in the research period. The genetic trend was determined as non-zero. According to birth year, uneven fluctuations were observed in breeding values. The genetic trend (0.0085 kg/year) calculated in the current research was lower than the results of Intaratham et al. (Citation2008). However, Tilki et al. (Citation2008) stated that no positive and negative EBV for BW was determined.
Figure 1. Mean EBVs of birth weight according to years.
4. Conclusions
The estimates of genetic parameters for Holstein calves were consistent with previous research results. This research revealed that the addition of only maternal effect to a model caused a reduction in estimates of for BW of Holstein calves. Consequently, maternal effect on BW in diverse ages of Holstein cattle was important and should be considered in any selection scheme for these calves.
Acknowledgements
The authors are thankful to the Republic of Turkey Ministry of Food, Agriculture and Livestock and General directorate of Agricultural Enterprises.
Disclosure statement
No potential conflict of interest was reported by the authors.
References
- Abera H, Abegaz, S, Mekasha Y. 2011. Genetic parameter estimates of preweaning weight of Horro (Zebu) and their crosses with Holstein Friesian and Jersey cattle breeds in Ethiopia. Int J Livestock Prod. 2(6):84–91.
- Ap Dewi I, Saatci M, Ulutas Z. 2002. Genetic parameters of weights, ultrasonic muscle and fat depths, maternal effects and reproductive traits in Welsh Mountain sheep. Anim Sci. 74:399–408. doi: 10.1017/S1357729800052541
- Aynalem H. 2006. Genetic and economic analysis of Ethiopian Boran Cattle and their Crosses with Holstein Friesian in Central Ethiopia. A Ph.D. Thesis division of dairy cattle breeding National dairy research institute, Karnal-132001 (Haryana), India, pp. 65–146.
- Bakır G, Kaygısız A, Ulker H. 2004. Estimation of genetic parameters of milk yield in Brown Swiss and Holstein Friesian cattle. Pak J Biol Sci. 7:1198–1201. doi: 10.3923/pjbs.2004.1198.1201
- Boldman KG, Kriese LA, Van Vleck LD, Van Tassell CP, Kachman SD. 1995. A manual for use of MTDFREML, a set of programs to obtain estimates of variances and (co)variances. Washington, DC: USDA, ARS.
- Cantet RJC, Kress DD, Anderson DC, Doornbos DE, Burfenning PJ, Blackwell RL. 1988. Direct and maternal variances and (co)variances and maternal phenotypic effects on pre-weaning growth of beef cattle. J Anim Sci. 66:648–660. doi: 10.2527/jas1988.663648x
- Cundiff LV. 1972. The role of maternal effects in animal breeding: VIII. Comparative aspects of maternal effects. J Anim Sci. 35:1335–1337. doi: 10.2527/jas1972.3561335x
- Demeke SFWC, Neser Schoeman SJ. 2003. Variance components and genetic parameters for early growth traits in a mixed population of purebred Bos indicus and crossbred cattle. Livestock Prod Sci. 84:1–11. doi: 10.1016/S0301-6226(03)00074-5
- Dodenhoff J, Van Vleck LD, Gregory KE. 1999. Estimation of direct, maternal, and grand maternal genetic effects for weaning weight in several breeds of beef cattle. J Anim Sci. 77:840–845. doi: 10.2527/1999.774840x
- Eler JP, Van Vleck LD, Ferraz JBS, Lobo RB. 1995. Estimation of variance due to direct and maternal effects for growth traits of Nelore cattle. J Anim Sci. 73:3253–3258. doi: 10.2527/1995.73113253x
- Gemeda D, Schoeman SJS, Cloete WP, Jordaan GF. 2003. Genetic parameters for early growth traits in a Merino lambs estimated using multitrait analysis. Ethiopian J Anim Prod. 3(1):1–11.
- Haile-Mariam M, Kassa-Mersha H. 1995. Estimates of direct and maternal covariance components of growth traits in Boran cattle. J Anim Breeding Genet. 112:43–52. doi: 10.1111/j.1439-0388.1995.tb00539.x
- Intaratham W, Koonawootrittriron S, Sopannarath P, Graser HU, Tumwasorn S. 2008. Genetic parameters and annual trends for birth and weaning weights of a Northeastern Thai indigenous cattle line. Asian-Aust J Anim Sci. 21:478–483. doi: 10.5713/ajas.2008.70149
- Karabulut O, Mundan D, Sehar Ö. 2012. Variance components and breeding values of birth weight in Holstein calves. Harran Univ J Faculty Vet Med. 1:28–34.
- Lee S, Taper ML. 2002. A composite likelihood approach to (co)variance component estimation. J Stat Planning Inference 103:117–135. doi: 10.1016/S0378-3758(01)00215-4
- Ligda CH, Gavriilidis G, Papodopoulos TH, Georgoudis A. 2000. Investigation of direct and maternal genetic effects on birth and weaning weights of Chios lambs. Livestock Prod Sci. 67:75–80. doi: 10.1016/S0301-6226(00)00185-8
- Maniatis N, Pollott GE. 2003. The impact of data structure on genetic (co)variance components of early growth in sheep, estimated using an animal model with maternal effects. J Anim Sci. 81: 101–108. doi: 10.2527/2003.811101x
- Maria GA, Boldman KG, van Vleck LD. 1993. Estimates of variances due to direct and maternal effects for growth traits of Romanov sheep. J Anim Sci. 71:845–849.
- Meyer K. 1992. Variance components due to direct and maternal effects for growth traits of Australian beef cattle. Livestock Prod Sci. 31:179–204. doi: 10.1016/0301-6226(92)90017-X
- Meyer K. 1993. Estimates of (co)variance components for growth traits of Australian Charolais cattle. Aust J Agric Res. 44:1501–1508. doi: 10.1071/AR9931501
- Minitab for Windows (Version 12.1) [Computer Program]. 1998. Distributor: Minitab Inc., State College, PA, USA.
- Nasholm A, Danell O. 1996. Genetic relationships of lamb weight, maternal ability and mature ewe weight in Swedish fine wool sheep. J Anim Sci. 74:329–339. doi: 10.2527/1996.742329x
- Pico BA 2004. Estimation of genetic parameters for growth traits in South African Brahman cattle. A MSc. Thesis, Free State University, Bloemfontein, South Africa, p. 56.
- Plasse D, Verde O, Arango J, Camaripano L, Fossi H, Romero R, Rodriguez CM, Rumbos JL. 2002b. (Co)variance components, genetic parameters and annual trends for calf weights in a Brahman herd kept on floodable savanna. Genet Mol Res. 1(4): 282–297.
- Plasse D, Verde O, Fossi H, Romero R, Hoogesteijn R, Bastidas P, Bastardo J. 2002a. (Co)variance components, genetic parameters and annual trends for calf weights in a pedigree Brahman herd under selection for three decades. J Anim Breeding Genet. 119:141–153. doi: 10.1046/j.1439-0388.2002.00321.x
- Přibyl J, Krejčová H, Přibylová J, Misztal I, Tsuruta S, Mielenz N. 2008b. Models for evaluation of growth of performance tested bulls. Czech J Anim Sci. 53:45–54.
- Přibyl J, Přibylová J, Krejčová H, Mielenz N. 2008a. Comparison of different traits to evaluate the growth of bulls. Czech J Anim Sci. 53, 273–283.
- Robinson DL. 1996. Models which might explain negative correlations between direct and maternal genetic effects. Livestock Prod Sci. 45:111–122. doi: 10.1016/0301-6226(96)00002-4
- Rodriguez-Almeida FA, Van Vleck LD, Willham RL, Northcutt SL. 1995. Estimation of non additive genetic variances in three synthetic lines of beef cattle using an animal model. J Anim Sci. 73:1002–1011. doi: 10.2527/1995.7341002x
- Saatcı M, Ap Dewi I, Ulutas Z. 1999. Variance components due to direct and maternal effects and estimation of breeding values for 12-week weight of Welsh Mountain lambs. Anim Sci. 69:345–352. doi: 10.1017/S1357729800050918
- Sahin A, Ulutas Z, Yılmaz Adkinson A, Yılmaz Adkinson RW. 2012. Estimates of phenotypic and genetic parameters for birth weight of Brown Swiss calves in Turkey using an animal model. Trop Anim Health Prod. 44:1027–1034. doi: 10.1007/s11250-011-0036-6
- Solomon A, Gemeda D. 2002. Genetic and environmental trends in growth performance of a Flock of Horro Sheep. Ethiopian J Anim Prod. 2(1):49–58.
- Swalve HH. 1993. Estimation of direct and maternal (co)variance components for growth traits in Australian Simmental beef cattle. J Anim Breeding Genet. 110:241–252. doi: 10.1111/j.1439-0388.1993.tb00736.x
- Szwaczkowski T, Wojtowski J, Stanislawska E, Gut A. 2006. Estimates of maternal genetic and permanent environmental effects in sheep. Archiv für Tierzucht. 49:186–192.
- Tilki M, Saatcı M, Colak M. 2008. Genetic parameters for direct and maternal effects and estimation of breeding values for birth weight in Brown Swiss Cattle. Turk J Vet Anim Sci. 32:287–292.
- Tosh JJ, Kemp RA. 1994. Estimation of variance components for lamb weights in three sheep populations. J Anim Sci. 72, 1184–1190.
- Ulutas Z. 1998. Production traits and marked values of Welsh Black Cattle. PhD thesis, University of Wales Bangor, United Kingdom.
- Ulutas Z, Saatcı M, Dewi IA. 2002. Six different models for estimation of genetic parameters and breeding values for pre weaning and post-weaning weights in suckler cattle. Turk J Vet Anim Sci. 26:215–220.
- Van Vleck LD. 1993. Estimation of non additive genetic variances for a total-merit model including maternal effects. J Anim Sci. 71:2006.
- Yazdi MH, Engstrom G, Nasholm A, Johansson K, Jorjani H, Liljedahl LE. 1997. Genetic parameters for lamb weight at different ages and wool production in Baluchi sheep. J Anim Sci. 65:224–255. doi: 10.1017/S1357729800016556
- Wasike CB, Ilatsia ED, Ojango JMK, Kahi AK. 2006. Genetic parameters for weaning weight of Kenyan Boran cattle accounting for direct-maternal genetic covariance. S Afr J Anim Sci. 36(4): 275–281.
- Willham RL. 1972. The role of maternal effects in animal breeding: III. Biometrical aspects of maternal effects in animals. J Anim Sci. 35:12–1293. doi: 10.2527/jas1972.3561288x