
ABSTRACT
We investigated the prediction of live weight (LW) of dairy cattle in low- to medium-input systems in Senegal, based on measurements of heart girth (HG) and height at the withers (HW). A total of 459 female dairy cattle, mainly comprising indigenous Zebu and their crosses with Guzerat or Bos Taurus, were weighed (kg), and their HG (cm) and HW (cm) determined. Farmers were asked to provide their own weight estimates for each animal. The single explanatory variable that explained the most variation in LW was HG. The best model to predict LW from HG for the overall data was with an adjusted R2 of 0.85 and a root mean square error of 34.25 kg corresponding to 11.10% of the mean LW. This model predicted the LW of 91–100% of cows and 64–100% of heifers within 20% of their true-live weight, in the weight range of about 100–500 kg. In comparison, farmers could only estimate the LW of about a quarter of their animals within 20% of their true LW. This weight prediction equation, when translated into a weigh band, could provide a simple and reliable method for cattle keepers to estimate the weight of studied cattle breed types.
1. Introduction
The accurate estimation of body weight of livestock is important in deciding the slaughter weight, feeding level and what treatment dose to use (Ulutas et al. Citation2002; Machila et al. Citation2008). Among the many methods used for its determination, a weighing scale is considered the gold standard if the scales used are well calibrated (Machila et al. Citation2008). In most rural areas of Africa, cattle are rarely weighed as weighing instruments are costly to obtain, need technical maintenance and are difficult to transport to livestock farms, especially in pastoral and agro-pastoral systems (Machila et al. Citation2008). Farmers and cattle traders often rely on visual judgement to determine the live weight (LW) of animals, which is a subjective method whose accuracy depends on users’ experience.
Body weight is closely related to body measurements, with HG generally accepted as the most satisfactory single predictor of LW in cattle (Fall et al. Citation1982; Dodo et al. Citation2001; Yan et al. Citation2009; Isik et al. Citation2009; Lesosky et al. Citation2012; Lukuyu et al. Citation2016). The method is cheap, accurate and consistent; thus, many predictive regression equations are based on this parameter alone or in combination with others. Whilst such studies have been carried out in Senegal – the focal country of this study – in the past (Chollou et al. Citation1978; Fall et al. Citation1982; Buldgen et al. Citation1984), they are more than 30 years old and may not be valid for the new cross and pure cattle breed types that are emerging in Senegal, primarily through the use of exotic breed types via artificial insemination.
The objectives of this paper were (1) to develop a prediction equation for body weight estimation from body measurements across different cattle breeds and cross-breeds currently present in selected low-input cattle systems in Senegal, which could later be translated into a weigh band for use by farmers and (2) to assess the accuracy with which farmers in these systems estimate the weight of their cattle.
2. Materials and methods
2.1. Project
This study was part of the Senegal Dairy Genetics project, whose aim is to improve dairy production and productivity in Senegal through the use of the most appropriate breed types. It is part of the larger Food Africa programme aimed at improving food security in West and East Africa (see https://portal.mtt.fi/portal/page/portal/mtt_en/projects/foodafrica).
2.2. Study sites
Thiès and Diourbel regions of Senegal had been chosen for the larger project because of the diversity of cattle breed types in these regions. The climate in both regions is of the Sahelian type characterized by a short wet season that spans from July to October. Annual rainfall varies, with an average of 662.9 mm (Fall et al. Citation2006). The livestock production system is mainly agro-pastoral. Cattle are mainly grazed on natural pastures and occasionally receive crop residues at the end of the harvesting period as well as feed concentrates during the dry season.
2.3. Data
This study was implemented between November 2013 and June 2015 on 484 female cattle from 84 cattle-keeping farms in Thiès and Diourbel regions of Senegal. Herd were selected based on their herd composition, to ensure cattle from all existing breed types were represented. Data were obtained from each animal: farmer-estimated live-weight in kg; measured LW in kg; hearth girth (HG) measurement in cm and height at the withers (HW) in cm. LW was determined using an electronic cattle scale (Iconix FX1 digital indicator, Sensortronic Ltd, Hamilton, New Zealand). HG was measured by letting the animal to stand with its head in the normal position and placing an ordinary measuring tape around the animal at the point of the smallest circumference just behind the forelegs and behind the hump for Zebu cattle. The tape was pulled slightly about the animal, tight enough to pull down the hairs but not to indent into the flesh (Branton & Salisbury Citation1946). HW was measured using a measuring stick (in cm), as the distance from the ground to the highest point of the withers. Age of each animal was estimated in years from visual assessment of eruption and wear of teeth and farmer recall, and a breed group was assigned to each animal. Measurements were taken in the morning for animals that were stable-fed, or before animals were taken to the pastures for those grazed on pastures. All animals experienced a reasonable pre-weighing fast period with little variation due to gut-fill at the time of measure. To ensure a consistent methodology, all measurements were taken by the same person.
Study cattle were assigned to four main breed groups either on the basis of farmer recall information or, where available, genotype information. The breed groups (as specified further in) are (1) indigenous Zebu, predominantly the Zebu Gobra and Zebu Maure breeds; (2) indigenous Zebu crossed with Guzerat (which will be referred to as indigenous Zebu by Guzerat abbreviated), where Guzerat is a recently introduced Zebu breed developed in Brazil from the Kankrei cattle imported from India (Mariante et al. Citation1999); (3) indigenous Zebu crosses with recently introduced Bos Taurus (indigenous Zebu by Bos Taurus), where Bos Taurus animals predominantly comprise the high milk-yielding breeds (mainly Montbeliard and Holstein Friesians) and (4) indigenous Zebu crosses with a higher level of Bos Taurus or pure Bos Taurus (high Bos Taurus). We asked the farmers to name the breed types of each of the animal’s grandparents, that is, sire of sire, dam of sire, sire of dam and dam of dam. The animal’s proportion of ancient (indigenous) Zebu (AZ), recent Zebu (RZ), ancient Taurine (AT) and recent Taurine (RT) were then determined, and based on this the animals were assigned a breed group according to the criteria in . Genotyping was performed on 128 of the measured animals using the Bovine 50 K single nucleotide polymorphism chip (these animals were selected on the basis of being a female with lactation records, for the purpose of determining the milk yield of the different breed types, which will be reported elsewhere). Admixture (of this and reference data) was analysed based on predefined clustering in Bayesian Analysis of Population Structure BAPS v6.0 (Corander et al. Citation2008) according to the software instructions. From here the proportion of AZ, RZ, AT and RT was determined for each animal, and animals were assigned a breed group as per the criteria in .
Table 1. Criteria for breed group definition, for animals assigned to a breed group by either farmer recall information or genotype information.
Data from 25 of the 484 measured cattle were excluded from further analysis as their body weight was less than 100 kg (for which no relationship between LW and body measurements was found). The final dataset included observations from 459 animals (345 cows (3 or more years of age), 114 heifers (22 less than 12 months of age, 42 between 12 months and 23 months of age, and 51 between 24 months and 35 months of age)). The groups included 270 indigenous Zebu, 58 indigenous Zebu by Guzerat and 46 indigenous Zebu by Bos Taurus, 36 high Bos Taurus and 49 others ().
Table 2. Summary statistics1 of the final data set for measured live weight (LW), heart-girth (HG) and height at the withers (HW), for cows and heifers of the different breed groups2.
2.4. Analysis approach
Summary statistics of the data are given as means and standard deviation (). Comparison of means was determined by a one-way analysis of variance followed by Tukey’s honestly significant difference. Statistical significance was assessed at p < .05. LW, HG and HW were approximately normally distributed ().
Figure 1. Frequency histograms of LW of live weight (a), hearth girth (b) and height at the withers (c).
Stepwise regression with backwards elimination procedure was used to determine the best model for predicting LW, based on Akaike’s Information Criterion (which considers both the fit of the model and model simplicity). The full model comprised the independent variables HG and HW as co-variates, and age and breed as categorical variables. Simple linear regression was also used to predict LW from HG. The adjusted coefficient of (multiple) determination (adjusted R2) was also given for the models, as an indicator of the amount of variance in LW explained by the model. The root mean square error (RMSE; the same as the standard deviation of the residuals), and also the RMSE expressed as a percent of the real LW, was used an indicator of accuracy of the regression estimates (Yan et al. Citation2009; Lukuyu et al. Citation2016). Ninety-five percent prediction intervals were determined as the predicted value ± twice the RMSE. The fit of the regression models were also verified by checking the residual plots. All analyses were performed in R (R Core Team, Citation2012), with step AIC function from the MASS package used for backward stepwise elimination regression, and lm function was used for simple linear regression.
3. Results and discussion
3.1. Observed body measurements and their correlations
Summary statistics for LW, HG and HW for adult and heifers for the various breed groups are given in . LW, for cows, ranged from 110 to 618 kg, HG from 110 to 213 cm and HW from 95 to 161 cm. LW, HG and HW were lower for cows of the indigenous Zebu and Zebu by Guzerat breed groups, in comparison to that of the indigenous Zebu by Bos Taurus and high Bos Taurus breed groups (p < .05). For example, indigenous Zebu cows had a mean LW (mean ± SD) of 302.7 (60.9) kg, whilst that of the high Bos Taurus was 392.2 (113.9) kg. Similar results were not found for heifer, however, likely due to the different age profiles of young animals of the different breed groups.
The LW range for cows of the indigenous Zebu breed group found in this study is comparable to a previously reported weight range for adult Zebu Gobra in Senegal of 250–350 kg (Missohou et al. Citation1997). The average LW, HG and HW measures for cows of high Bos Taurus found in this study were generally lower compared to 419–781 kg, 176–223 cm and 125–150 cm reported for Holstein Friesians cows in a developed country context (Yan et al. Citation2009), likely due to the lower feeding level of animals in this study in comparison to that in the developed world, and because the high Bos Taurus group in this study were not always pure-bred (see ). A study on dairy cattle in Kenya (Lukuyu et al. Citation2016) where animals mainly comprised the Small East African Zebu (SEAZ) crossed at different levels to exotic breeds generally gave lower LW, HG and HW than that reported here, reflecting the different statures of the main Zebu types in the two studies.
The high standard deviations observed for LW, HG and HW within a particular breed group are also in line with previous studies (Fall et al. Citation1982; Dodo et al. Citation2001; Yan et al. Citation2009), and would largely reflect the diversity of cattle management practices within our study sites.
For all animals, the correlation (r) between LW and HG was high at r = 0.92, and the correlation between LW and HW and between HW and HG was moderate at r = 0.78 and at r = 0.77, respectively. The correlations reported above are similar to other studies that found a correlation between LW and HW of 0.88–0.97 , and a correlation between LW and HW or HG of 0.65–0.92 in West Africa (Chollou et al. Citation1978; Fall et al. Citation1982; Dodo et al. Citation2001).
3.2. Prediction of LW
Prediction equations of LW for different models, for the entire dataset as well as selected subsets of animals (sex and breed groups), are given in . For the entire dataset, the best model to predict LW was , yielding an adjusted R2 of 0.86 and a RMSE of 32.81 corresponding to 11.02% of the mean LW. The best models for various subsets of data (which varied according to the data subset) had an adjusted R2 ranging from 0.79 to 0.94 and a RMSE ranging from 29.27 to 39.24 kg (9.36%–12.33% of the mean LW).
Table 3. Regression equations predicting live weight from different models, for all animals or selected subsets.
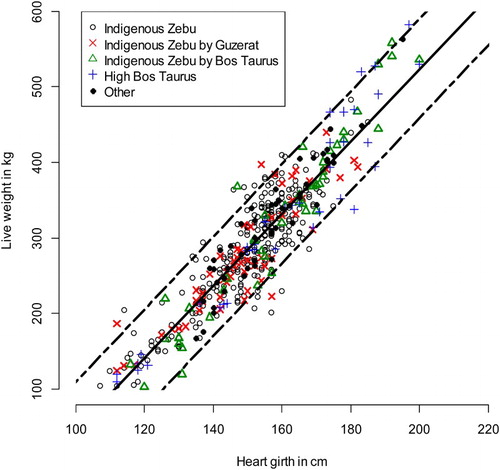
As the aim of this project was to develop an easy-to-use tool to predict LW of animals (within a known prediction interval) from body measurements – such as a body measurement to weight conversion table or weigh band – we were interested in a model with a single explanatory variable and that could be used across the range of cattle types present in the study sites. The single explanatory variable that explained the most variation was HG, consistent with previous studies (Dodo et al. Citation2001; Yan et al. Citation2009; Lesosky et al. Citation2012; Lukuyu et al. Citation2016). Predicting LW from HG alone, the model for the overall data was LW = 4.81 HG–437.52, which had an adjusted R2 of 0.85, and a RMSE of 34.25 kg corresponding to 11.10% of the mean LW. Thus, basing a tool on this equation would enable farmers to predict the LW of female animals of 100 kg to at least 500 kg, to within 34.25 kg of the real LW in 68% of the cases. shows a plot of this model in relation to our data.
Figure 2. Relationship between live weight (LW) and heart-girth (HG) for the entire dataset for the equation LW = 4.81 HG–437.52, and with different symbols used for different breed groups. The model line is represented by the thick solid line, and 95% prediction intervals of the model are represented by dashed lines.
A comparison of predicted LW to real LW, for adults and heifers of the various breed groups and via the model , showed that, on average, cows of the indigenous Zebu and indigenous Zebu by Guzerat breed groups have their weight neither strongly under- or overestimated, whilst cows of indigenous Zebu by Bos Taurus, high Bos Taurus and other breed groups tended to have their weight underestimated (by 7.36, 4.76 and 7.10 kg, respectively). Heifers of all breed groups tended to have their weight overestimated, by 3.64–11.26 kg depending on the breed group ().
Table 4. Live-weight predictions for cows and heifers of the different breed groups, using the overall regression equation LW = 4.81 HG–437.52, and other summary information in relation to this.
Across the different breed groups, the percentages of cows whose weight was predicted within 20%, 10% or 5% of their true LW was at least 91%, 59% and 35%, respectively. For heifers, these figures were lower at 77%, 55% and 34% (excluding the indigenous Zebu by Bos Taurus heifers, which had particularly low values of 64%, 50% and 21%), partly attributable to the lower weights of younger females (). These percentages, and particularly those for heifers, were lower than the 70% of animals within 10%, and 41% within 5%, reported for LW estimation from HG measures in 24 months old N’dama cattle raised on a research farm in Senegal (Fall et al. Citation1982). This, however, is to be expected given the variety of breeds, ages of animals and management practices included in our studies compared to that of the Fall et al. (Citation1982) study.
Estimation of cattle weight to within 20% of their true weight is considered as an accuracy range for veterinary drug dosing (Machila et al. Citation2008; Lesosky et al. Citation2012). For cows, this was achieved for 92.73% of the overall cases, whilst for heifers this was achieved for 83.48% of the overall cases. Thus, the HG model presented here can be considered as a reasonable way to predict the weight of cows for purposes of drug dosing, but for other purposes where more accuracy is required (e.g. selection of cattle on LW), the use of a proper weight scale is preferred (ILCA/IER Citation1978; Goe et al. Citation2001).
3.3. Comparison to existing models for LW prediction of West African cattle
LW predictions from HG measurements for cattle in West Africa, from six prior studies in addition to our study, are shown in , with the regression equations and country and breed of animal included (where known) of these prior studies given in . The predicted weight from our study tended be higher in comparison to that in other studies, except at lower HGs. Results of our study were close to that of a prior study on Zebu Gobra in Senegal (Chollou et al. Citation1978), which makes sense given that the majority of animals in our study were Zebu Gobra or their crosses. The relationship between LW and other body measurements including HG has been shown to be influenced by sex, breed and age (Buldgen et al. Citation1984; Sow et al. Citation1991; Ozkaya & Bozkurt Citation2009), providing an explanation for the different models resulting from the different studies.
Figure 3. Live weight predictions from heart girth measurements for cattle in West Africa, from different studies.
Table 5. Model equations for predicting live weight from heart-girth measurements for cattle in West Africa, from different studies.
3.4. Farmers’ ability to estimate weight
An additional component of this study was to compare farmers’ estimate of the weight of the animal to the measured LW. The correlation between these two variables was low at 0.53 for the entire dataset. As shown in , farmers tended to underestimate the weight of their animals. On average, and for cows, the indigenous Zebu, Zebu by Guzerat, Zebu by Bos Taurus and high Bos Taurus breed groups were underestimated by 115.60 (92.46), 109.10 (83.56), 94.05 (99.47), 149.65(109.18) and 173.81(118.32) kg, respectively (means, and standard deviations in brackets). Only 25.5% of animals had a farmer-estimated weight within 20% of their true weight, and only 7.0% of animals had a farmer-estimated weight within 5% of their true weight. The underestimation of cattle weight by farmers agreed with the findings of Machila et al. (Citation2008) in Kenya, where 85.7% of cattle had their body weights underestimated by their owners. The high underestimation of LW by farmers raises concerns of widespread under-dosing of cattle with veterinary drugs, a major route to drug resistance (Dijk et al. Citation2015), especially in sub-Saharan Africa where animal owners and animal health providers with limited training are often responsible for the administration of drugs to livestock (Cheneau et al. Citation2004).
Figure 4. Scatterplot of farmer-estimated live weight versus real live weight for the whole dataset (a) and various breed groups: (b) indigenous Zebu; (c) indigenous Zebu by Guzerat; (d) indigenous Zebu by Bos Taurus; (e) high Bos Taurus and (f) others.
4. Conclusion
The aim of this study was to provide farmers with a simple and reliable tool for estimating the LW in cattle. The model developed predicted the LW of 91–100% of cow and 64–100% of heifer cattle within 20% of their true LW, dependent on the breed group, in the weight range of about 100–500 kg. This model, in the future, can be translated into an easy-to-use tool such as weigh band for farmers, who only correctly estimated the LW of about a quarter of their animals within 20% of their true LW. Most models developed in different regions in Senegal and West Africa underestimated the weight of animals in this study, which suggests a need to validate the equation on further cattle breeds, age and sex groups in order to achieve a wider application of the model.
Disclosure statement
No potential conflict of interest was reported by the authors.
Additional information
Funding
References
- Branton C, Salisbury GW. 1946. The estimation of the weight of bulls from heart girth measurements. J Dairy Sci. 29:141–143. doi: 10.3168/jds.S0022-0302(46)92458-7
- Buldgen A, Compere R, Riboux A. 1984. Recherche d’une formule barymétrique adaptée aux bovins de type Djakoré des élevages villageois du Sénégal Oriental. Tropicultura. 2:86–90.
- Buvanendran V, Umoh JE, Abubakar BY. 1980. An evaluation of body size as related to weight of three West African breeds of cattle in Nigeria. J Agric Sci. 95:219–224. doi: 10.1017/S0021859600029476
- Cheneau Y, ElIdrissi AH, Ward D. 2004. An assessment of the strengths and weaknesses of current veterinary systems in the developing world. Rev Sci Tech Int Off Epizoot. 23:351–359, 401. doi: 10.20506/rst.23.1.1489
- Chollou M, Denis JP, Gauchet D. 1978. Calcul d’une formule barymétrique adaptée au zébu Gobra. Rev Délevage Médecine Vét Pays Trop. 31:447–450.
- Corander J, Marttinen P, Sirén J, Tang J. 2008. Enhanced Bayesian modelling in BAPS software for learning genetic structures of populations. BMC Bioinform. 9:539. doi:10.1186/1471-2105-9-53
- Dijk, J. van, Eagle, SJ, Gillespie, AV, Smith, RF, Holman, AN, Williams, HJ. 2015. Visual weight estimation and the risk of underdosing dairy cattle. Vet Rec. 177, 75–75.
- Dodo K, Pandey VS, Illiassou MS. 2001. Utilisation de la barymétrie pour l’estimation du poids chez le zébu Azawak au Niger. Rev Délevage Médecine Vét Pays Trop. 54:63–68.
- Fall A, Diop M, Sandford J, Wissocq YJ, Durkin J, Trail JC. 1982. Evaluation des productivités des ovins Djallonke et des taurins N’Dama au Centre de recherches zootechniques de Kolda, Sénégal. Addis Ababa: ILCA.
- Fall S, Niyogi D, Semazzi FHM. 2006. Analysis of mean climate conditions in Senegal (1971–98). Earth Interact. 10:1–40. doi: 10.1175/EI158.1
- Goe MR, Alldredge JR, Light D. 2001. Use of heart girth to predict body weight of working oxen in the Ethiopian highlands. Livest Prod Sci. 69:187–195. doi: 10.1016/S0301-6226(00)00257-8
- ILCA/IER. 1978. Evaluation of the productivities of Maure and Peul cattle breeds at the Sahelian station, Niono, Mali. Addis Ababa: ILCA.
- Isik HB, Topcu Y, Guler O. 2009. Determination of the factors affecting live weight gain using factor analysis and stepwise regression model. J Appl Anim Res. 35:161–164. doi: 10.1080/09712119.2009.9707008
- Lesosky M, Dumas S, Conradie I, Handel IG, Jennings A, Thumbi S, Toye P, Bronsvoort BM de C. 2012. A live weight-heart girth relationship for accurate dosing of east African shorthorn zebu cattle. Trop Anim Health Prod. 45:311–316. doi: 10.1007/s11250-012-0220-3
- Lukuyu MN, Gibson JP, Savage DB, Duncan AJ, Mujibi FDN, Okeyo AM. 2016. Use of body linear measurements to estimate liveweight of crossbred dairy cattle in smallholder farms in Kenya. SpringerPlus. 5:63. doi:10.1186/s40064-016-1698-3
- Machila N, Fèvre EM, Maudlin I, Eisler MC. 2008. Farmer estimation of live body weight of cattle: implications for veterinary drug dosing in East Africa. Prev Vet Med. 87:394–403. doi: 10.1016/j.prevetmed.2008.06.001
- Mariante A da S, Albuquerque M do SM, do Egito AA, McManus C. 1999. Advances in the Brazilian animal genetic resources conservation programme. Anim Genet Resour Resour Génétiques Anim Recur Genéticos Anim. 25:107–121.
- Missohou A, Bankole AA, Niang AT, Ragounandea G, Talaki E, Bitar I. 1997. Le Zébu Gobra: Caractères ethniques et performances zootechniques. Ani Genet Resour Inform. 22:53–60. doi: 10.1017/S1014233900001012
- Ozkaya S, Bozkurt Y. 2009. The accuracy of prediction of body weight from body measurements in beef cattle. Arch Tierz. 4:371–377.
- R Core Team. 2012. R: a language and environment for statistical computing. R Foundation for Statistical Computing, Vienna, Austria. Available from: http://www.R-project.org/
- Sow RS, Denis JP, Trail JCM, Thiongane PI, Mbaye M. 1991. Note sur la barymétrie comme moyen de sélection indirecte du poids vif chez le zébu Gobra au Sénégal. Rev Délevage Médecine Vét Pays Trop. 44:97–100.
- Ulutas Z, Saatci M, ÖZLüTüRK A. 2002. Prediction of body weights from body measurements in East Anatolian Red calves. Indian J Anim Sci. 72:878–881.
- Yan T, Mayne CS, Patterson DC, Agnew RE. 2009. Prediction of body weight and empty body composition using body size measurements in lactating dairy cows. Livest Sci. 124:233–241. doi: 10.1016/j.livsci.2009.02.003