
ABSTRACT
Bone morphogenetic proteins (BMPs) are multifunctional secreted cytokines that play important roles in bone formation. In the present study, a homologous BMP3 gene was identified from Pinctada fucata (PfBMP3). PfBMP3 was 2710 bp length, contained 1470 bp of ORFs. PfBMP3 gene was expressed at all stages tested, with the highest expression during the trochophore and metamorphosis stages. PfBMP3 gene was expressed in all tissues tested, with high levels detected in the gill and mantle. In situ hybridization of the mantle revealed that PfBMP3 was highly expressed in the inner epidermis of the inner fold, the outer epidermis of the middle fold, and outer epidermis of the mantle. In the shell notching experiments, the expression of PfBMP3 was up-regulated after treatment. These results indicated that PfBMP3 might play a role in P. fucata shell formation. The expression level of PfBMP3 in a low calcium aquacultural environment was higher than that in a high calcium aquacultural environment, suggesting that PfBMP3 might participate in calcium ion metabolism regulation. RNA interference (RNAi) showed that the expression level of the calmodulin gene PfCaM was down-regulated after RNAi, implying that the involvement of PfBMP3 in calcium ion metabolism might be through action with PfCaM.
1. Introduction
The BMP family is the largest branch of the TGFβ superfamily and includes about 20 different family members such as BMP1 to BMP18, BMP2B, growth and differentiation factor (GDF), and decapentaplegic (Dpp) (Carreira et al. Citation2014). BMPs are low molecular weight (about 30 kDa) glycoproteins, synthesized by osteoprogenitor cells, osteoblasts, chondrocytes, and platelets (Sipe et al. Citation2004).
BMPs from vertebrates, especially humans, have been studied relatively thoroughly. BMPs have conservative structural features, shared by the TGFβ superfamily proteins, consisting of a precursor protein molecule containing a signal peptide, a prodomain, and a mature protein region, which includes a TGF-β structural domain (Massagué Citation1998). The mature protein regions generally have 120 amino acids (aa), including seven conserved cysteines. Of these cysteines, six form three intrachain disulfide bonds by pairwise coupling, and the remaining one participates in dimer formation, which is the active BMP molecule, through an intermolecular disulfide bond (Butler and Dodd Citation2003; Griffith et al. Citation1996). Most BMPs are osteogenic and induce mesenchymal stem cell differentiation towards the osteoblastic lineage (Bibbo et al. Citation2014; Cheng et al. Citation2004; Rahman et al. Citation2015). In addition, BMPs are involved in a variety of physiological activities, including embryonic development, cell proliferation and differentiation, histogenesis, organogenesis, apoptosis, chemotaxis, and tissue repair (Ducy and Karsenty Citation2000; Jia et al. Citation2012; Liu and Niswander Citation2005). Studies on the osteogenic activity of BMPs have received the most attention; for example, recombinant human BMP2 and BMP7 have been clinically approved for anterior lumbar inter-body fusion and bone defects (non-union, open tibial fractures), respectively (Bishop and Einhorn Citation2007). BMPs work in accord with the classical pathway of the TGFβ superfamily proteins. Specifically, BMPs bind transmembrane receptors, which then activate the Drosophila mothers against decapentaplegic proteins (Smads) through phosphorylation, with the activated Smads complexes then translocated into the nucleus where they bind to transcription factors and thus regulate target gene transcription (Feng and Derynck Citation2005; Shi and Massagué Citation2003). As a member of the BMP family, BMP3 has been proven to suppress osteoblast differentiation and plays a negative role in bone mass regulation, contrary to the majority of BMPs (Daluiski et al. Citation2001; Gamer et al. Citation2009; Kücükarslan and Coskun Citation2012).
Compared to vertebrates, few studies on BMP family genes in molluscs have been conducted. In Crassostrea gigas, dpp and molluscan growth and differentiation factor (mGDF) have been identified and proven to take part in embryonic development regulation (Lelong et al. Citation2000). In P. fucata, BMP2 and BMP7 have been shown to participate in shell formation (Miyashita et al. Citation2008; Yan et al. Citation2014). Other BMP family genes have also been identified in molluscs, including dpp from Saccostrea kegaki (Kin et al. Citation2009), BMP2/4 from Patella vulgata (Nederbragt et al. Citation2002), and BMP2 from Chlamys farreri (Feng et al. Citation2013). Although BMP3 was annotated from genomic survey of P. fucata (Setiamarga et al. Citation2013), the function of it was unclear.
Shells are the dermoskeleton of molluscs, consisting of 95% inorganic calcium carbonate and 5% organic substances, and are formed through typical biomineralization (Mann et al. Citation1988). Therefore, the calcium ion is neccessary during the process of biomineralization and is the primary cation participating in the formation of shell structures. In general, calcium is taken up from external media by organs exposed to the environment, including the gill, mantle, and foot. The calcium is then transported to the mantle epithelium, continuously secreted to the mantle cavity, and deposited onto the framework formed by matrix proteins. Calcium metabolism is an important research area in the mechanisms of shell formation. However, few research of calcium metabolism in mollusc was reported. During shell formation, the uptake, transport, and recruitment of calcium ions are highly regulated and influenced by many factors such as calmodulin (CaM) and calmodulin-like protein (CaLP) (Fang et al. Citation2008; Li et al. Citation2005; Yan et al. Citation2007). CaM, a pivotal multifunction regulator of calcium metabolism in nearly all organisms, is thought to play an important role in calcium metabolism involved in shell formation (Fang et al. Citation2008; Li et al. Citation2004). In additon, calcium could modulates BMP-2 levels during calcification in human (Rashid et al. Citation2003). BMP pathway regulate cell fate were depend on interactions and crosstalk with other signalling pathways such as Ca2+/calmodulin (Zylbersztejn et al. Citation2018). However, the relationship of BMP3 and CaM were unclear.
The pearl oyster P. fucata is the main species cultured for marine pearl production in China, and is also a representative research model for shell formation. In the present study, we cloned the BMP3 gene from P. fucata and performed preliminary functional studies through expression analyses, shell notching experiments, calcium inductive experiments, and RNAi.
2. Materials and methods
2.1. Total RNA extraction and cDNA synthesis
One-year-old adult pearl oysters were obtained from the pearl oyster culture base of the South China Sea Fisheries Research Institute, Lingshui, Hainan Province, China. The pearl oysters were cultured in tanks with seawater for 3 d before the experimental analyses. Tissues, including the mantle, gonad, gill, adductor muscle, hemocyte, hepatopancreas, intestine, and pearl sac, were isolated and maintained in RNAlater (TaKaRa, Dalian, China). Total RNA was extracted from the tissues using the TRIzol RNA isolation kit (Invitrogen, Carlsbad, CA, USA) according to the manufacturer’s instructions. Larval pearl oysters were bred through in vitro fertilization using sexually mature individuals. Larvae at different developmental stages, including the trochophoric (8 h after fertilization), D-veliger larval (1 d after fertilization (daf)), umbo-veliger larval (10 daf), eyespot larval (24 daf), and metamorphic (27 daf) stages, were sampled and total RNA was extracted as described above. The RT-reaction was carried out using total RNA of the mantle and the Prime Script II 1st strand cDNA synthesis kit (TaKaRa, Dalian, China).
2.2. Molecular cloning of full-length BMP3 cDNA sequence
Part of the BMP3 gene sequence was obtained from the transcriptome of P. fucata (data not published). Sequence accuracy was confirmed by PCR using three pairs of primers (BMP3-1S/A, BMP3-2S/A, BMP3-3S/A) (). Gene specific nested primer pairs (BMP3-5′ out/in) and the 5′-Full RACE kit (TaKaRa, Dalian, China) were then used to amplify the 5′ end (). The 3′ end was amplified using gene specific nested primer pairs (BMP3-3′ out/in) and the 3′-Full RACE (rapid-amplification of cDNA ends) Core Set with Primer Script™ RTase (TaKaRa, Dalian, China) (). The RACE reactions were conducted according to the manufacturer’s instructions. Finally, the obtained DNA fragments were purified, cloned into the pMD18-T vector (TaKaRa, Dalian, China), and sequenced.
Table 1. Sequences of primers used in the study.
2.3. Bioinformatic analysis
The full-length cDNA of BMP3 from P. fucata was obtained through sequence assembly based on the sequence from the transcriptome and RACE assays. Its similarity to other genes was analyzed using the BLAST algorithm from the NCBI database (http://www.ncbi.nlm.nih.gov/blast/). ORF Finder (http://www.ncbi.nlm.nih.gov/gorf/gorf.html) and Translate (http://web.expasy.org/translate) were used to obtain the open reading frames (ORFs) and predict the coding protein sequence, respectively. PortParam (http://web.expasy.org/cgi-bin/protparam) and SMART (http://smart.embl-heidelberg.de/smart/) were used for analysis of the physical-chemical properties and functional domains of the deduced protein sequence, respectively. TMHMM (http://www.cbs.dtu.dk/services/TMHMM-2.0/) and SignalP (http://www.cbs.dtu.dk/services/SignalP/) were used for predicting the transmembrane structure and signal peptide of the deduced protein, respectively. DNAMAN was used for multiple sequence alignments. A phylogenetic tree was created with MEGA 6.0 based on amino acid sequence alignments using the neighbor-joining (NJ) algorithm, with branching reliability evaluated by the bootstrap method with 1000 pseudo replicates.
2.4. Quantitative real-time PCR
The relative expression levels of PfBMP3 at different developmental stages (trochophore larvae, D-veliger larvae, umbo-veliger larvae, eyespot larvae, and larvae during metamorphosis) and in different tissues (mantle, gonad, gill, adductor muscle, hemocyte, hepatopancreas, intestine, and pearl sac) were analyzed using quantitative real-time PCR (qRT-PCR). Total RNA from the different developmental stages and tissues was used as the template for the RT-reaction based on the PrimeScript™ RT reagent kit with gDNA Eraser (TaKaRa, Dalian, China). cDNA was diluted to 1:10 and stored at −20°C. Specific primers were designed using the PfBMP3 cDNA sequence, and the 18S rRNA gene was selected as the reference gene (). qRT-PCR was conducted using the CFX96 Real-Time PCR Detection System (Eppendorf, Germany). PCR was performed in a 20 µl reaction volume, containing 10 µl 2 × SYBR Green Real-time PCR Master Mix (TaKaRa), 0.4 µl of each primer (10 µM), 1.0 µl cDNA, and 8.2 µl RNase-free water. PCR cycling programme consisted of denaturation at 95°C for 30 s, 40 cycles at 95°C for 5 s, 55°C for 15 s. The comparative CT method (2−ΔΔCT method) was used to analyze relative expression levels (Livak and Schmittgen Citation2012).
2.5. In situ hybridization
The digoxigenin labelled three-phase oligonucleotide probes targeting PfBMP3 cDNA specific fragments (BMP3-ISH-1, BMP3-ISH-2, and BMP3-ISH-3) were designed and synthesized by Boster (Wuhan, China) ().
Mantle tissues were removed from adult pearl oysters and immediately fixed in 4% paraformaldehyde containing 0.1% diethylpyrocarbonate (DEPC) (Sigma-Aldrich, St. Louis, USA) overnight. The fixed tissues were dehydrated through an alcohol series, embedded in paraffin wax, and sectioned (6–8 μm thick). The sections were dewaxed in xylene and rehydrated in an alcohol series. In situ hybridization was performed using the enhanced sensitive ISH detection kit (POD) (Boster, Wuhan, China) according to the provided instructions.
2.6. Shell notching experiment
Forty-eight healthy, 1–2-year-old pearl oysters with shell lengths of 50–60 mm were selected for the shell notching experiment. After culturing in tanks with seawater for 3 d, 24 pearl oysters were randomly selected and a V-notch was snipped on each shell (Mount et al. Citation2004). The notch contained the cuticle, prismatic layer, and nacre, but not the mantle. The remaining 24 oysters received no treatment and were regarded as the negative controls. Six pearl oysters, including three treatment and three control individuals, were sampled at 0, 6, 12, 24, 36, and 48 h after treatment, respectively. The mantle and gill were isolated and total RNA was extracted. The RT-reaction was then performed using total RNA as the template. The relative expression levels of PfBMP3 were measured by qRT-PCR, as described above.
2.7. Calcium concentration
The cDNA sequence of P. fucata calmodulin (PfCaM) was obtained from the NCBI database (GenBank: AY341376.1). The primers used for qRT-PCR were then designed (PfCaM1S/A, ). Sixty pearl oysters with shell lengths of 40–50 mm were randomly separated into six groups of equal size, and cultured in six 1000-L tanks with seawater. The tanks were numbered 1, 2, 3, 4, 5, and 6, respectively. EDTA was added into Tank 1 and the concentration was maintained at 250 mg/L. Calcium chloride (CaCl2) was added into Tanks 3, 4, 5, and 6, with the concentrations maintained at 100, 200, 300, and 400 mg/L, respectively. Tank 2 was maintained as a control, without treatment. The water in each tank was renewed 20% per day and the pearl oysters were cultured with routine methods for three months. After this, all pearl oysters were harvested and shell lengths, shell widths, shell heights, and body weights were measured, with three pearl oysters then selected from each group and dissected. The mantle and gill were isolated and total RNA was extracted. The RT-reaction was then performed and the relative expression levels of PfBMP3 and PfCaM were measured using qRT-PCR, as described above.
2.8. RNA interference (RNAi)
Small interfering RNA (siRNA) was designed as previous research (Elbashir et al. Citation2001). The PfBMP3 siRNA (dsRNA-BMP3-F/R) and non-specific siRNA (dsRNA-non-specific-F/R) sequences are listed in . The non-specific siRNA was used as the negative control. The PfBMP3 siRNA and non-specific siRNA were then obtained through in vitro transcription using the in vitro Transcription T7 kit (TaKaRa, Dalian, China). The siRNA was quantified using a NanoDrop ND-1000 UV-Visible Spectrophotometer (Thermo, MA, USA) and diluted with RNase-free water.
Fifty pearl oysters with shell lengths of 40–50 mm were randomly separated into 10 groups and numbered Groups 1–10, respectively. We injected 20 μL of solution containing 0, 5, 15, 30, or 60 μg of PfBMP3 siRNA into the adductor muscles of each pearl oyster in Groups 1, 2, 3, 4, and 5, respectively. We injected 20 μL of solution containing 0, 5, 15, 30, or 60 μg non-specific siRNA into the adductor muscles of each pearl oyster in Groups 6, 7, 8, 9, and 10, respectively. All 50 pearl oysters were cultured in a 1000-L tank with seawater for 48 h. Three pearl oysters were then selected randomly from each group and dissected, with the gills isolated and total RNA extracted. The RT-reaction was performed and the relative expression levels of PfBMP3 and PfCaM were measured by qRT-PCR, as described above.
3. Results
3.1. Molecular cloning and sequence analyses of PfBMP3
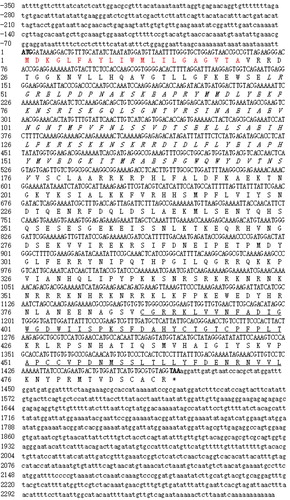
Multiple alignment using the BLAST programme showed that the obtained gene sequence was a homologous gene of BMP3, and was thus named PfBMP3. The complete cDNA sequence of PfBMP3 was 2710 bp, which contained 1470 bp of ORFs, 350 bp of 5′ untranslated regions (UTRs), and 890 bp of 3′ UTRs. The 3′ UTRs contained a typical polyadenylation signal (AATAAA). The cDNA sequence was submitted to GenBank with the Accession No. KT956999. The deduced amino acid sequence contained 489 aa. The predicted molecular weight and the theoretical isoelectric point (PI) of the protein were 56.64 kDa and 9.80, respectively. The prediction of the transmembrane structure showed that the polypeptide chain had no transmembrane structure and was located extracellularly. Analysis of the deduced amino acid sequence showed that PfBMP3 contained a signal peptide (1–21 aa), a TGF-b propeptide (49–176 aa), and a TGF-b like domain (387–488 aa) with seven conservative cysteine residues ().
Figure 1. cDNA and deduced amino acid sequence of PfBMP3. Normal and bold numbers on the left indicate the positions of the cDNA and deduced amino acid sequences, respectively. Bold letters in cDNA sequence are initiation and termination codons, respectively. Putative signal peptide is in red. TGF-b propeptide is in italics. TGF-b like domain is underlined.
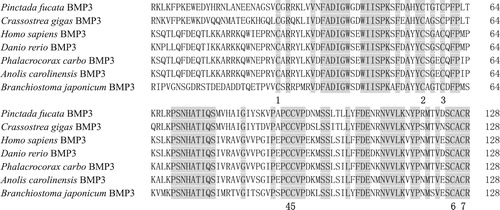
Multiple alignment also showed that the deduced amino acids of PfBMP3 shared the highest identity (64%) with BMP3 from C. gigas. In addition, PfBMP3 shared 43% identity with BMP3 of Lingula anatina, 32% with Xenopus laevis, and 30% with Danio rerio. Homologous analysis based on the mature peptides of BMP3 indicated that the mature BMP3 of P. fucata shared high identity (60–80%) with some species of vertebrates and invertebrates (e.g. C. gigas, Homo sapiens, D. rerio, Phalacrocorax carbo, Anolis carolinensis, and Branchiostoma japonicum) (). The seven cysteine residues were highly conserved among the seven species above.
Figure 2. Multiple alignments of mature BMP3 from different species. Numbers on the right indicate the positions of the amino acids of each protein. Numbers in the lower part of the alignment sequences indicate the seven shared cysteine residues among the different species. Conservative amino acids of the seven species are in white on grey background.
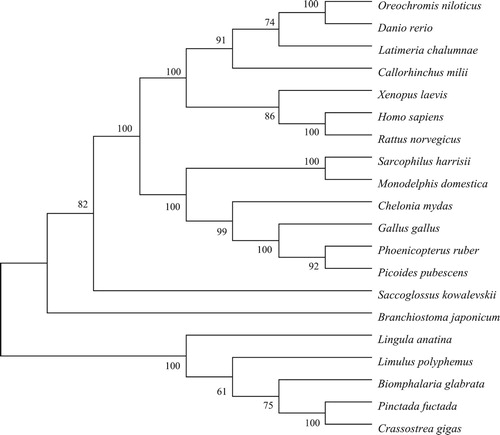
A phylogenetic tree was constructed based on the BMP3 protein sequences from the different species. Phylogenetic analysis showed that the vertebrates and invertebrates were clustered into respective groups. In the invertebrate cluster, PfBMP3 was clustered with L. anatina BMP3-like, L. polyphemus BMP3-like, B. glabrata BMP3-like, and C. gigas BMP3-like, indicating a close evolutionary relationship among these species ().
Figure 3. Phylogenetic tree based on BMP3 homologous proteins of different species.
3.2. Expression analysis of PfBMP3
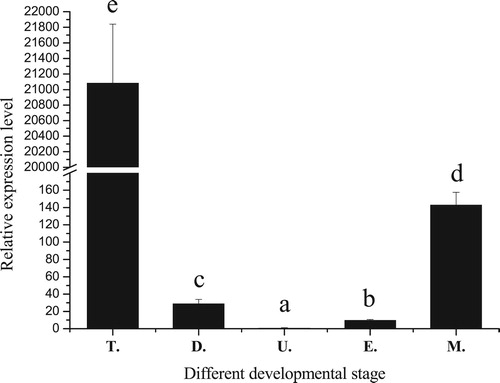
qRT-PCR demonstrated that PfBMP3 was expressed at all five stages analyzed (i.e. trochophore, D-veliger, umbo-veliger, eyespot, and metamorphic larvae). The expression levels were significantly different among the five periods, with the highest detected during the trochophore stage and the lowest during the umbo-veliger stage (). The expression of PfBMP3 during the trochophore stage showed an extremely high expression level compared with that during the other periods.
Figure 4. Relative expression levels of PfBMP3 at different developmental stages of P. fucata. T, D, U, E, and M are trochophore, D-veliger, umbo-veliger, eyespot, and metamorphic stages, respectively. Significant difference is indicated by different letters (n = 3, P < 0.05). Error bars correspond to means + SE.
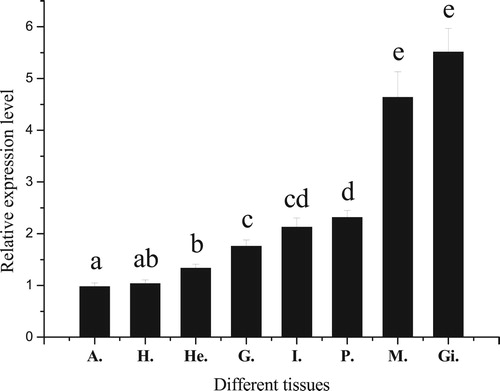
The qRT-PCR assay showed that PfBMP3 was expressed in all eight tissues analyzed (i.e. hepatopancreas, adductor muscle, hemocyte, gonad, intestine, pearl sac, mantle, and gill), with the highest expressions detected in the gill and mantle ().
Figure 5. Relative expression levels of PfBMP3 in different tissues of P. fucata. H, A, He, G, I, P, M, and Gi are hepatopancreas, adductor muscle, hemocyte, gonad, intestine, pearl sac, mantle, and gill, respectively. Significant difference is indicated by different letters (n = 3, P < 0.05). Error bars correspond to means + SE.
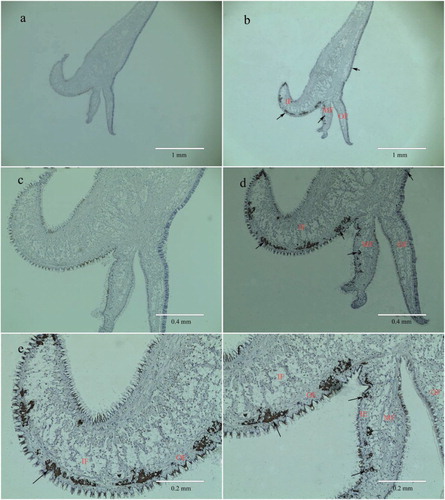
In situ hybridization was performed to determine the precise location of PfBMP3 expression in the mantle of P. fucata. Strong hybridization signals of PfBMP3 mRNA were detected in the epidermal cells on both the inner side of the inner fold and the outer side of the middle fold, and slight hybridization signals were found in the outer epidermis of the mantle ().
Figure 6. In situ hybridization of PfBMP3 in the mantle. Frames a and c are negative control. Frame b is positive result. Frames d, e, and f are higher magnifications of b. Brown hybridization signal is indicated by arrow. IF, MF, OF, OE, and IE are inner fold, middle fold, open fold, open epithelium, and inner epithelium, respectively.
3.3. High expression of PfBMP3 during shell regeneration
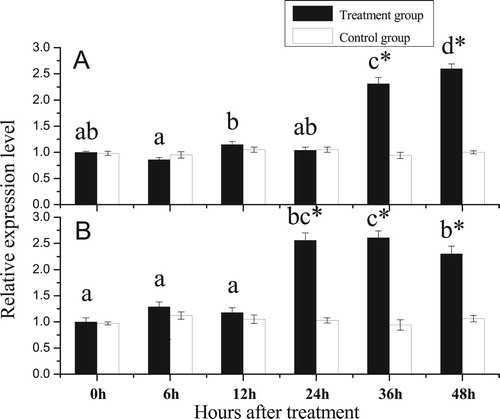
Forty-eight hours after shell notching, newly semitransparent thin shells, which were observed by the naked eye, appeared in the notched shell (). qRT-PCR analysis of the gill indicated that, compared with 0 h after shell notching, the PfBMP3 expression levels did not show significant variation after 6, 12, and 24 h, but did demonstrate significant increase after 36 h. qRT-PCR analysis of the mantle showed similar results, but the expression levels of PfBMP3 significantly increased after 24 h ().
Figure 7. Pinctada fucata after notching. Frames a and b are P. fucata at 0 and 48 h after treatment, respectively.
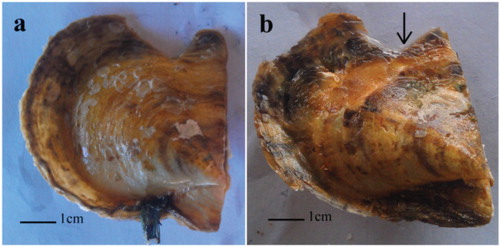
Figure 8. Relative expression levels of PfBMP3 at different times after shell notching. A and B are analysis results of the gill and mantle. Different lower-case letters indicate a significant difference in gene expression levels between different treatment groups (n = 3, P < 0.05). * indicates significantly different compared with control (n = 3, P < 0.05). Error bars correspond to means + SE.
3.4. Concentration of calcium influences the expression levels of PfBMP3 and PfCaM
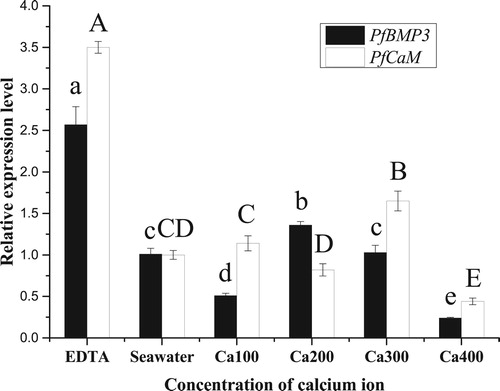
The qRT-PCR analysis of the gill indicated that the expression level of PfBMP3 in the EDTA group was significantly higher than that in the other groups and was 2.5 times as high as the seawater group. In addition, the expression level of PfBMP3 in the calcium-100 group (with calcium ion concentration of 100 mg/L) was higher, in the calcium-200 group and calcium-400 group was lower, and the calcium-300 group was not significantly different from that in the seawater group. The expression level of PfCaM in the EDTA group was significantly higher than that in the other groups and was 3.5 times as high as the seawater group. In addition, the expression level of PfCaM in the calcium-300 group was higher, in the calcium-400 group was lower, and in the calcium-100 group and calcium-200 group was not significantly different from that in the seawater group ().
Figure 9. Relative expression levels of PfBMP3 and PfCaM in the gill under different calcium ion concentrations. Different lower-case letters indicate significant differences in PfBMP3 gene expression levels between different treatment groups (n = 3, P < 0.05). Different upper-case letters indicate significant differences in PfCaM gene expression levels between different treatment groups (n = 3, P < 0.05). Error bars correspond to means + SE.
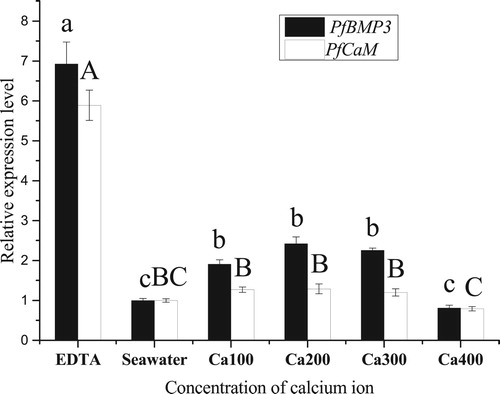
The qRT-PCR analysis of the mantle indicated that the expression level of PfBMP3 in the EDTA group was significantly higher than that in the other groups and was seven times as high as the seawater group. In addition, the expression level of PfBMP3 in the calcium-100 group, calcium-200 group, and calcium-300 group was higher than that in the seawater group, whereas that in the calcium-400 group was not significantly different from the seawater group. The expression level of PfCaM in the EDTA group was significantly higher than that in the other groups and was six times as high as the seawater group, whereas that in the calcium-100 group, calcium-200 group, calcium-300 group, and calcium-400 group was not significantly different to that in the seawater group ().
Figure 10. Relative expression levels of PfBMP3 and PfCaM in the mantle under different calcium ion concentrations. Different lower-case letters indicate significant differences in PfBMP3 gene expression levels between different treatment groups (n = 3, P < 0.05). Different upper-case letters indicate significant differences in PfCaM gene expression levels between different treatment groups (n = 3, P < 0.05). Error bars correspond to means + SE.
Overall, the expression levels of the two genes (PfBMP3 and PfCaM) in the EDTA group were significant higher than that in the seawater group, whereas the levels in the four groups with added calcium were not significantly different from the levels in the seawater group. Furthermore, the expression levels of the two genes showed similar change tendencies.
3.5. Relative expression level of CaM declined after RNAi of PfBMP3
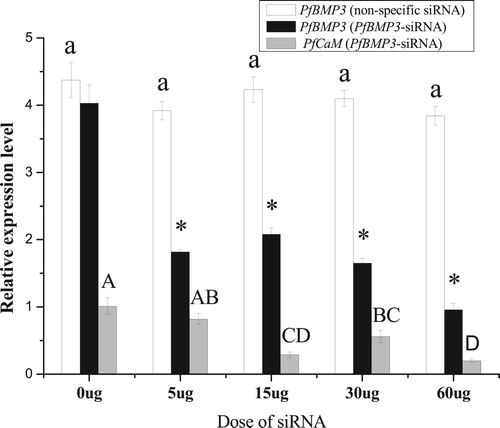
qRT-PCR analysis of the gill was performed after RNAi treatment. In the negative control groups, the expression levels of PfBMP3 with five different doses of non-specific siRNA exhibited no significant differences. In the PfBMP3-siRNA treatment groups, the PfBMP3 expression level in the 0-μg group (i.e. without PfBMP3-siRNA treatment) showed no significant difference to the negative control group; however, the 5, 15, 30, and 60-μg groups were all significantly lower than that of the negative control group. Compared with the 0-μg group, the PfCaM expression levels in the 15, 30, and 60-μg groups all decreased significantly ().
Figure 11. Relative expression levels of PfBMP3 and PfCaM in the gill after RNAi. Colourless columns are relative expression levels of PfBMP3 in the control groups treated with non-specific siRNA. Black columns are relative expression levels of PfBMP3 in groups treated with PfBMP3-siRNA, * indicates significant differences compared with control (n = 3, P < 0.05). Grey columns are relative expression levels of PfCaM. Different upper-case letters indicate significant differences in PfCaM gene expression levels between different treatment groups (n = 3, P < 0.05). Error bars correspond to means + SE.
4. Discussion
This study cloned PfBMP3, the encoding protein of which contained a signal peptide, prodomain, and mature peptide region. The mature peptide contained a TGF-β domain with seven conserved cysteine residues. These structural features all conformed to the typical traits of BMP family members. The encoding protein shared the highest identity with BMP3 from C. gigas, and was thus assumed to be closely related to P. fucata. The encoding protein of PfBMP3 also shared relatively high identity with some vertebrates (e.g. X. laevis and D. rerio), indicating its identity in function.
The genes of the BMP family play important regulation roles in the larval development of vertebrates (Cheng et al. Citation2004). Considering the structural similarity between vertebrate and invertebrate BMPs, the role of BMPs in the larval development of invertebrates, such as molluscs, is an important area of study. Researchers have examined the expression of BMP family genes in the embryos of molluscs, and determined that such genes participate in early embryonic development. Dpp is a homeotic gene of BMP2/4. Dpp was expressed in the hinge region after shell field evagination, and thus likely to be involved in the establishment of the hinge structure (Kin et al. Citation2009). BMP2/4 from P. vulgata was expressed in cells of the surrounding ectoderm, and concluded that this gene was likely involved in shell formation as well as in establishing the compartment boundary between the embryonic shell and adjacent ectoderm (Nederbragt et al. Citation2002). BMP2 of C. farreri was strongly expressed in the gastrulae, but weakly in the trochophore, D-shaped, and veliger stages in, thus indicating its involvement in organogenesis (Feng et al. Citation2013). In the present study, PfBMP3 was highly expressed in the trochophore and metamorphosis stages. Regarding the development of mollusc embryos, Kakoi et al. and Silberfeld et al. studied S. kegaki and Tivela mactroides, respectively, and determined that larval shell-glands began to evaginate and synthesize the organic part of the shell in the trochophore stage (Kakoi et al. Citation2008; Silberfeld and Gros Citation2006). The extremely high expression of PfBMP3 in the trochophore stage suggests its vital function during this developmental stage. PfBMP3 was also relatively highly expressed in the metamorphosis stage. Mollusc larvae in that stage undergo a series of physiological and morphological changes involved in organogenesis, cell differentiation, and apoptosis, such as the disappearance of the velum and initial utilization of the gill. Thus, we speculated that PfBMP3 might play a role in development regulation during the trochophore and metamorphosis stage in P. fucata, and might be involved in the formation of organs such as the shell and gill.
Researchers have studied the expression patterns of some BMP family genes in different mollusc tissues. BMP2 gene from C. farreri was highly expressed in the gill and mantle (Feng et al. Citation2013). Expression of BMP2 in P. fucata was predominant in the mantle, gill, and liver, and further confirmed that the gene was mainly expressed in the outer epithelia in the inner part of the mantle and the inner epithelial cells of the outer fold of the mantle edge, proposing that BMP2 plays a key role in nacre formation (Miyashita et al. Citation2008). BMP7 was highly expressed in the mantle and gill of P. fucata, and that it likely participated in shell formation (Yan et al. Citation2014). In the present study, PfBMP3 was distributed widely in all eight examined tissues of P. fucata, with high expression in the gill and mantle, the main shell formation tissues, indicating that PfBMP3 plays an important role in shell formation. In situ hybridization in the mantle indicated that PfBMP3 was expressed in the outer epidermis, which is responsible for nacreous and prismatic layer formation. Using RNAi technology, BMP7 of P. fucata was significantly down-regulated (p < 0.05) in the mantle pallium and the mantle edge after injected ds-BMP7. A disordered growth status was observed in the nacre and obvious holes in the prismatic layer (Yan et al. Citation2014). In contrast to the BMP2 and BMP7 results, PfBMP3 mRNA was detected in the epidermal cells on both the inner side of the inner fold and the outer side of the middle fold, but not in the inner fold, suggesting that PfBMP3 might have some same functions with BMP7 and different from BMP2.
Shell notching is an effective method in shell regeneration research. In the present study, a semitransparent, thin layer of the newly formed shell was observed over the shell notch 48 h after treatment. Based on qRT-PCR analysis, PfBMP3 expression in the gill and mantle significantly increased at 36 and 24 h after treatment, respectively, indicating that the gene participated in shell regeneration after injury. Notably, the up-regulation in PfBMP3 expression in the mantle was detected more rapidly after treatment than that in the gill. This might be because the mantle is more directly related to shell formation, and thus may respond to shell injury more quickly. Experiments in P. fucata, and found that the expression of BMP2 of in P. fucata mantle was significantly increased 6 h after shell notching, confirming its involvement in shell regeneration after injury (Zhou et al. Citation2010). Compared with the results, the up-regulation in PfBMP3 expression was detected at a longer time after shell notching in this study. The difference in time may reflect the different roles or action pathways of different substances participating in shell regeneration.
Generally, substances involved in mollusc shell formation are highly expressed in the mantle, which is the main organ responsible for shell formation(Freer et al. Citation2014; Miyamoto et al. Citation1996). The current study demonstrated that PfBMP3 was highly expressed in the gill. Both BMP2 and BMP7 in P. fucata and BMP2 in C. farreri have also been found to be highly expressed in the gill(Yan et al. Citation2014; Zhou et al. Citation2010; Feng et al. Citation2013). Molluscs obtain calcium through the gill from external media and transport it to the mantle epithelium, where it is used for shell formation (Li et al. Citation2004; Li et al. Citation2005). Regarding the function of the BMP family genes highly expressed in the gill, one possible assumption is that the genes are involved in calcium metabolism. To verify this, we performed pearl oyster culture experiments at different calcium concentrations. After three months of culture, the phenotypic changes were not significantly different, indicating that the concentration of calcium, within the presumed scale of this study, did not influence the speed of pearl oyster growth, even at low concentrations (i.e. EDTA group). This might be due to pearl oysters having a sophisticated calcium metabolism regulation system, which helps it adapt to changes in environmental calcium concentrations within a certain range and still maintain regular growth (Li et al. Citation2005). Additionally, the present study only evaluated phenotypic data, from which the potential internal influence on P. fucata caused by environmental calcium concentrations cannot be verified. Expression analysis indicated that, consistent in the mantle and gill, PfBMP3 and PfCaM both showed enhanced expression after the P. fucata were cultured in low (lower than seawater) calcium concentration water. In marine bivalves, CaM is a regulator of the membrane Ca2+-ATPase system that is responsible for uptake, transportation, and secretion of Ca2+ in gill (Li et al. Citation2004). The expression of CaM in the Hyriopsis cumingii was up-regulated by low Ca2+ concentration,which was same with our result. As the main calcium metabolism regulator, we speculated that PfCaM could promote calcium uptake and transportation when the environmental calcium was insufficient by enhancing expression, and thus maintaining regular calcium metabolism. PfBMP3 showed the same expression change tendency as that of PfCaM, suggesting that PfBMP3 might also participate in calcium metabolism regulation.
To explore the possible correlation between PfBMP3 and PfCaM, we performed a RNAi experiment to silence PfBMP3. The PfBMP3 expression level in the PfBMP3-siRNA treatment group was significantly lower than that in the control group, indicating that the expression level of endogenous PfBMP3 was reduced by RNAi treatment. In addition, the down-regulation in the expression of PfCaM in the PfBMP3-siRNA treatment group indicated an association between the expression regulation of the two genes. Additionally, PfBMP3 might participate in calcium metabolism regulation in shell formation of P. fucata through action on PfCaM. The action might be the direct regulation of PfBMP3 on PfCaM, or indirect influence based on the calcium metabolism pathway. As we could only infer the association between PfBMP3 and PfCaM at the gene level, further studies at the protein and in vitro levels are required for firm conclusion. Whether other BMP family genes with high expression levels in the gill and mantle, including BMP2 from C. farreri and BMP2 and BMP7 from P. fucata, take part in calcium metabolism regulation also needs further investigation.
The PfBMP3 gene is another BMP family gene identified from P. fucata, like the previously identified BMP2 and BMP7 genes (Yan et al. Citation2014; Zhou et al. Citation2010). In consideration of its functional similarity and complementarity with other BMP family members, the identification of this gene lays a foundation for studies on and application of mixed proteins (Bessho et al. Citation1999; Carreira et al. Citation2014).
Disclosure statement
No potential conflict of interest was reported by the authors.
Additional information
Funding
References
- Bessho K , Kusumoto K , Fujimura K , Konishi Y , Ogawa Y , Tani Y , Iizuka T. 1999. Comparison of recombinant and purified human bone morphogenetic protein. Br J Oral Maxillofac Surg. 37(1):2–5. doi: 10.1054/bjom.1998.0379
- Bibbo C , Nelson J , Ehrlich D , Rougeux B. 2014. Bone morphogenetic proteins: indications and uses. Clin Podiatr Med Surg. 32(1):35–43. doi: 10.1016/j.cpm.2014.09.005
- Bishop GB , Einhorn TA. 2007. Current and future clinical applications of bone morphogenetic proteins in orthopaedic trauma surgery. Int Orthop. 31(6):721–727. doi: 10.1007/s00264-007-0424-8
- Butler SJ , Dodd J. 2003. A role for BMP heterodimers in roof plate-mediated repulsion of commissural axons. Neuron. 38(3):389–401. doi: 10.1016/S0896-6273(03)00254-X
- Carreira AC , Alves GG , Zambuzzi WF , Sogayar MC , Granjeiro JM. 2014. Bone morphogenetic proteins: structure, biological function and therapeutic applications. Arch Biochem Biophys. 561(6):64–73. doi: 10.1016/j.abb.2014.07.011
- Cheng H , Jiang W , Phillips FM , Haydon R , Peng Y , Zhou L , Luu H , An N , Breyer B , Vanichakarn P. 2004. Osteogenic activity of the fourteen types of human bone morphogenetic proteins (BMPs). Urol Oncol Semin Orig Invest. 22(1):79–80.
- Daluiski A , Engstrand T , Bahamonde ME , Gamer LW , Agius E , Stevenson SL , Cox K , Rosen V , Lyons KM. 2001. Bone morphogenetic protein-3 is a negative regulator of bone density. Nat Genet. 27(1):84–88. doi: 10.1038/83810
- Ducy P , Karsenty G. 2000. The family of bone morphogenetic proteins. Kidney Int. 57(6):2207–2214. doi: 10.1046/j.1523-1755.2000.00081.x
- Elbashir SM , Harborth J , Lendeckel W , Yalcin A , Weber K , Tuschl T. 2001. Duplexes of 21-nucleotide RNAs mediate RNA interference in cultured mammalian cells. Nature. 411(6836):494–498. doi: 10.1038/35078107
- Fang Z , Yan Z , Li S , Wang Q , Cao W , Xu G , Xiong X , Xie L , Zhang R. 2008. Localization of calmodulin and calmodulin-like protein and their functions in biomineralization in P. fucata . Prog Nat Sci: Mater Int. 18(4):405–412. doi: 10.1016/j.pnsc.2007.11.011
- Feng XH , Derynck R. 2005. Specificity and versatility in TGF-beta signaling through Smads. Annu Rev Cell Dev Biol. 21(1):659–693. doi: 10.1146/annurev.cellbio.21.022404.142018
- Feng LY , Guo HH , Li X , Yu Q , Hu XL , Zhang LL , Wang S , Bao ZM. 2013. Cloning and expression analysis of bone morphogenetic protein 2 gene of Chlamys farreri . Periodical of Ocean University of China (Natural Science Edition). 43(12):37–43. (Abstract in English only).
- Freer A , Bridgett S , Jiang J , Cusack M. 2014. Biomineral proteins from Mytilus edulis mantle tissue transcriptome. Mar Biotechnol. 16(1):34–45. doi: 10.1007/s10126-013-9516-1
- Gamer LW , Cox K , Carlo JM , Rosen V. 2009. Overexpression of BMP3 in the developing skeleton alters endochondral bone formation resulting in spontaneous rib fractures. Dev Dyn. 238(9):2374–2381. doi: 10.1002/dvdy.22048
- Griffith DL , Keck PC , Sampath TK , Rueger DC , Carlson WD. 1996. Three-dimensional structure of recombinant human osteogenic protein 1: structural paradigm for the transforming growth factor beta superfamily. Proc Natl Acad Sci U S A. 93(2):878–883. doi: 10.1073/pnas.93.2.878
- Jia S , Dai F , Wu D , Lin X , Xing C , Xue Y , Wang Y , Xiao M , Wu W , Feng XH. 2012. Protein phosphatase 4 cooperates with Smads to promote BMP signaling in dorsoventral patterning of zebrafish embryos. Dev Cell. 22(5):1065–1078. doi: 10.1016/j.devcel.2012.03.001
- Kakoi S , Kin K , Miyazaki K , Wada H. 2008. Early development of the Japanese spiny oyster (Saccostrea kegaki): characterization of some genetic markers. Zoolog Sci. 25(5):455–464. doi: 10.2108/zsj.25.455
- Kin K , Kakoi S , Wada H. 2009. A novel role for dpp in the shaping of bivalve shells revealed in a conserved molluscan developmental program. Dev Biol. 329(1):152–166. doi: 10.1016/j.ydbio.2009.01.021
- Kücükarslan S , Coskun SB. 2012. BMP3 suppresses osteoblast differentiation of bone marrow stromal cells via interaction with Acvr2b. Mol Endocrinol. 26(1):87–94. doi: 10.1210/me.2011-1168
- Lelong C , Mathieu M , Favrel P. 2000. Structure and expression of mGDF, a new member of the transforming growth factor-beta superfamily in the bivalve mollusc Crassostrea gigas . Eur J Biochem. 267(13):3986–3993. doi: 10.1046/j.1432-1327.2000.01432.x
- Li S , Xie L , Ma Z , Zhang R. 2005. cDNA cloning and characterization of a novel calmodulin-like protein from pearl oyster Pinctada fucata . FEBS J. 272(19):4899–4910. doi: 10.1111/j.1742-4658.2005.04899.x
- Li S , Xie L , Zhang C , Zhang Y , Gu M , Zhang R. 2004. Cloning and expression of a pivotal calcium metabolism regulator: calmodulin involved in shell formation from pearl oyster (Pinctada fucata). Comp Biochem Physiol B Biochem Mol Biol. 138(3):235–243. doi: 10.1016/j.cbpc.2004.03.012
- Liu A , Niswander LA. 2005. Bone morphogenetic protein signalling and vertebrate nervous system development. Nat Rev Neurosci. 6(12):945–954. doi: 10.1038/nrn1805
- Livak KJ , Schmittgen TD. 2012. Analysis of relative gene expression data using real-time quantitative PCR and the 2(-delta delta C(T)) method. Methods. 25(4):402–408. doi: 10.1006/meth.2001.1262
- Mann S , Heywood BR , Rajam S , Wade VJ. 1988. Molecular recognition in biomineralization. Nature. 332(6160):119–124. doi: 10.1038/332119a0
- Massagué J. 1998. TGF-beta signal transduction. Annu Rev Biochem. 67(1-2):753–791. doi: 10.1146/annurev.biochem.67.1.753
- Miyamoto H , Miyashita T , Okushima M , Nakano S , Morita T , Matsushiro A. 1996. A carbonic anhydrase from the nacreous layer in oyster pearls. Proc Natl Acad Sci USA. 93(18):9657–9660. doi: 10.1073/pnas.93.18.9657
- Miyashita T , Hanashita T , Toriyama M , Takagi R , Akashika T , Higashikubo N. 2008. Gene cloning and biochemical characterization of the BMP-2 of Pinctada fucata . Biosci Biotechnol Biochem. 72(1):37–47. doi: 10.1271/bbb.70302
- Mount AS , Wheeler AP , Paradkar RP , Snider D. 2004. Hemocyte-mediated shell mineralization in the eastern oyster. Science. 304(5668):297–300. doi: 10.1126/science.1090506
- Nederbragt AJ , van Loon AE , Dictus WJ. 2002. Expression of Patella vulgata orthologs of engrailed and dpp-BMP2/4 in adjacent domains during molluscan shell development suggests a conserved compartment boundary mechanism. Dev Biol. 246(2):341–355. doi: 10.1006/dbio.2002.0653
- Rahman MS , Akhtar N , Jamil HM , Banik RS , Asaduzzaman SM. 2015. TGF-β/BMP signaling and other molecular events: regulation of osteoblastogenesis and bone formation. Bone Res. 3(1):11–30. doi: 10.1038/boneres.2015.5
- Rashid F , Shiba H , Mizuno N , Mouri Y , Fujita T , Shinohara H , Ogawa T , Kawaguchi H , Kurihara H. 2003. The effect of extracellular calcium ion on gene expression of bone-related proteins in human pulp cells. J Endod. 29(2):104–107. doi: 10.1097/00004770-200302000-00004
- Setiamarga DH , Shimizu K , Kuroda J , Inamura K , Sato K , Isowa Y , Ishikawa M , Maeda R , Nakano T , Yamakawa T , et al. 2013. An in-silico genomic survey to annotate genes coding for early development-relevant signaling molecules in the pearl oyster, Pinctada fucata . Zoolog Sci. 30(10):877–888. doi: 10.2108/zsj.30.877
- Shi Y , Massagué J. 2003. Mechanisms of TGF-beta signaling from cell membrane to the nucleus. Cell. 113(6):685–700. doi: 10.1016/S0092-8674(03)00432-X
- Silberfeld T , Gros O. 2006. Embryonic development of the tropical bivalve Tivela mactroides (Born, 1778) (veneridae: subfamily meretricinae): a SEM study. Cah Biol Mar. 47(3):243–251.
- Sipe JB , Zhang J , Waits C , Skikne B , Garimella R , Anderson HC. 2004. Localization of bone morphogenetic proteins (BMPs)-2, -4, and -6 within megakaryocytes and platelets. Bone. 35(6):1316–1322. doi: 10.1016/j.bone.2004.08.020
- Yan Z , Fang Z , Ma Z , Deng J , Li S , Xie L , Zhang R. 2007. Biomineralization: functions of calmodulin-like protein in the shell formation of pearl oyster. Biochim Biophys Acta Gen Subj. 1770(9):1338–1344. doi: 10.1016/j.bbagen.2007.06.018
- Yan F , Luo S , Jiao Y , Deng Y , Du X , Huang R , Wang Q , Chen W. 2014. Molecular characterization of the BMP7 gene and its potential role in shell formation in Pinctada martensii . Int J Mol Sci. 15(11):21215–21228. doi: 10.3390/ijms151121215
- Zhou YJ , He ZX , Li CZ , Xiang L , Zhu FJ , Zhang GY , Xie LP , Zhang RQ. 2010. Correlations among mRNA expression levels of engrailed, BMP2 and Smad3 in mantle cells of pearl oyster Pinctada fucata . Prog Biochem Biophys. 37(7):737–746. (Abstract in English only). doi: 10.3724/SP.J.1206.2010.00040
- Zylbersztejn F , Flores-Violante M , Voeltzel T , Nicolini FE , Lefort S , Maguer-Satta V. 2018. The BMP pathway: a unique tool to decode origin and progression of leukemia. Exp Hematol. 61:36–44. doi: 10.1016/j.exphem.2018.02.005