
 ?Mathematical formulae have been encoded as MathML and are displayed in this HTML version using MathJax in order to improve their display. Uncheck the box to turn MathJax off. This feature requires Javascript. Click on a formula to zoom.
ABSTRACT
A previous study using next-generation sequencing illustrated and confirmed that the cholinergic receptor muscarinic 3 (CHRM3) gene resides within CNVRs of yak populations that overlap with quantitative trait loci (QTL) relating to meat quality and growth, and plays a prominent role in smooth muscle contraction. This study was conducted to determine the distribution of the CNVs of the CHRM3 gene in five Chinese domestic yak breeds and to investigate the influences of the CHRM3 gene on the gene expression and growth traits of the Datong yak. The data were analyzed by ANOVA using SPSS software. Our results revealed that a gain CNV type in the CHRM3 gene is more highly associated (P < 0.05) with various growth traits in six-month-old and five-year-old Datong yaks. The gain CNV type of the CHRM3 gene more frequently occurred than loss and normal types in all yak breeds. Nevertheless, the CHRM3 gene copy number had a highly significant (P < 0.0012) and moderately negative correlation with the mRNA transcription levels were determined in the skeletal muscle of Chinese Datong yaks. Therefore, we concluded that this study provided inclusive information on the application of CNVs of the CHRM3 in growth traits and its possible function.
KEYWORDS:
Introduction
Growth is an economically considerable quantitative phenotypic trait in animal breeding which directly affects meat production. Body measurements (e.g. body weight, chest girth, body length, and height) are widely utilized in designing breeding selections and in the prediction of the live time productivity of dairy and beef animals. Based on different factors, the alternation of complex gene expression levels and genomic copy number variations (CNVs) are the two mechanisms which control growth traits (Zhou et al. Citation2016). Genetic markers associated with quantitative phenotype traits were detected through many genomic variations, namely microsatellite (Yoo et al. Citation2014) and single nucleotide polymorphism (SNP) (Lee et al. Citation2008). As Dekkers report (Citation2004), genetic markers have provided opportunities to enhance the selection for economically crucial quantitative traits in beef cattle, especially for traits that are difficult to improve by conventional selections. The main goal in the application of genetic markers towards livestock breeding goals is the detection of genes which are important for quantitative traits. These are implicated in phenotypes variations and their interaction with the gene-environment or economic traits. CNVs are structural changes in the genome regions which constitute a major source of inter-individual genetic and phenotypic variation (Beckmann et al. Citation2007). CNVs are another class of genetic markers which can be used through the mechanisms of gene dosage, gene disruption, position effects, gene fusion, altering the structure of gene transcripts, directly altering the coding sequence of mRNAs, and unmasking of recessive coding region mutations (Lupski and Stankiewicz Citation2005; Zhang et al. Citation2009; Conrad et al. Citation2010). CNVs play a vital role in the genetic diversity and evolution of domestic livestock species as the number of variable nucleotides present in copy number variable regions (CNVR) tend to account for more bases in the genome than those influenced by SNPs (Redon et al. Citation2006). CNVs should be defined as unbalanced rearrangements that involve the duplication or deletion of genomic segments greater than 1 kb (Feuk et al. Citation2006).
The effects of CNVs on phenotype traits have been elucidated in different domestic animals. For example, studies have linked many phenotypic traits to CNVs, including the effects of the CNVs of potassium voltage-gated channel subfamily J member 12 (KCNJ12) gene is significantly associated with growth traits and plays critical roles in muscle traits in Bos indicus (Zhou et al. Citation2016). The association of CNVs with growth traits was recently explored for meat tenderness, feed conversion ratio, shear force, residual feed intake and marbling score in a Nellore cattle (Da Silva et al. Citation2016).
A previous study using next-generation sequencing illustrated and confirmed that the CHRM3 gene resides within CNVRs of yak populations that overlap with quantitative trait loci (QTL) relating to meat quality and growth (Zhang et al. Citation2016). Nevertheless, the relationship between growth traits and the function of CNV of the CHRM3 gene of Chinese domestic yak breeds has not been investigated. Therefore, the objectives of the current study were to determine the distribution of CHRM3 CNVs in Chinese domestic yak breeds and to investigate the influence of CNVs of the CHRM3 gene on gene expression and growth traits of the Datong yak.
Materials and methods
The study was conducted between September 2016 and December 2017 at the Key Laboratory of Yak Breeding Engineering of Gansu Province of the Lanzhou Institute of Husbandry and Pharmaceutical Sciences, and the data were obtained from yak breeding cooperatives of Gansu and Qinghai Province, China. All of the blood sample collection and body measurements were performed in strict accordance with the guide for the Care and Use of Laboratory Animals, Lanzhou Institute of Husbandry Animal and Pharmaceutical Sciences, China. Additionally, all the animals were slaughtered under anesthesia, and all necessary efforts were made to minimize the risk of suffering. Thus, we were granted permission to perform this research study on yaks. The legal certificate number was SCXK (Gan) 2014-0002.
Study locations
At present, Chinese domestic yak breeding is carried out for meat and milk production. For this work, five representative Chinese domestic yak breeds were selected. These were the polled yak (Datong Yak Farm in Qinghai Province; altitude: 3200 m), Tianzhu white yak (Tianzhu Tibetan Autonomous County in Gansu Province; altitude: 3000 m), plateau yak (northern and southern Qinghai Province; altitude: 3700–4700 m), Datong yak (Datong Yak Farm in Qinghai Province; altitude: 3200 m), and Gannan yak (Gansu Province, bordering Sichuan and Qinghai; altitude: 3300–4400 m).
The animals were in good physical condition and selected animals that were genetically unrelated. All the yaks were allowed to graze on natural pastures without feed supplementation, under similar feeding conditions and management. Various quantitative traits, namely, body weight, body height, body length, chest girth and cannon width, of the 387 individual of Datong yak at 6 months (n = 222), 3 years(n = 72) and 5 years (n = 93) of age were collected for associated studies. The body measurements were performed according to the method described by Gilbert et al. (Citation1993).
Sample collection for genomic DNA and RNA purification
Fresh blood samples were gathered from a total of 507 yaks (387 Datong yaks, 30 polled yaks, 30 Tianzhu yaks, 30 Gannan yaks, and 30 plateau yaks). The blood samples were taken from the jugular vein and collected in vacuum tubes (5 mL). The Datong yak tissue samples used in this study were obtained from three (n = 3) 90-day-old fetal (embryos) and three (n = 3) three-year-old adults. These samples included skeletal muscle, heart, liver, lung, brain, spleen, kidney, and adipose tissues. However, no adipose tissue was collected for the fetal samples. Additional skeletal muscle tissues were gathered from adult Datong yaks (n = 82) for total RNA and genomic DNA studies. After collection, these blood and tissue samples were stored at −80 °C for DNA and RNA isolation. Genomic DNA was purified from the blood samples using the Clot Blood DNA Kit (CWBIO, China, Beijing) and cleaned through genomic DNA clean up (>10 kb) using the E.Z.N.A. Microelute DNA Clean-Up Kit (Omega Bio-tek, Norwalk, GA, USA), following the manufacturer’s instructions. Genomic DNA was isolated from the skeletal muscle samples using a DNeasy Blood and Tissue Kit (QIAGEN). Similarly, total RNA was extracted from the tissue samples using the RNeasy Blood and Tissue Kit (QIAGEN), according to the manufacturer’s instructions. The concentration and quality of the RNA or DNA were determined using a NanoDrop Biophotometer 2000 (Thermo Fisher Scientific, Inc., Waltham, MA, USA) and using electrophoresis on 1% agarose gels with ethidium bromide staining. Complementary DNA (cDNA) was synthesized from 1 μg of RNA through reverse transcription using a PrimeScript RT Reagent Kit with a gDNA Eraser (TaKaRa Bio Inc., Shiga, Japan).
Primer design and PCR amplification
Based on the bovine gene sequences, a pair of primers was designed for CNV and gene expression of the CHRM3 gene using the National center for Biotechnology information (NCBI) primer-BLAST web tool (https://www.ncbi.nlm.nih.gov/tools/primer-blast/index.cgi?LINK_LOC=blastHome) (). The polymerase chain reaction (PCR) mixture contained 50 ng of gDNA or cDNA, GoTaq Green Master Mix (2X), 10 μM of primer, and nuclease-free water (ddH2O) were used to check the amplification of primers in a final volume of 25 μL (Promega, Madison, WI, USA). The following thermal cycling procedure was applied: an initial denaturation step at 95 °C for 2 min, followed by 35 cycles of denaturation at 95 °C for 1 min, annealing at 55–60 °C for 1 min, and extension at 72 °C for 1 min. This was followed by a final extension step at 72 °C for 5 min and holding the tubes at 4 °C thereafter. The PCR products were loaded directly into 1.0% agarose gels because GoTaq Green Master Mix reaction buffer contains dyes that have sufficient density to sink in the wells of agarose or non-denaturing Tris/Borate/EDTA, (TBE) polyacrylamide gels. The amplification primers were also checked using qPCR melting curve analysis.
Table 1. qPCR primers designed based on bovine genomic sequences.
Copy number variation and gene expression analysis
The primers designed for studying CNV and gene expression are listed in . The relative CNVs and expression of the bovine CHRM3 gene were investigated in this study using quantitative real-time polymerase chain reaction (qPCR). As a diploid internal reference gene for genomic qPCR, bovine basic transcription factor 3 (BTF3) was used because neither CNV nor segmental duplication in this gene was found in the Database of Genomic Variants (Bickhart et al. Citation2012). For the gene expression study, bovine glyceraldehyde-3-phosphate dehydrogenase gene (GAPDH) was chosen as the reference gene. GAPDH is commonly used by biological researchers as a control for qPCR owing to its stable and constitutive expression at high levels in most tissues and cells, and it is considered a housekeeping gene (Butte et al. Citation2001). The relative mRNA expression and CNV of the CHRM3 gene were performed by qPCR using the Bio-Rad CFX96 Real-Time Detection System (Bio-Rad, Hercules, CA, USA). The PCR reaction was carried out in a total reaction volume of 25 μL, containing 50 ng of gDNA or cDNA, 12.5 μL of SYBR Premix Ex Taq II (2X) (Tli RNase H Plus), and 10 pmol of primers (TaKaRa Bio, Inc., Shiga, Japan). The following thermal cycling procedure was applied: an initial denaturation step at 95 °C for 1 min, 39 cycles of denaturation at 95 °C for 10 s, annealing at 60 °C for 30 s, and extension at 68 °C for 10 s. The no-template control reactions were included in the qPCR. All the experiments were performed in triplicate, and the mean value and standard deviation were used for the statistical analysis.
Statistical analysis
The threshold cycle (ΔΔCt) values were used to determine the relative copy number (Bae et al. Citation2010). The copy number of the DNA was calculated using the average of the ΔΔCt values for the three replicates. It is normalized against the reference gene, BTF3, by subtracting the BTF3 Ct value from the sample Ct value for each replicate. The final copy number value was determined using the formula 2 × 2 −ΔΔCt (Bae et al. Citation2010), where two copy numbers (diploid) represented a normal DNA copy number (Yim et al. Citation2011). The Ct values were converted to the nearest integer as described elsewhere (Xu et al. Citation2014; Liu et al. Citation2016; Shi et al. Citation2016). The quantitative mRNA expression level of the target gene was determined using the threshold cycle 2−ΔΔCt method (Schmittgen and Livak Citation2008). The association between the CNV types of the CHRM3 gene and the growth traits in the Datong yak breed was determined using an analysis of variance (ANOVA) with the SPSS software (IBM SPSS 20, Hausmalt,CH,Switzerland). In the biostatistical model, the CNV types were grouped into loss (≤1 copy number), gain (>2 copy number), or normal (=2 copy number), as described elsewhere (Xu et al. Citation2014; Liu et al. Citation2016; Shi et al. Citation2016). The following analytical models were fitted for growth traits:To where Yij; is the observation of the growth traits; μ is the overall mean of each growth traits, CNVi represents the fixed effects of the ith CNV type (i = 1, 2, 3) of CHRM3 gene, Aj is the fixed effect of the jth age (j = 1, 2, 3), and εij is the random residual error. Moreover, the Bonferroni correction, which presents a modified significance criterion (p/m, where m is the overall number of independent statistical tests conducted on the given data and p is the significance level of 0.05), was utilized to avoid type I errors derived from multiple comparisons (Xu et al. Citation2014).
The diversity between yak breeds were determined relative to the control sample using the log2 ratio (log22−ΔΔCt) values. The copy number types were classified as gain (>0.5), loss (<−0.5), or normal (<|±0.5|) (Xu et al. Citation2014; Liu et al. Citation2016; Shi et al. Citation2016). The pairwise comparison and scatter plot of he yak breeds were performed using GraphPad Prism version 5.00 software, with the value obtained from the log2 ratio (log22−△△Ct). The pairwise comparisons of breeds were tested using Turkey’s multiple comparison tests.
The Pearson product–moment correlation determined using the R-2.15.0 software was used to evaluate the relationship between the log2 ratio of the mRNA expression levels and the copy number of the CHRM3 gene (Knezevic et al. Citation2007). According to Stranger et al. (Citation2007), the correlation generated using log2 ratio signals exhibits high r2 and p values. Therefore, the correlation study was performed directly on data obtained from the log2 ratio, as described previously (Liu et al. Citation2016, p. 0.
Results
Association of CNV of the CHRM3 gene with Datong yak growth traits
In this work, we carried out the association between CNVs of the CHRM3 gene and growth traits of the Datong yak breeds by one-way ANOVA using SPSS software (). These results showed that the gain copy number type of the CHRM3 gene is significantly associated (p < 0.05) with higher body weight, length, height and chest girth than the loss and normal copy number types in six-month-old yaks. However, loss and normal copy number types of CHRM3 gene are non-significantly associated with body weight, length, height and chest girth in six-month-old yaks. In addition, the gain and normal copy number type of the CHRM3 gene is highly associated (p < 0.05) with body weight, length, and chest girth than loss copy number type in five-year-old yaks. While loss copy number type is non-significantly associated with body weight, length, and chest girth in five-year-old yaks. The results elucidated that CNVs of the CHRM3 gene was affected the growth traits of the Datong yak breed. However, three-year-old yaks showed a non-significant difference among the three copy number types for growth traits.
Table 2. An association analysis of the copy number variations of the CHRM3 gene with growth traits in the Datong yak breed.
Distribution of CNV of the CHRM3 gene in five yak breeds
As shown in a, the three CNVs types of the CHRM3 gene showed uniform distributions in all yak breeds. The gain CNV type of the CHRM3 gene more frequently occurred in Polled, Datong, Tianzhu, Gannan, and plateau yak individuals. Across all the breeds, the overall frequencies of the CHRM3 copy number types (b) classified as loss (i.e. a copy number of 0 or 1), normal (i.e. a copy number of 2), and gain (i.e. a copy number of more than 2) were 9.3%, 32%, and 58.7%, respectively (Supplementary Table S1). Among these, 70% of Tianzhu, 66.7% of Gannan, 50% of Datong, 46.7% of Polled, and 60% of plateau yak breeds showed only gain copy number types, whereas 46.7% of the Datong and 36.7% of plateau yak showed only normal copy number types, respectively. Additionally, 33.3% of Polled yaks exhibited loss copy numbers of the CHRM3 gene (Supplementary Table S1). Indeed, there is a difference of low significance found in the pairwise comparison of Polled versus Tianzhu and Gannan yaks (p < 0.05), while there was no significant difference between the other pairwise comparisons (Supplementary Table 2).
Figure 1. Distributions of the CNV of the CHRM3 gene in five yak breeds. (A) Box plot of CNV distributions of the CHRM3 gene in five yak breeds (n=30). (B) Relative frequency of copy numbers classified as the loss (0 and 1), normal (2), and gain (>2) types in five yak populations. Copy numbers were determined by rounding to the nearest integer.
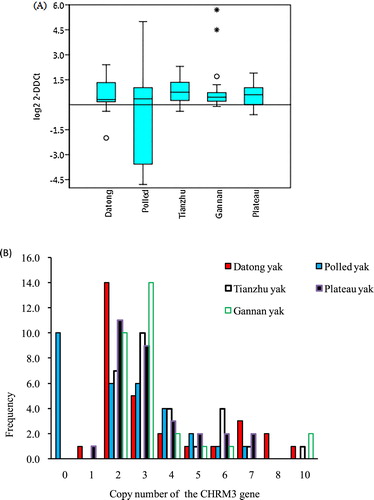
Expression pattern analysis of the CHRM3 gene among different tissues
The CHRM3 gene plays a prominent role in potassium channel mediation, smooth muscle contraction, embryo development, and glandular tissue stimulation. The mRNA expression of the CHRM3 gene was highly significant (p < 0.05) in the lung and brain relative to other tissues at the embryonic stage of yak (90 days). Moreover, weak mRNA expressions of the CHRM3 gene were reported in fetal heart and muscle tissues (A). However, the highest level of CHRM3 expression was also detected in the brain, followed by muscle, lung, and adipose tissues at the adult stage (B). These results cumulatively showed that the brain, lung, and muscle could be the central expression tissue of the CHRM3 gene in yak (C) and suggest a role of CHRM3 in the development of the brain, lung, and muscle tissues.
Figure 2. Expression profiles of the CHRM3 gene in Datong yak at two ages. (A) Expression pattern of the CHRM3 gene in fetal yak. (B) Expression pattern of the CHRM3 gene in adult yak. (C) Comparison of CHRM3 gene expression between the two ages. The error bars indicate the standard deviations (SDs). Different letters indicate significant differences (P<0.05).

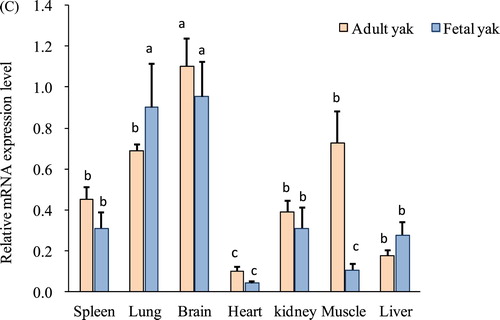
Figure 3. Analysis of the correlation between the log2 ratio of gene expression and the CNVs of the CHRM3 gene in the skeletal muscle of adult yaks. (a) Relative CNV of the CHRM3 gene (n = 82, M1–M82). (b) mRNA CHRM3 gene expression level (n = 82, M1–M82). (c) Correlation between DNA copy number and mRNA CHRM3 gene expression level. (d) The impacts of DNA CNVs on CHRM3 mRNA gene expression level (≥1: n = 12; 2: n = 24; 3: n = 46) were evaluated between different CNV types. The error bars show the standard deviations (SDs). Different letters indicate a significant difference (p < 0.05).
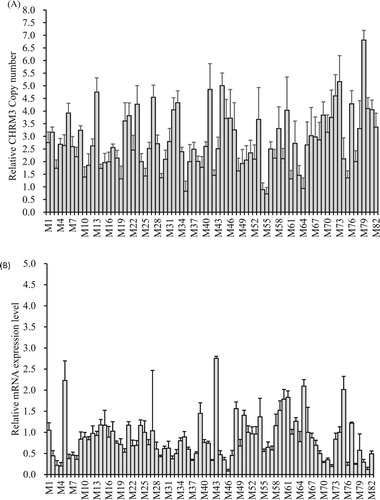
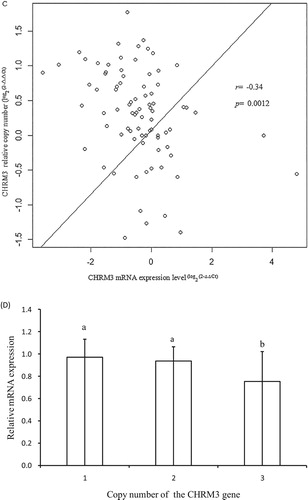
Correlation analysis of CNV and the mRNA expressions of the CHRM3 gene
The result revealed that the copy number variation could affect the level of CHRM3 transcription (). Of the 82 skeletal muscles, the copy types were comprised of 24 normal types, 44 gain types, and 12 loss types. These results indicated that the relative copy numbers and relative mRNA expression level of the CHRM3 gene varied from one to seven copies (A) and were 0.12-fold to 2.75-fold (B), respectively. Meanwhile, a moderately negative correlation (r = −0.34) was reported between DNA copy number and mRNA expressions of the CHRM3 gene, and this association was highly significant (p = 0.0012) (C). These results underscored that the gain copy numbers of the CHRM3 gene were predominant for growth traits and were not correspondent with the negative association between DNA copy number and the transcriptional level of the CHRM3 gene (C, D). On the other hand, in D, when comparing copy number types and gene expression, copy number gains were associated with lower mRNA expression levels compared to normal and loss copy number states (p < 0.05).
Discussion
Multiple interactions among environmental and genetic factors are affecting the growth traits animals, which is a continuous process that typically begins in fetal stages. In domestic animals such as yak, most CNV studies have been limited to CNV discovery and enumeration using the platforms of aCGH and NGS (Zhang et al. Citation2014; Zhang et al. Citation2016). However, there have been no efforts made to associate DNA copy number with growth traits and mRNA expression, rather than a detection of CNVRs in domestic and wild yak breeds. These results underpinned that phenotypical differences in domestic yak breeds were results of the presence of CNVRs of the CHRM3 gene. The gain copy number type of the CHRM3 gene is higher body weight, chest girth, body length, and height in six-month and five-year-old Datong yaks. Similar results have been reported, the copy number gain type the KLF3 gene was found to be associated with heart girth and body mass of in Chinese cattle (Xu et al. Citation2018). Compared to these results, the copy number gain and median types of the GBP2 gene were shown to be associated with better body length and body weight in yak than cattle (Zhang et al. Citation2018). Furthermore, previous studies showed that CNVRs contribute to phenotypic variation by mechanisms of changing gene structure, alternating gene regulation, and exposing recessive alleles (Liu et al. Citation2014). In accordance with these results, a biological function of CNV of the PLA2G2D gene is associated with milk production and meat quality (Stothard et al. Citation2011). In earlier studies, CNVs of the myosin heavy chain 3 (MYH3) (Xu et al. Citation2014), MICAL-like 2 (MICAL-L2) (Xu et al. Citation2013), mitogen-activated protein kinase 10 (MAPK10) (Liu et al. Citation2016), guanylate-binding protein 2 (GBP2) (Zhang et al. Citation2018), and cytochrome P450 family 4 subfamily A member 11 (CYP4A11) (Yang et al. Citation2017) genes affected the cattle growth traits through gene dosage. Correspondingly, Xu et al. (Citation2018) reported that a CNV of the KLF3 gene is associated with growth traits.
Quantitative real-time PCR (qPCR) detection methods were significantly effective for identifying gene expression and CNVs (Xu et al. Citation2014; Liu et al. Citation2016; Zhang et al. Citation2018). These results indicated that the copy number types were similarly distributed in Polled, Datong, Tianzhu, Gannan, and plateau yak individual populations. The gain type was more common than the normal or loss types. These results highlighted that the genetic similarity among the breeds may support the hypothesis of artificial selection and breeding efforts (Lehnert et al. Citation2007). Contrary to these reports, Lehnert et al. (Citation2007) and Yang et al. (Citation2017) elucidated that the diversity in the genetic backgrounds of the breeds may cause differences in CNV frequency. Comparable to these results, the gain copy type of the GBP2 gene is in higher frequency in yak compared to Chinese cattle breeds (Zhang et al. Citation2018).
These results found that significantly high mRNA expression levels of the CHRM3 gene were detected in brain tissues. This agrees with the results of Weston-Green et al. (Citation2012) who reported that muscarinic M3 receptors are expressed in regions of the brain that regulate insulin homeostasis. Indeed, the mRNA expression levels of the CHRM3 gene having a widespread distribution in various tissues of yak may be evidence of multiple peripheral effects of the muscarinic receptor. The highly significant expression of the CHRM3 gene in the brain of yak revealed the contribution of CHRM3 for growth traits (Gautam et al. Citation2009). Collectively, these findings support the prominent role of the CHRM3 gene for the investigation of animal phenotypes.
These results showed a moderately negative and highly significant (p < 0.0012) association between DNA copy number and the transcriptional level of the CHRM3 gene (C). On the other hand, Zhang et al. (Citation2018) reported that the GBP2 gene copy number presented no correlation with transcriptional expression. Conversely, the positive correlation of DNA copy number and mRNA expression levels were an indication of genes entirely encompassed by CNVRs (Wong et al. Citation2007). For example, the duplication of the copy number of CYP4A11 gene (Yang et al. Citation2017) is positively associated with mRNA expression, which might affect phenotype traits by altering gene dosage (Yang et al. Citation2017). On the other hand, the CNV of the MAPK10 and GBP2 genes affects the growth traits of cattle through altering the gene dosage effects (Liu et al. Citation2016; Zhang et al. Citation2018). The present results show that the copy number of the CHRM3 gene was decreased with the gene expression level, which might be explained by the fact that CHRM3 affects yak phenotypes by the superimposed influence of trans-acting factors (Bickhart and Liu Citation2014). Correspondingly, Merla et al. (Citation2006) shown that the altered dosage of genes mapped within CNVRs may be due to the impact of CNVs in neighboring genes. Consistently, Liu et al. (Citation2016) suggested that the CNVRs affect gene expression directly by gene dosage or indirectly by gene-gene interactions or gene-environment interactions. Indeed, Hulse and Cai (Citation2013) revealed that cis-acting QTL located in CNV regions is responsible for the positive and negative correlations between DNA copy number and gene expression (Liu et al. Citation2014). Therefore, the CNVs of the CHRM3 gene which influence the growth traits of yak may do this through trans-acting and dosage-sensitive factors (Bickhart and Liu Citation2014; Liu et al. Citation2016).
Conclusions
The results demonstrated that there are significant differences among three copy number types for the growth traits of yak, which are the gain copy numbers of the CHRM3 gene associated with high growth traits in six-month and five-year-old yaks. The three CNV types of the CHRM3 gene showed uniform distributions across the yak populations. These observations underscored that the DNA copy number and mRNA transcription levels of the CHRM3 gene were moderately negative and highly significantly correlated and were highly expressed in brain, lung, and muscle tissues. They may be responsible for the development of these tissues. Therefore, this study provided inclusive information on the application of CNVs of the CHRM3 in gene expression, growth traits and its possible function in yak species.
TAAR_1753750_Supplementary_materials
Download MS Word (64 KB)Acknowledgments
We thank Mr. Yong Feng Zhang for guidance and technical assistance during laboratory work and Dr. Hong bo Wang, Ms. Li Xiaoxiao, and Mr. Peng Tang for performing the blood sample collection.
Disclosure statement
No potential conflict of interest was reported by the author(s).
ORCID
Habtamu Abera Goshu http://orcid.org/0000-0003-2693-0540
Additional information
Funding
References
- Bae JS, Cheong HS, Kim LH, NamGung S, et al. 2010. Identification of copy number variations and common deletion polymorphisms in cattle. BMC Genomics. 11:232. doi: 10.1186/1471-2164-11-232
- Beckmann JS, Estivill X, Antonarakis SE. 2007. Copy number variants and genetic traits: closer to the resolution of phenotypic to genotypic variability. Nat Rev Genet. 8:639–646. doi: 10.1038/nrg2149
- Bickhart DM, Hou Y, Schroeder SG, Alkan C, et al. 2012. Copy number variation of individual cattle genomes using next-generation sequencing. Genome Res. 22:778–790. doi: 10.1101/gr.133967.111
- Bickhart DM, Liu GE. 2014. The challenges and importance of structural variation detection in livestock. Front Genet. 5:37. doi: 10.3389/fgene.2014.00037
- Butte AJ, Dzau VJ, Glueck SB. 2001. Further defining housekeeping, or “maintenance,” genes Focus on “A compendium of gene expression in normal human tissues”. Physiol Genomics. 7:95–96. doi: 10.1152/physiolgenomics.2001.7.2.95
- Conrad DF, Pinto D, Redon R, Feuk L, et al. 2010. Origins and functional impact of copy number variation in the human genome. Nature. 464:704–712. doi: 10.1038/nature08516
- Da Silva VH, Regitano LdA, Geistlinger L, Pértille F, Giachetto PF, et al. 2016. Genome-wide detection of CNVs and their association with meat tenderness in Nelore cattle. PLoS ONE. 11(6):e0157711. doi: 10.1371/journal.pone.0157711
- Dekkers JCM. 2004. Commercial application of marker- and gene-assisted selection in livestock: Strategies and lessons. Anim Sci. 82:313–328.
- Feuk L, Carson AR, Scherer SW. 2006. Structural variation in the human genome. Nat Rev Genet. 7:85–97. doi:10.1038/nrg1767.
- Gautam D, Jeon J, Starost MF, Han S-J, Hamdan FF, Cui Y, et al. 2009. Neuronal M3 muscarinic acetylcholine receptors are essential for somatotroph proliferation and normal somatic growth. Proc Natl Acad Sci USA. 106:6398–6403. doi: 10.1073/pnas.0900977106
- Gilbert RP, Bailey DRC, Shannon NH. 1993. Linear body measurements of cattle before and after 20 years of selection for postweaning gain when fed two different diets. Anim Sci. 71:1712–1720. doi: 10.2527/1993.7171712x
- Hulse AM, Cai JJ. 2013. Genetic variants contribute to gene expression variability in humans. Genet. 193:95–108. doi: 10.1534/genetics.112.146779
- Knezevic SZ, Streibig JC, Ritz C. 2007. Utilizing R software package for dose-response studies: the concept and data analysis. Weed Technol. 21:840–848. doi: 10.1614/WT-06-161.1
- Lee YS, Lee JH, Lee JY, Kim JJ, et al. 2008. Identification of candidate SNP (single nucleotide polymorphism) for growth and carcass traits Related to QTL on Chromosome 6 in Hanwoo (Korean cattle). Asian-Aust. J Anim Sci. 21:1703–1709.
- Lehnert SA, Reverter A, Byrne KA, Wang Y, et al. 2007. Gene expression studies of developing bovine longissimus muscle from two different beef cattle breeds. BMC Dev Biol. 7:95. doi: 10.1186/1471-213X-7-95
- Liu M, Lia B, Huanga Y, Yang M, Lana X, et al. 2016. Copy number variation of bovine MAPK10 modulates the transcriptional activity and affects growth traits. Liv Sci. 194:44–50. doi: 10.1016/j.livsci.2016.09.014
- Liu GE, Xu L, Huang K. 2014. Recent Advances in studying of copy number variation and gene expression. Gene Exp Genet Genomics. 7:1–5. doi: 10.4137/GGG.S14286
- Lupski JR, Stankiewicz P. 2005. Genomic disorders: Molecular mechanisms for rearrangements and conveyed phenotypes. PLoS Genet. 6:e49. doi: 10.1371/journal.pgen.0010049
- Merla G, Howald C, Henrichsen CN, Lyle R, et al. 2006. Submicroscopic deletion in patients with Williams-Beuren syndrome influences expression levels of the nonhemizygous flanking genes. A J Hum Genet. 79:332–341. doi: 10.1086/506371
- Redon R, Ishikawa S, Fitch KR, Feuk L, Perry GH, et al. 2006. Global variation in copy number in the human genome. Nature. 444:444–454. doi: 10.1038/nature05329
- Schmittgen TD, Livak KJ. 2008. Analyzing real-time PCR data by the comparative CT method. Nat Protoc. 3:1101–1111. doi: 10.1038/nprot.2008.73
- Shi T, Yao X, Mingjuan Y, Yongzhen H, Xianyong L, Chuzhao L, et al. 2016. Copy number variations at LEPR gene locus associated with gene expression and phenotypic traits in Chinese cattle. Anim Sci. 87:336–343. doi: 10.1111/asj.12531
- Stothard P, Choi J-W, Basu U, Sumner-Thomson JM, Meng Y, et al. 2011. Whole-genome resequencing of black Angus and Holstein cattle for SNP and CNV discovery. BMC Genomics. 12:559. doi: 10.1186/1471-2164-12-559
- Stranger BE, Forrest MS, Dunning M, Ingle CE, et al. 2007. Relative impact of nucleotide and copy number variation on gene expression phenotypes. Sci. 315:848–853. doi: 10.1126/science.1136678
- Weston-Green K, Huang XF, Lian J, Deng C. 2012. Effects of olanzapine on muscarinic M3 receptor binding density in the brain relates to weight gain, plasma insulin, and metabolic hormone levels. Eur Neuropsychopharmacol. 22:364–373. doi: 10.1016/j.euroneuro.2011.09.003
- Wong KK, de Leeuw RJ, Dosanjh NS, Kimm LR, et al. 2007. A comprehensive analysis of common copy-number variations in the human genome. A J Hum Genet. 80:91–104. doi: 10.1086/510560
- Xu Y, Shi T, Cai H, Zhou Y, Lan X, Zhang C, et al. 2014. Associations of MYH3 gene copy number variations with transcriptional expression and growth traits in Chinese cattle. Gene. 535:106–111. doi: 10.1016/j.gene.2013.11.057
- Xu Y, Zhang LZ, Shi T, Zhou Y, Cai HF, et al. 2013. Copy number variations of MICAL-L2 shaping gene expression contribute to different phenotypes of cattle. Mamm Genome. 24:508–516. doi: 10.1007/s00335-013-9483-x
- Xu JW, Zheng L, Li L-J, Yao Y-F, Hua H, et al. 2018. Novel copy number variation of the KLF3 gene is associated with growth traits in beef cattle. Gene. 680:99–104. https://doi.org/10.1016/j.gene.2018.08.040.
- Yang M, Jingqiao LV, Liangzhi Z, Mingxun L, et al. 2017. Association study and expression analysis of CYP4A11 gene copy number variation in Chinese cattle. Sci Rep. 7:46599. doi: 10.1038/srep46599
- Yim SH, Chung YJ, Jin EH, Shim SC, Kim JY, Kim YS, et al. 2011. The potential role of VPREB1 gene copy number variation in susceptibility to rheumatoid arthritis. Mol Immunol. 48:1338–1343. doi: 10.1016/j.molimm.2010.11.009
- Yoo CK, Park HB, Lee JB, Jung EJ, et al. 2014. QTL analysis of body weight and carcass body length traits in an F2 intercross between Landrace and Korean native pigs. Anim Gene. 45(t):589–592. doi: 10.1111/age.12166
- Zhang F, Gu W, Hurles ME, Lupski JR. 2009. Copy number variation in human health, disease, and evolution. Annu Rev Genomics Hum Genet. 10:451–481. doi: 10.1146/annurev.genom.9.081307.164217
- Zhang L, Jia S, YangM XY, Li C, Sun J, et al. 2014. Detection of copy number variations and their effects in Chinese bulls. BMC Genomics. 15:480. doi: 10.1186/1471-2164-15-480
- Zhang X, Wang K, Wang L, Yang Y, Ni Z, et al. 2016. Genome-wide patterns of copy number variation in the Chinese yak genome. BMC Genomics. 17:379. doi: 10.1186/s12864-016-2702-6
- Zhang GM, Zheng L, He H, Song CC, et al. 2018. Associations of GBP2 gene copy number variations with growth traits and transcriptional expression in Chinese cattle. Gene. 647:101–106. doi: 10.1016/j.gene.2018.01.004
- Zhou Y, Utsunomiya T, Xu L, El Hamidi Abdel H, et al. 2016. Genome-wide CNV analysis reveals variants associated with growth traits in Bos indicus. BMC Genomics. 17:1–9. doi: 10.1186/s12864-015-2294-6