
 ?Mathematical formulae have been encoded as MathML and are displayed in this HTML version using MathJax in order to improve their display. Uncheck the box to turn MathJax off. This feature requires Javascript. Click on a formula to zoom.
ABSTRACT
This study assessed the physical characteristics, faecal, ammonia and phosphorus waste production rates of mixtures of groundnut, cottonseed, copra and soybean meals as a replacement for fishmeal in Nile tilapia diets. Six experimental diets were formulated such that the oilseed mixtures contributed 80% of total dietary protein. A fishmeal-based diet served as the control. The diets were randomly assigned in triplicates to the experimental tanks, containing 15 juvenile tilapia with a bulk weight of ∼1 kg. Ammonia and phosphorus excretion rates of the diets were monitored at 3-hour intervals over 24 h. The pellet characteristics, faecal and nutrient waste production were assessed. The control diet recorded a mean bulk density of 376.00 ± 5.19 g L−1 which was lower than the oilseed-based diets which ranged from 550.67 ± 3.06 g L−1 to 614.27 ± 2.08 g L−1. There was a positive correlation (p < 0.0001; r = 0.93) between the sinking rates of pellets and their bulk densities. The oilseed-based diets recorded 4–45% higher faecal matter production compared to the control diet. Fish fed Diet 3 had the lowest Total Ammonia-nitrogen (TAN) excretion rate of 106.14 ± 1.95 mg kg−1 while the control diet recorded the highest TAN excretion of 162.31 ± 4.39 mg kg−1. Accumulated dissolved phosphorus was 64.52–74.09% lower in the oilseed-based diets compared to the control.
1. Introduction
Global aquaculture production has increased markedly over the last few decades. In 2016, total aquaculture production was 80.0 million tonnes from 61.8 million tonnes in 2011 (FAO Citation2018). The increasing trend in world aquaculture production has also led to a corresponding increase in the use of formulated diets in fish production (Cho Citation1993). Similarly, aquaculture production in Ghana increased from 10,200 tonnes in 2010 to 52,250 tonnes in 2017 (MoFAD Citation2017). This growth could largely be attributed to the emergence of large-scale cage aquaculture in the early 2000s on Lake Volta. The intensification of commercial cage aquaculture over the last decade has been the catalyst for the increase in formulated aquafeeds (Obirikorang et al. Citation2015c).
Despite the many benefits derived from extruded aquafeeds, the high cost of these feeds has been identified as an important issue that inhibits the development of commercial aquaculture in sub-Saharan Africa (Hecht Citation2007). The high cost of formulated feeds is attributed to the inclusion of fishmeal which is in limited supply. However, a large number of plant products have been evaluated as potential protein sources in diets for fish culture. These include cottonseed, groundnut and soybean meals (Agbo Citation2008; Obirikorang et al. Citation2015a), pito mash, rice bran and groundnut bran (Abarike et al. Citation2012), palm kernel and copra meal (Obirikorang et al. Citation2015a).
The inclusions of plant-based ingredients can, however, alter the physical characteristics of feeds even though the calculated nutritional/chemical requirements of the target species are met (Thomas et al. Citation2001). Fish feeds must have physical characteristics that ensure that the macro as well as micronutrients are available to the cultured species (Halver and Hardy Citation2002). Important physical characteristics of pelleted feeds include water stability, nutrient leaching rate and bulk density. According to Aarseth et al. (Citation2006), feeds used in aquaculture should have characteristics such as high resistance to mechanical stress during transport and handling, and maintain their physical integrity in water with very minimal fragmentation until consumed by the target species. Pelleted diets should also have textures and sizes that can promote feed intake and efficient digestion by the cultured fish (Baeverfjord et al. Citation2006). Pelleted feeds with high sinking rates, poor water stability and a high tendency to leach out nutrients (proteins, lipids and phosphorus) will thus, increase the nutrient load and organic matter of the culture water (Epa et al. Citation2007). Apart from the adverse effect on water quality, feeds with poor structural integrity can cause economic losses to the fish farmer as a result of reduction in feed efficiency resulting from poor digestibility.
Owing to the above, alternative protein sources should not only provide the right nutrient profile but must also be amenable to the formation of pellets with good physical properties (Kim et al. Citation2006; Knudsen et al. Citation2006; Overland et al. Citation2007). Although the aquaculture industry presently aims at improving the efficiency of feeds, reduction in the level of waste excretions into the culture environment is also very important because the accumulation of excess or non-digestible nutrients from feeds increase primary productivity which triggers other water quality problems like high biological oxygen demand that strips the culture system of its oxygen (Fournier et al. Citation2003; Crab et al. Citation2007). Inability to control this phenomenon results in poor fish growth which ultimately affects yield.
In intensive aquaculture, ammonia is the principal nitrogenous waste (Yusoff et al. Citation2010), high concentrations of total ammonia-nitrogen (TAN) coupled with an increase in water temperature and pH increases its toxicity, making fish susceptible to gill damage and other lethal conditions (Jones et al. Citation2001). Jauncey (Citation1998) showed that although most oilseeds may contain fairly high crude protein levels, they may have an unbalanced essential amino acids (EAA) profile with threonine, methionine and lysine being the most limiting. However, combining different plant protein sources in a single feed or supplementation with other enzymes has been reported to mitigate this problem (Yigit et al. Citation2007; Miles and Chapman Citation2011). This study was therefore conducted to investigate the effects of substituting fishmeal with different oilseed meal mixtures (soybean, groundnut, cottonseed and copra meals) on the physical characteristics of the feed, faecal matter production and postprandial ammonia and phosphorus excretion rates in Nile tilapia (Oreochromis niloticus).
2. Materials and methods
2.1. Experimental facility
This study was conducted in a modified recirculating system consisting of 12 150 L cylindro – conical thermoplastic tanks and a reservoir tank inside a 10.7 m shipping container at the experimental station of the Department of Fisheries and Watershed Management, Kwame Nkrumah University of Science and Technology, Kumasi, Ghana. Water supply to each tank was kept at a flow rate of 2.5 L min−1 by means of controlled taps connected to each tank. The reservoir tank was also fitted with biofilters to breakdown ammonia and an air pump (SIBO BV V-30, Netherlands) to provide aeration. Dissolved oxygen concentration in each of the tanks was kept above 6 mg L−1 at all times by aerating with air stones connected to an external air pump (HIBLOW HP-40, Japan). A 12-hour illumination and 12-hour darkness were achieved by means of a preset 7W led lamp overhanging each tank. Each experimental tank was also fitted with a transparent sedimentation column at the bottom for faecal matter collection.
2.2. Experimental diets
Seven experimental diets were formulated, with the control diet having fishmeal as the main protein source. The six test diets contained different inclusion levels of oilseed meal mixtures (groundnut, cottonseed, copra and soybean meals) collectively contributing approximately 80% of total dietary protein. All diets were isonitrogenous (∼30% protein) and isolipidic (∼12%) ().
Table 1. Weight of formulated diets (g kg−1) and proximate composition (% dry weight basis) of fishmeal Control and plant-based test diets.
2.2.1. Proximate composition and phosphorus concentrations
Dry matter, crude protein, lipid and ash levels in the diets were determined following standard procedures described by the Association of Official Analytical Chemists (AOAC, Citation2005). The Kjeldahl method of digestion, distillation and titration was used in the determination of dietary protein using an automated protein analyser (Foss KjeltecTM 8200). The Soxhlet extraction method was employed in the extraction of lipid with petroleum aether. Dietary phosphorus was determined following the ammonium-molybdate method by Stirling (Citation1985). Dry matter was calculated as the weight after oven drying a known weight of the feed samples for 24 h at 105°C. Feed samples contained in pre-weighed crucibles were incinerated for 6 h at 550°C in a muffle furnace, cooled in a desiccator and weighed. Ash content was then calculated from the weight loss after incineration.
2.2.2. Feed bulk densities and pellets sinking velocity
The method described by Aarseth et al. (Citation2006) was employed in the determination of feed bulk densities. For each diet, feed samples were poured through a funnel into a tared 1 L measuring cylinder up to the 1 L mark and the content weighed on an electronic balance (OHAUSR NAVIGATOR XL NVL2101/1). The procedure was repeated three times for all experimental diets. Sinking velocities of the different diets were measured in a 50 cm long measuring cylinder. The cylinder was filled with water of drinking quality with a temperature of 25°C. For each diet, 30 feed pellets of, approximately 0.5 cm long each, were randomly selected and then dropped from a height of 6 cm above the water surface to traverse the 50 cm of the cylinder column. Time was measured using a digital stop-watch. The timing was started from a line marked at 5 cm depth from the water surface where the feed pellets would have reached a terminal or constant velocity. Any pellet that came into contact with the wall of the cylinder during the descent was excluded. The sinking rates of the various feed types were calculated as the distance covered per the time taken. The sinking velocities were recorded in cms−1.
2.2.3. Pellet water stability and nutrient leaching rates
The horizontal shaking method described by Obaldo et al. (Citation2002) and Baeverfjord et al. (Citation2006) was used in the determination of water stability of feed pellets as well as their nutrient leaching rates. One gram of each experimental feed sample was weighed on an analytical balance into pre-weighed 3.5 × 2 × 0.5 cm histology cassettes with 1 × 1 mm openings. This ensured that the movement of pellets within the cassettes was not hindered by the casing covers. Five replicates per diet were run for each trial covering 5, 10, 20 and 30 min. The replicates for each diet were collectively placed in separate 1000 ml beakers filled with 300 ml tap water and placed on a shaker (STUART SCIENTIFIC SO1-6412) set at 60 cycles per minute for each of the time periods. The cassettes were recovered and allowed to drain off excess water for 10 min on tissue paper. All the cassettes along with their residual contents were oven-dried at 80°C for 48 h to a constant weight. The dry samples were cooled in a desiccator and re-weighed to determine the residual dry matter. The water stability of the pellets of the different dietary groups was calculated as a ratio of the dry matter recovered after each trial run to the dry matter of the original samples and expressed as a percentage. This was followed with protein, lipid and phosphorus analyses of the recovered dry samples of each of the diets for each time period to determine nutrient contents relative to retained dry matter over the different time periods as in Ighwela et al. (Citation2013):
2.3. Experimental fish
All-male Nile tilapia were obtained from the Aquaculture Research and Development Centre (ARDEC) at Akosombo, Ghana. Each tank was stocked with 15 fish with mean body weight of 36.4 ± 0.72 g, and fish acclimatized to the system over a 10-day period during which they were fed twice daily at 10:00 and 15:00 h with the experimental diets corresponding to 4% of the total fish body mass divided into two equal portions.
2.3.1. Faeces production
The faeces sedimentation column of each tank was suspended in a styrofoam box containing ice flakes to reduce microbial degradation of the faecal matter. To demonstrate the effects of the test ingredients on feed intake, fish in the different treatment groups were given the opportunity to refuse feed by feeding them just beyond apparent satiety as stipulated by Glencross et al. (Citation2007) for 10 consecutive days. Feed intake was expressed cumulatively over the trial period and all uneaten feed also accounted for. Faecal samples were concurrently collected daily prior to feeding over a period of 10 days and stored at −20°C until analysis. Collected faecal matter was analysed for dry matter and expressed as gDM kg−1 of ingested feed.
2.3.2. Total Ammonia-nitrogen and phosphorus excretion rates
Based on the results of the physical characteristics for the six formulated diets, this aspect of the study was conducted for the best three diets (Diets 1–3) after one week of feeding. Feed was withheld for 24 h prior to water sampling to ensure that all faeces was completely removed from the guts of the fish. The experimental tanks were thoroughly cleaned with a magnetic aquarium cleaner to take out all faecal and organic material. Water flow to the culture tanks was stopped throughout the 24-hour sampling period to ensure no water exchange. The experimental diets were then administered at a rate of 2% of total fish weight in a single meal. Water samples for postprandial TAN and phosphorus analysis were taken at 3-hour intervals for 24 h with an initial sampling carried out 3 h prior to administering the dietary treatments. Approximately 20 ml of water from each tank were collected and immediately analysed for TAN and phosphorus concentrations in duplicates. TAN and phosphorus excretion rates for each treatment were calculated using the ammonia and dissolved phosphorus recorded from each experimental tank after each sampling period using the formula for a static system described by Frisk et al. (Citation2013):
where N1: initial concentration of TAN/P in water (mg L−1); N2: final concentrations of TAN/P in water (mg L−1); V: volume of water (l) in the tank during the sampling periods; T: the time (h) between the sampling periods; M: bulk mass of fish (kg).
The analysis of TAN in water samples collected from each experimental tank was carried out using a Wagtech 7100 photometer. The indophenol and vanamolybdate methods were employed in the analysis of TAN and dissolved P respectively.
2.4. Statistical analysis
Data were first subjected to a normality test using the Shapiro–Wilk test prior to testing for significant differences. All statistical analyses were executed and graphs plotted using SigmaPlot version 12.0 for Windows (Systat Software, Inc). Data on bulk densities, sinking velocity and nutrient leaching rates of the pelleted diets were subjected to one-way ANOVA and differences between the dietary treatment means compared by the Tukey multiple comparison test. Pearson’s correlation was used to test for the association between pellet bulk densities and sinking rates and between pellet water stabilities and nutrient leaching rates. In all cases, differences were considered significant at p < 0.05. Results are presented as means ± standard deviations (SD).
3. Results
3.1. Feed bulk densities and pellet sinking rates
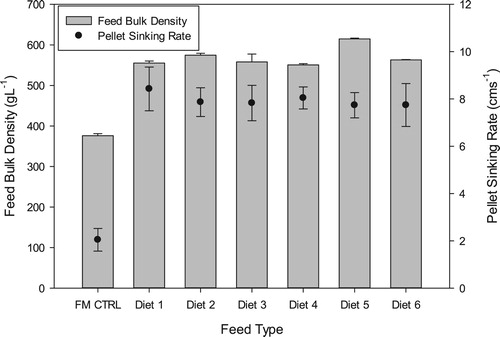
The bulk density of the fishmeal-based control diet was significantly lower (p < 0.0001) than that of the plant-based diets (). The control diet had a mean bulk density of 376.0 ± 5.19 g L−1. The inclusion of the oilseed meals resulted in higher feed bulk densities which ranged from 550.67 ± 3.06 g L−1 for Diet 4 to 614.27 ± 2.08 g L−1 for Diet 5; representing 46.5–63.4% increase in bulk density relative to the control diet. There was a strong positive correlation (p < 0.0001; r = 0.93) between sinking rates of pellets and their bulk densities. Feed pellets from the control diet had the lowest sinking rate of 2.03 ± 0.47 cms−1 which varied significantly (p < 0.05) from the pellet sinking rates of the oilseed meal diets. The addition of the oilseed meal matrices resulted in significantly higher (p < 0.05) pellet sinking rates which ranged from 7.73 ± 0.53to 8.43 ± 0.92 cms−1. There were no significant differences (p > 0.05) between the mean sinking rates of the plant-based diets.
Figure 1. Pellet sinking rates and feed bulk densities (mean ± SD) of the different experimental diets. FM CTRL = fishmeal control.
3.2. Faecal matter production
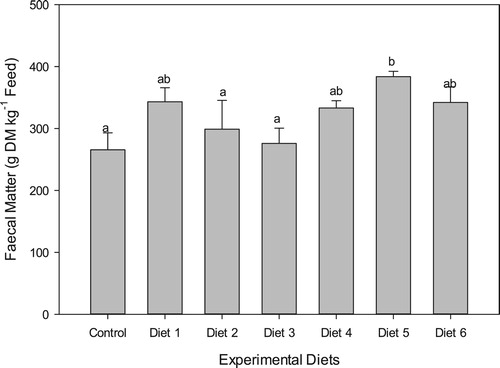
Faecal matter production (gDM kg−1 of ingested feed) was highest in the fish fed Diet 5 (383.83 ± 8.49 gDM kg−1) and lowest in fish fed the control diet (265.78 ± 27.23 gDM kg−1) (). Faecal matter production in fish fed the other oilseed meal-based diets were significantly higher (p < 0.0001) than the control diet and ranged from 276.0 ± 24.70 for Diet 3 to 343.17 ± 22.78 gDM kg−1 ingested feed for Diet 1. Overall, the dietary inclusions of the oilseed meals resulted in higher faecal matter loads of between 4 and 45% relative to the fishmeal control diet.
Figure 2. Faecal matter production (mean ± SD) of Nile tilapia fed the different experimental diets.
3.3. Water stability and nutrient leaching rates
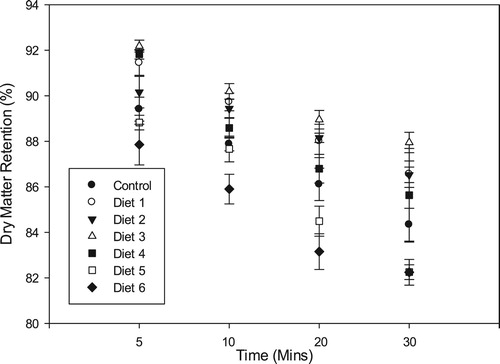
Significant differences (p < 0.0001) were observed for all the diets in terms of dry matter retention and water stability. Dry matter loss over time for all the diets assumed a linear trend. Pellet water stability was higher in plant-based diets compared to the fishmeal diet. Diet 3 had the best pellet structural integrity with dry matter retention of 92.19 ± 0.26% compared to 89.41 ± 0.52% for the control diet after 5 min (). After 30 min, 87.95 ± 0.44% of dry matter was recovered for Diet 3 which was significantly higher (p < 0.05) than the control (84.33 ± 0.72%). Diets 5 and 6 had the lowest dry matter retention after 30 min with recoveries of 82.24 ± 0.32% and 82.25 ± 0.56%, respectively. Dry matter retention for the other oilseed meal-based diets after 30 min was fairly similar and ranged from 85.63 ± 2.06% (diet 4) to 86.53 ± 0.34% (diet 2).
Figure 3. Pellet dry matter retention (mean ± SD) of the different diets after 30 min immersion in water.
3.4. Crude protein retention
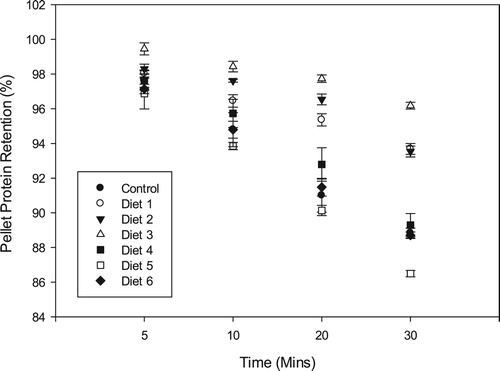
There was a strong positive correlation (p = 0.0042, r = 0.91) between pellet protein retentions of the different diets and their respective dry matter retentions. Protein retention after 30 min of immersion in water was highest for Diet 3 (96.18 ± 0.19%) which was significantly higher (p < 0.05) than that of the control diet (88.83 ± 0.28%) (). Similarly, Diets 1 and 2 had remarkable protein retentions of 93.69 ± 0.31% and 93.54 ± 0.32%, respectively, which were significantly higher (p < 0.05) than the control diet. The other oilseed meal diets recorded protein retentions ranging from 86.49 ± 0.18% (Diet 5) to 89.29 ± 0.66% (Diet 4).
Figure 4. Pellet protein retention (mean ± SD) of the different diets after 30 min immersion in water.
3.5. Lipid retention
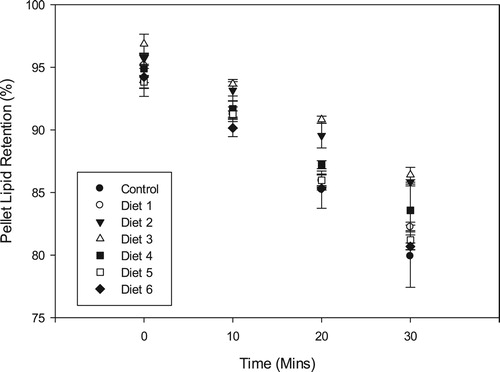
Similar to the trend observed for the protein and dry matter retentions, lipid loss was in a near-linear fashion for all the experimental diets (). Lipid loss was positively correlated (p = 0.029, r = 0.80) to dry matter loss as was observed for pellet protein loss. Lipid retention after 30 min was observed to be best in Diet 3 (86.42 ± 0.59%) with the fishmeal-based control diet recording the highest lipid leakage and a final retention of 79.90 ± 2.48%. With the exception of Diet 6 (80.68 ± 0.28), all the oilseed-based diets had lipid retentions higher (p < 0.05) than that of the control diet after the 30-minute.
Figure 5. Pellet lipid retention (mean ± SD) of the different diets after 30 min immersion in water.
3.6. Dietary phosphorus retention
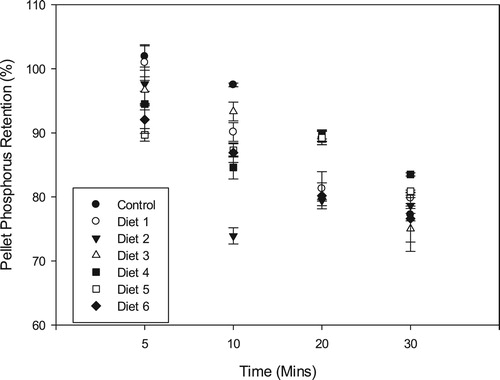
Although dietary phosphorus loss was in a near-linear fashion as was observed for protein and lipid retentions, there was no significant correlation between phosphorus and dry matter retentions over the different immersion times. Phosphorus retention for the control diet and Diet 1 after 5 min was above 100% which is an indication of a faster dry matter loss relative to phosphorus (). After 30 min, Diet 4 recorded the highest phosphorus retention of 83.51 ± 0.26% which was significantly higher (p < 0.05) than all the other experimental diets. Diet 3 recorded the lowest phosphorus retention of 75.05 ± 3.54% with the control diet recording a phosphorus retention rate of 77.22 ± 0.97% after 30 min.
Figure 6. Pellet phosphorus retention (mean± SD) of the experimental diets after 30 min immersion in water.
3.7. Postprandial total ammonia-nitrogen excretion rates
TAN excretion rates of fish fed the experimental diets were significantly different (p = 0.0075) at the end of the 24-hour period. Fish fed Diet 3 recorded the lowest daily TAN excretion rates of 106.14 ± 1.95 mg kg−1. The highest cumulative TAN excretion over the 24-hour period of 162.31 ± 4.39 mg kg−1 was recorded in fish fed Diet 2 (). The cumulative TAN excretion rates of fish fed Diets 1 and the control diet were 128.54 ± 1.46 mg kg−1 and 144.04 ± 6.82 mg kg−1 respectively.
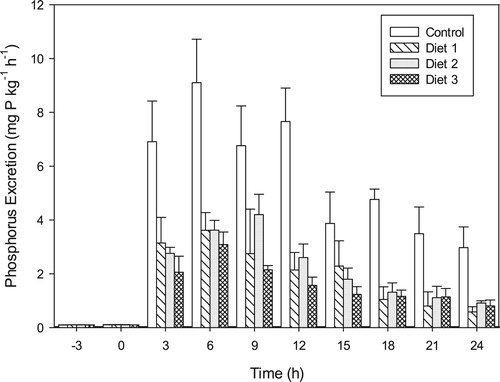
Figure 7. Postprandial total ammonia-nitrogen excretion rates (mean ± SD) in Oreochromis niloticus fed diets containing different plant protein matrices.
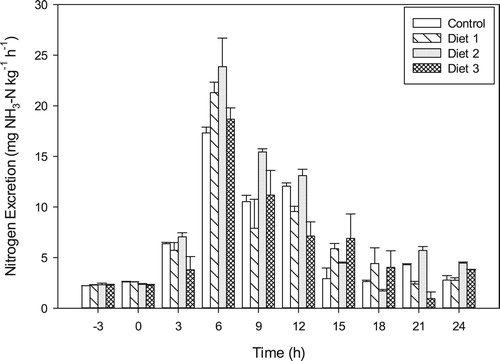
Despite the significant differences in TAN excretion rates, fairly similar excretion patterns were observed among all the dietary treatments with peak TAN excretion rates occurring 6 h after meal ingestion. Fish that received Diet 2 exhibited the highest mean peak excretion rate of 27.89 ± 2.82 mg kg−1 hr−1, while the control group showed the lowest peak TAN excretion rate of 17.32 ± 0.57 mg kg−1 hr−1 which was significantly lower (p < 0.00001) compared to fish fed Diets 2 and 3. However, the TAN excretion rate for the control group was similar to (p > 0.05) to fish fed Diet 1.
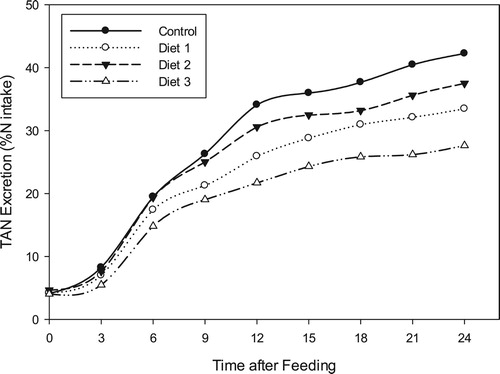
The ammonia-nitrogen excretion rates were again plotted as percentages of consumed dietary nitrogen (N) over a 24-hour post-feeding period (). Expressed as percentage of the N intake in the single administered meal, total ammonia excretion rates of the Diet 2, Control, Diet 1 and Diet 3 varied significantly (p = 0.0008) and were calculated to be 42.27, 37.51, 33.47 and 27.64%, respectively.
Figure 8. Cumulative total ammonia-nitrogen excretion rates by Oreochromis niloticus as a proportion of ingested dietary nitrogen.
3.8. Postprandial dissolved phosphorus excretion rates
Pre-feeding dissolved phosphorus levels were recorded in all the experimental tanks and varied between 0.09 and 0.11 mg L−1. Phosphorus levels recorded in all the treatment tanks 3 h post-feeding were significantly higher (p < 0.0001) than the pre-feeding levels. The fishmeal-based control diet elicited the highest postprandial phosphorus excretion rates among the dietary treatments. The addition of the oilseed meals resulted in significantly lower (p < 0.0001) phosphorus excretion rates in fish fed the plant-based diets (). At the end of the 24-hour sampling period, accumulated dissolved phosphorus in the closed systems were 127.15 ± 4.16 mg kg−1 for the control diet, 45.11 ± 7.78 mg kg−1 for Diet 1, 43.61 ± 2.08 mg kg−1 for Diet 2 and 32.94 ± 1.09 mg kg−1 for Diet 3. With the exception of Diet 2 that recorded peak phosphorus excretion 9 h post-feeding, all the dietary groups recorded peak phosphorus excretion rates 6 h post-feeding.
Figure 9. Postprandial dissolved phosphorus excretion rates (mean ± SD) in Oreochromis niloticus fed diets comprising an array of plant protein matrices.
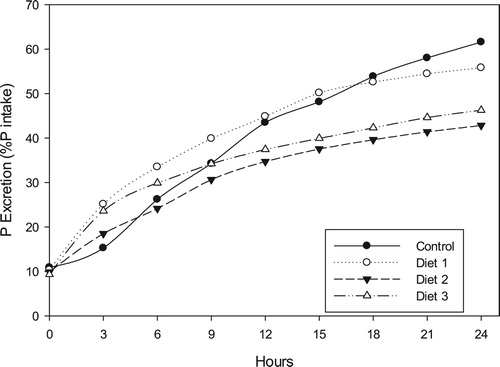
At the end of the 24-hour sampling period, the accumulated phosphorus levels in each closed system were plotted against the ingested phosphorus in their respective administered dietary treatment to estimate the proportion of ingested phosphorus that is excreted as dissolved phosphorus via fish urinary or brachial systems (). After 24 h, 61.6% of the ingested phosphorus in the control diet was excreted. Lower proportions were recorded for the oilseed meal diets with Diets 1, 2 and 3 recording 55.83, 42.84 and 46.26%, respectively.
Figure 10. Cumulative dissolved phosphorus excretion rates by Oreochromis niloticus as a proportion of ingested dietary phosphorus.
4. Discussion
4.1. Physical characteristics of feed pellets
The inclusion of oilseed meals usually results in diets with higher bulk densities and sinking rates (Obirikorang et al. Citation2015b). This was similarly observed in this study with the bulk densities correlating positively with sinking velocities. Cottonseed and groundnut meals have individual bulk densities higher than fishmeal (MacMahon and Payne Citation1991; Thomas and van der Poel Citation1996) which possibly explains why the oilseed meal-based diets recorded higher bulk densities. The relatively high addition of wheat bran (∼53%), which has a low bulk density as an ingredient, to the control diet as a diluent of fishmeal could have resulted in the low bulk density of the control diet.
The pellet water stabilities in terms of dry matter and nutrient retention were significantly affected by the inclusions of the oilseed meal mixtures to the experimental diets. The differences in water stability and nutrient retention could be attributed to relative inclusions of different oilseed meals in the diets. In this trial, increasing inclusion levels of copra meal resulted in diets with lower dry matter as well as protein and lipid retention rates, which were similar to the observations of Obirikorang et al. (Citation2015b). Each oilseed meal has its peculiar inherent binding characteristics, which according to Kraugerud and Svihus (Citation2011), is dependent on their chemical constituents and functional properties. Based on the intrinsic binding capabilities, MacMahon and Payne (Citation1991) apportioned different pelletability indices for different ingredients to show whether their dietary inclusions enhanced or reduced pellet binding qualities. Copra meal has a relatively lower pelletability index compared to the other oilseed meals (MacMahon and Payne Citation1991). The pelleting qualities of copra meal were rated as 7 while that of cottonseed and groundnut meal was 8 on a scale of 0–10, where 0 is poor and 10 is excellent. This probably explains why Diet 3, which had higher levels of cottonseed and groundnut meals relative to copra resulted in pellets with the best dry matter retention rates as well as protein and lipid retention rates.
According to Behnke (Citation1996), the physical qualities of feed pellets depend largely on how well particles of the individual ingredients bond together. More specifically, ingredient properties, particularly fibre compositions have been reported to significantly affect pellet quality. High fibre contents (exceeding 10%) are generally known to negatively affect pellet physical properties (Thomas et al. Citation1998; Kaliyan and Morey Citation2009). The fibre content of copra meal could be as much as 16% (Ng Citation2004) which is significantly higher compared to groundnut and cottonseed meals which have fibre contents of <1% and 6%, respectively. Diet 6 which had the highest copra meal inclusion of ∼44%, typified the negative effects of high dietary inclusions of copra meal due to the high fibre content. The lower dry matter and nutrient retention rates of the fishmeal Control diet relative to most of the diets formulated with the oilseed mixtures could be attributed to the high inclusion of wheat bran (54.5%) to dilute the fishmeal protein to achieve a dietary protein of ∼30%. Wheat bran contains about 10% crude fibre (Heuze et al., Citation2015) and this could possibly have accounted for the reduced dry matter as well as nutrient retentions of the Control diet. The phosphorus retentions of Diet 1 and the Control diet which were 100% after 5 min is likely as a result of higher pellet dry matter and macronutrient losses relative to phosphorus loss in the two diets. This trend of selective phosphorus retention is comparable to the findings of Baeverfjord et al. (Citation2006) and Obirikorang et al. (Citation2015b) who reported lipid retentions >100%.
4.2. Faecal matter production
In aquaculture systems, faecal matter represents a major source of solid waste (Franco-Nava et al. Citation2004). Modern aquafeed formulations are tailored to reduce faecal matter production relative to feed intake. The dietary inclusions of the oilseed meal mixtures in this study resulted in increased faecal matter production relative to the fishmeal control diet. The dietary inclusions of the oilseed meal combinations resulted in higher faecal matter production (4 and 45%) relative to the control diet. Generally, the inclusion of the oilseed meals increased faecal matter production in all experimental diets. Copra meal appears to exert a stronger influence on faecal matter production. Diets 2 and 3 which contained <10% copra meal recorded faecal matter productions <300 gDM kg−1 of ingested feed whiles the remaining diets which contained between 22 and 44% copra meal resulted in higher faecal matter production ranging between 333 and 383 gDM kg−1 of ingested feed. Similarly, Obirikorang et al. (Citation2015b) reported high faecal matter production for copra meal diets fed to Nile tilapia which was attributed to poor or inefficient digestion of copra meal by Nile tilapia. It was deduced that, the high dietary levels of indigestible fibre in copra meal was the main factor influencing the increased faecal production rates in tilapia. Although some of the oilseed meal diets recorded better dry matter and nutrient retentions, the higher faecal matter production presents a potential negative implication for water quality in culture systems. According to Cho and Bureau (Citation2001) fish feed and faecal fractions are the main constituents of particulate organic substances, including particulate forms of nitrogen and phosphorus which can contribute to an increase in organic matter and an elevation in biological oxygen demand and eutrophication, respectively.
4.3. Total ammonia-nitrogen excretion rates
The experimental diets were isonitrogenous, therefore, the amino acid composition of the diets may offer an explanation of why inclusion of the oilseed meals generally resulted in lower TAN excretion rates. According to Cowey and Walton (Citation1988), amino acid catabolism of ingested feeds can contribute to as much as 90% of excreted nitrogen in fish. It is therefore probable that the recorded differences in TAN excretion rates could be attributed to differences in amino acid profiles. Unlike fishmeal which meets all the EAA requirements of Nile tilapia, the oilseed meals used in this study are limited in multiple EAAs (Agbo Citation2008; Obirikorang et al. Citation2015a). This could possibly explain why the fishmeal-based control diet elicited a higher post-feeding TAN excretion rates in Nile tilapia relative to Diets 1 and 3. The mismatch in the availability of dietary EAAs or dietary EAAs supplied below the requirements of the target species may also elicit higher postprandial ammonia excretion rates (Fu and Xie Citation2004) which explains the higher postprandial ammonia excretion rates in Diet 2. The peak TAN excretion rates 6 h after feed administration for all the experimental diets in this study, is within the ranges reported for Nile tilapia and other fish species in other studies (Engin and Carter Citation2001; Lam et al. Citation2008; Obirikorang et al. Citation2015a).
4.4. Phosphorus excretion rates
Digestibility and dietary quantities of phosphorus appeared to be the factors that affected the phosphorus excretion rates in the different dietary treatments. In terms of dietary levels, the control diet had the highest phosphorus levels of 2.58%, which was more than twice the dietary phosphorus levels of any of the test diets. The phosphorus requirement of tilapia is estimated to be around 0.5% (NRC Citation1993) implying that phosphorus requirements of the target species in this study were exceeded. According to Bureau and Cho (Citation1999) and Reid and Moccia (Citation2007), the excess supply of dietary phosphorus will result in elevated excretion rates as soluble orthophosphate via the urinary or brachial pathways. Therefore, the high dietary level relative to the requirement in the control diet resulted in significantly higher excretion rates in fish fed fishmeal-based diet. Fishmeal is known to have very high levels of bioavailable phosphorus like most animal protein sources, such as meat and bone meals and its partial replacement by vegetable sources tends to reduce dietary phosphorus levels as well as excretion rates in fish (Cromey et al. Citation2010).
Oilseed meals have a large proportion of their phosphorus in the phytate form, which is unavailable to the fish because they do not possess the enzyme phytase to break down phosphorus in that form (NRC Citation1993). The bioavailable phosphorus in soybean meal has been reported to be between 29 and 54% (Wilson et al. Citation1982). Agbo (Citation2008) reported phosphorus digestibility of 53% in cottonseed meal. Thus, besides the lower dietary levels of phosphorus in the oilseed diets relative to the control diet, the non-availability of significant portions could have accounted for the lower phosphorus excretion rates in fish fed the oilseed meal diets. According to Bureau and Cho (Citation1999), approximately two-thirds of the phosphorus in plant ingredients is present as phytate-phosphorus, with the remaining portion present as inorganic salts or other compounds that are bioavailable to fish. The replacement of fishmeal with the oilseed mixtures might have resulted in diets with low digestibility which in turn resulted in low dissolved phosphorus as was observed in this study. Indigestible phosphorus such as phytate-bound phosphorus is egested in faeces (Bureau and Cho Citation1999; Reid and Moccia Citation2007) and is usually not recorded in the water like metabolic phosphorus that is excreted mostly as phosphate via urine (Bureau, Citation2004).
5. Conclusions
The inclusions of the oilseed mixtures as sources of protein resulted in significantly higher feed bulk densities and sinking velocities relative to the fishmeal control diet. Pellet water stabilities as well as nutrient retentions were also significantly affected by the inclusions of the oilseed meals with most of the oilseed meal diets recording better dry matter and nutrient retentions relative to the control diet. Faecal matter production by Nile tilapia fed the oilseed meal diets was generally higher than the fishmeal-based control diet implying potentially negative effects on water quality. However, the inclusions of the oilseed meals resulted in a 25–35% reduction in dissolved phosphorus and TAN excretion rates relative to the fishmeal-based control diet. The oilseed meal ingredients therefore have huge potential as alternative protein sources in aquafeeds, however, pre-treatments and extrusion may be necessary to reduce the bulk density, high crude fibre contents and poor water stability.
Acknowledgements
Special thanks to the laboratory staff of the Department of Fisheries and Watershed Management, Kwame Nkrumah University of Science and Technology, Kumasi, Ghana for their assistance in sample analysis.
Disclosure statement
No potential conflict of interest was reported by the author(s).
Data availability statement
The data that support the findings of this study are available from the corresponding author upon reasonable request.
Additional information
Funding
References
- Aarseth KA, Perez V, Bøe JK, Jeksrud WK. 2006. Reliable pneumatic conveying of fish feed. Aquac Eng. 35:14–25. doi: 10.1016/j.aquaeng.2005.06.006
- Abarike ED, Attipoe FYK, Alhassan EH. 2012. Effects of feeding fry of Oreochromis niloticus on different agro-industrial by-products. Int J Fish Aquac. 4(8):178–185.
- Agbo NW. 2008. Oilseed meals as dietary protein sources for Juvenile Nile tilapia (Oreochromis niloticus) [PhD Thesis]. Stirling: University of Stirling.
- AOAC. 2005. Official methods of analysis of the official association of analytical chemists, 18th ed. Arlington (VA): Association of the Official Analytical Chemists.
- Baeverfjord G, Refstie S, Krogedal P, Asgard T. 2006. Low feed pellet water stability and fluctuating water salinity cause separation and accumulation of dietary oil in the stomach of rainbow trout (Oncorhynchus mykiss). Aquaculture. 261:1335–1345. doi: 10.1016/j.aquaculture.2006.08.033
- Behnke KC. 1996. Feed Manufacturing technology: current issues and challenges. Anim Feed Sci Technol. 62:49–57. doi: 10.1016/S0377-8401(96)01005-X
- Bureau DP. 2004. Factors affecting metabolic waste outputs in fish. In: Cruz Suarez L.E., Ricque Marie D., Nieto Lopez M.G., Villarreal D., Scholz U., Gonzalez M, editors. Symposium on aquaculture nutrition. Sonora: Hermosillo.
- Bureau DP, Cho CY. 1999. Phosphorus utilization by rainbow trout (Oncorhynchus mykiss): estimation of dissolved phosphorus waste output. Aquaculture. 179:127–140. doi: 10.1016/S0044-8486(99)00157-X
- Cho CY. 1993. Digestibility of feedstuffs as a major factor in aquaculture waste management. In: Kaushik S.J., Luquet P., editors. Fish nutrition in practice. Paris: INRA; p. 363–374.
- Cho CY, Bureau DP. 2001. A review of diet formulation strategies and feeding systems to reduce excretory and feed wastes in aquaculture. Aquac Res. 32:349–360.
- Cowey CB, Walton MJ. 1988. Studies on the uptake of (14C) amino acids derived from both dietary (14C) protein and dietary (14C) amino acids by rainbow trout (Salmo gairdneri) Richardson. J Fish Biol. 33:293–305. doi: 10.1111/j.1095-8649.1988.tb05472.x
- Crab R, Avnimelech Y, Defoirdt T, Bossier P, Verstraete W. 2007. Nitrogen removal techniques in aquaculture for a sustainable production. Aquaculture. 270:1–14. doi: 10.1016/j.aquaculture.2007.05.006
- Cromey CJ, Rodger ANS, Treasurer JW. 2010. Validation of OECD-model for predicted impact of freshwater cage production on In-Loch total phosphorus concentration. ISBN: 978-1- 907266-36-2.
- Engin K, Carter CG. 2001. Ammonia and urea excretion rates of juvenile Australian short-finned eel (Anguilla australis australis) as influenced by dietary protein level. Aquaculture. 194:123–136. doi: 10.1016/S0044-8486(00)00506-8
- Epa UPK, Wijeyaratne MJS, De Silva SS. 2007. A comparison of proximate composition and water stability of three selected shrimp feeds used in Sri Lanka. Asian Fish Sci. 20:7–22.
- FAO. 2018. The State of World Fisheries and Aquaculture 2018. Meeting the sustainable development goals. Rome: Food and Agriculture Organization of the United Nations; p. 210.
- Fournier V, Gouillou-Coustans MF, Métailler R, Vachot C, Moriceau J, Le Delliou H, Huelvan C, Desbruyeres E, Kaushik SJ. 2003. Excess dietary arginine affects urea excretion but does not improve N utilization in rainbow trout (Oncorhynchus mykiss) and turbot (Psetta maxima). Aquaculture. 217:559–576. doi: 10.1016/S0044-8486(02)00420-9
- Franco-Nava MA, Blancheton JP, Deviller G, Le-Gall JY. 2004. Particulate matter dynamics and transformations in a recirculating aquaculture system: application of stable isotope tracers in seabass rearing. Aquacultural Engineering. 31:135–155. doi: 10.1016/j.aquaeng.2004.01.003
- Frisk M, Steffensen JF, Skov PV. 2013. The effects of temperature on specific dynamic action and ammonia excretion in pikeperch (Sander lucioperca). Aquaculture. 404-405:65–70. doi: 10.1016/j.aquaculture.2013.04.005
- Fu SJ, Xie XJ. 2004. Nutritional homeostasis in carnivorous southern catfish (Silurus meridionalis): is there a mechanism for increased energy expenditure during carbohydrate overfeeding? Comp Biochem Physiol. 139:359–363. doi: 10.1016/j.cbpb.2004.10.003
- Glencross BD, Booth M, Allan GL. 2007. A feed is only as good as its ingredients ? A review of ingredient evaluation strategies for aquaculture feeds. Aquac Nutr. 13:17–34. doi: 10.1111/j.1365-2095.2007.00450.x
- Halver JE, Hardy RW. 2002. Fish Nutrition. 3rd ed. California: Academic Press; p. 500.
- Hecht T. 2007. Review of feeds and fertilizers for sustainable aquaculture development in sub-Saharan Africa. In: Hasan M.R., Hecht T., De Silva S.S., Tacon A.G.J., editors. Study and analysis of feeds and fertilizers for sustainable aquaculture development. p. 77–109.
- Heuzé V, Tran G, Baumont R, Noblet J, Renaudeau D, Lessire M, Lebas F. 2015. Wheat bran. Feedipedia, a programme by INRAE, CIRAD, AFZ and FAO. https://www.feedipedia.org/node/726. [Accessed on 25 October 2016].
- Ighwela KA, Ahmad AB, Abol-Munafi IAB. 2013. Water stability and nutrient leaching of different levels of maltose formulated fish pellets. Glob Vet. 10(6):638–642.
- Jauncey K. 1998. Tilapia feeds and feeding. Stirling: Pisces Press; p. 241.
- Jones AB, Dennison WC, Preston NP. 2001. Integrated treatment of shrimp effluent by sedimentation, oyster filtration and macroalgal absorption: a laboratory scale study. Aquaculture. 193:155–178. doi: 10.1016/S0044-8486(00)00486-5
- Kaliyan N, Vance Morey R. 2009. Factors affecting strength and durability of densified biomass products. Biomass Bioenergy. 33(3):337–359. doi: 10.1016/j.biombioe.2008.08.005
- Kim JH, Tanhehco EJ, Ng PKW. 2006. Effect of extrusion conditions on resistant starch formation from pastry wheat flour. Food Chem. 99:718–723. doi: 10.1016/j.foodchem.2005.08.054
- Knudsen D, Ron O, Baardsen G, Smedsgaard J, Koppe W. 2006. Soyasaponins resist extrusion cooking and are not degraded during gut passage in Atlantic Salmon (Salmo salar L.). J Agric Food Chem. 54:6428–6435. doi: 10.1021/jf0604992
- Kraugerud OF, Svihus B. 2011. Effects of online pretreatment of plant ingredients on processing responses and physical properties in extruded fish feed. Anim Feed Sci Technol. 168:250–256. doi: 10.1016/j.anifeedsci.2011.04.089
- Lam SS, Ambak MA, Jusoh A, Law AT. 2008. Waste excretion of marble goby (Oxyeleotris marmorata Bleeker) fed with different diet. Aquaculture. 274:49–56. doi: 10.1016/j.aquaculture.2007.11.023
- MacMahon MJ, Payne JD. 1991. The pelleting handbook. Norway: Borregaard Lignotech; p. 72.
- Miles RD, Chapman FA. 2011. The concept of ideal protein in formulated aquaculture feeds [accessed on 19/05/2016]. http://edis.ifas.ufl.edu/pdffiles/FA/FA14400.pdf.
- Ministry of Fisheries and Aquaculture Development (MoFAD). 2017. Fish production percentage contribution by sector (2016) [accessed on 2018 January 31]. https://www.mofad.gov.gh/publications/statistics-andreports/fish-production/.
- National Research Council, (NRC). 1993. Nutrients requirements of fish. Washington, DC: National Academy Press; p. 114.
- Ng WK. 2004. Researching the use of palm kernel cake in aquaculture feeds. Palm Oil Dev. 41:19–21.
- Obaldo LG, Divakaran S, Tacon GA. 2002. Method for determining the physical stability of shrimp feeds in water. Aquac Res. 33:369–377. doi: 10.1046/j.1365-2109.2002.00681.x
- Obirikorang KA, Amisah S, Fialor SC, Skov PV. 2015a. Digestibility and postprandial ammonia excretion in Nile Tilapia (Oreochromis niloticus) fed diets containing different oilseed by-products. Aquac Int. 23:1249–1260. doi: 10.1007/s10499-015-9881-z
- Obirikorang KA, Amisah S, Fialor SC, Skov PV. 2015b. Effects of dietary inclusions of oilseed meals on physical characteristics and feed intake of diets for the Nile Tilapia, Oreochromis niloticus. Aquac Rep. 1:43–49. doi: 10.1016/j.aqrep.2015.01.002
- Obirikorang KA, Amisah S, Fialor SC, Skov PV. 2015c. Local agro-industrial by-products with potential use in Ghanaian aquaculture: a review. Aquac Int. 23:403–425. doi: 10.1007/s10499-014-9831-1
- Overland M, Romarheim OH, Ahlstrom O, Storebakken T, Skrede A. 2007. Technical quality of dog food and salmon feed containing different bacterial protein sources and processed by different extrusion conditions. Anim Feed Sci Technol. 134:124–139. doi: 10.1016/j.anifeedsci.2006.05.014
- Reid GK, Moccia RD. 2007. Estimating aquatic phosphorus concentrations 30 metres down-current from a rainbow trout cage array. J Environ Monit. 9:814–821. doi: 10.1039/b703585c
- Stirling HP. 1985. Chemical and biological methods of water analysis for aquaculturists, Institute of aquaculture. University of Stirling. Stirling, 119 pp.
- Thomas M, Rijm W, van der Poel AFB. 2001. Functionality of raw materials and feed composition. In: Brufau J, editor. Feed manufacturing in the Mediterranean region. improving safety: from feed to food. Zaragoza, Spain: Zaragoza; pp 87–102.
- Thomas M, van der Poel AFB. 1996. Physical quality of pelleted animal feed 1. Criteria for pellet quality. Anim Feed Sci Technol. 61:89–112. doi: 10.1016/0377-8401(96)00949-2
- Thomas M, van Vliet T, van der Poel AFB. 1998. Physical quality of pelleted animal feed 3. Contribution of feedstuff components. Anim Feed Sci Technol. 70:59–78. doi: 10.1016/S0377-8401(97)00072-2
- Wilson RP, Robinson EH, Gatlin III DM, Poe WE. 1982. Dietary phosphorus requirement of channel catfish. J Nutr. 112:1197–1202. doi: 10.1093/jn/112.6.1197
- Yigit M, Ergun S, Turker A, Karaali B, Erteken A. 2007. Utilization of defatted soybean meal as a protein source in diets for black sea turbot (Psetta maeotica) Oral Presentation, Aquaculture Europe, 24–27 October, 2007, Istanbul.
- Yusoff FMD, Banerjee S, Khatoon H, Shariff M. 2010. Biological approcahes in management of nitrogenous compounds in aquaculture systems. Dyn Biochem, Process Biotechnol Mol Biol. 5(S1):21–31.