
 ?Mathematical formulae have been encoded as MathML and are displayed in this HTML version using MathJax in order to improve their display. Uncheck the box to turn MathJax off. This feature requires Javascript. Click on a formula to zoom.
ABSTRACT
Morphological differences between and within the indigenous goat populations have important economic and socio-cultural values to the communities. This study was phenotypically characterized conformation traits of indigenous goats in selected districts of East Gojjam Zone, Amhara Region, Ethiopia. A total of 706 (589 does, and 117 bucks) mature (>1PPI), healthy, lactating does, and intact bucks goats were used to collect qualitative and quantitative data. The qualitative and quantitative data were analyzed for female and male goats separately using the frequency and general linear model (GLM) procedures of SAS, 9.0, respectively. Most of the does had intermediate fore udder attachment, teat placement side and rearview, and strong central ligament. Most goats were explained by intermediate rear legs set side view, less sloped rump profile, intermediate angle, and strong loin strength. The district and goats dentition had significant influence on does’ bodyweight and most conformation trait measurments. Heart girth (r = 0.82) in does, and neck circumference (r = 0.68) in bucks showed the highest strong and positive correlation (P < 0.001) with bodyweight and were the utmost important variables to predict bodyweight. Indigenous goats in the study area have a dairy aptitude. However, further studies are needed to identify the indigenous goats for their production purpose.
1. Introduction
Conformation of an animal refers to the combination of structural correctness (skeleton, feet, and legs of the animal) and muscling (the loin, rump, forequarters, and hindquarters), which refers to the frame and shape of the animal (Mckenzie-Jakes, Citation2008). Besides, an animal's conformation indicates the anatomy and skeletal function and how it impacts the animal's health, adaptability, longevity, and productivity. It includes all structure, balance, soundness traits of the animal. Thus, conformation traits are those traits that help an animal to perform its functions successfully, and suitable conformations have a direct relationship with the animal's productivity, longevity, and disease resistance potential (Posadas et al., Citation2017). To describe an individual or population of livestock completely, in addition to weight measurements of body conformation, which reduces the cost, labour, and time, is better than the conventional methods of weighing and grading (Putra and Ilham, Citation2019). Conformation traits of goats can be explained with linear type traits measured on a linear scale that goes from one physical extreme for the trait to the other, and structural and functional traits that can directly affect the structural durability, the reproductive and productive performances of goats’ (American Dairy Goat Association, Citation2014).
Conformation traits are the interests of many dairy goat breeders due to their influence on goats’ production, longevity, and profitability beyond their descriptive nature. Therefore, considering conformation traits in selecting replacement stock is worthwhile since their functionality and longevity in the herd depends on their ability to produce milk without problems associated with structural weakness (Sebastian et al., Citation2016). Despain et al. (Citation2018) also noted that in selecting meat-type goats, goats structurally correct are selective over the other. Goats, able to move freely, have good body depth, rectangular shape, are structurally sound and show superior growth, are ideal for meat production (Mckenzie-Jakes, Citation2008). Hence, conformation traits characterization is an essential component of phenotypic characterization to understand breed structure and proportions (Popoola, Citation2015). In Amhara region in general and in the East Gojjam Zone in particular, there are few efforts to characterize conformation traits of goats and the association of these traits with goats’ adaptability, longevity, and productivity (Sheriff and Tegegne, Citation2017). Thus, this study aimed to phenotypically characterize conformation traits of indigenous goats in three selected districts of East Gojjam Zone, Amhara Region, Ethiopia.
2. Materials and methods
2.1. Description of the study areas
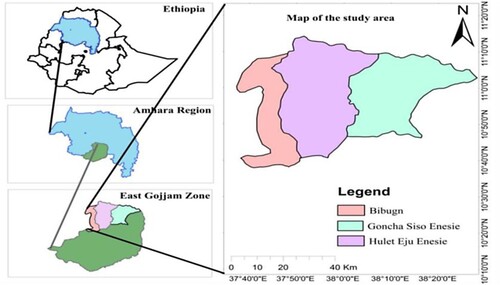
The study was conducted in three adjacent districts (Bibugn, Goncha Siso Enesie and Hulet Eju Enesie districts) purposively selected from East Gojjam Zone, Amhara region, Ethiopia. The study districts were selected based on accessibility, the potential of indigenous goats, the inclusiveness of all agro-ecologies, farmers’ participation in goat production, and the economic contribution of goats in the household income in the areas. Bibugn, Goncha Siso Enesie and Hulet Eju Enesie districts lie between the coordinate points of 11°00'N and 12°24'N latitude and 34o 70'E and 37°35'E longitude, 10o27’ 36” to 11o 53’ 52” N latitudes and 37o12’ 56” to 38o43’ 45’’E longitudes, and 10o45’ 00'’ to 11 10’ 00'’ N latitude and 37o 45’ 69'’ to 38 10’ 00'’ E longitudes, respectively. The altitude of the districts ranges from 1480-4160, 1000-3400, and 1290–4036 in Bibugn, Goncha Siso Enesie, and Hulet Eju Enesie districts, respectively. The study districts have an average annual rainfall of 1500, 1000, and 1100 mm in Bibugn, Goncha Siso Enesie, and Hulet Eju Enesie districts. At the same time, the average annual temperature in Bibugn, Goncha Siso Enesie, and Hulet Eju Enesie districts are 16°C, 15°C, and 18.5°C, in that order. Lowland, midland, and highland agro-ecologies are found in all study districts; however, in Bibugn district, there is also ‘Wurch’ agro-ecology (Districts’ Agriculture development Office, Citation2019). below shows map of the study area.
Figure 1. Map of the study areas.
2.2. Discription of study animals and management
This study was characterized indigenous goat types reared under the traditional management systems in the three districts (Bibugn, Goncha Siso Enesie, and Hulet Eju Eju enesie) of East Gojjam Zone, Amhara Region, Ethiopia. Goats found in these study districts are non discrete indigenous types (Getahun et al., Citation2021). In the area, goats were herded and allowed to freely browse/graze on hillside browsing, and natural pasture in the daytime, access water twice a day, and had nighttime shelter built using iron sheets and wood. Goats were supplemented with homemade grains, brewery by-products, and salt during times of feed shortage. Annual vaccines were given as per the schedule, while treatments were as the animal gets sick. The visual appraisal was used to select breeding females and males, and goats were allowed to breed through natural, uncontrolled mating.
2.3. Sampling technique and sample size determination
A purposive multi-stage sampling technique was used to identify the sample sites. Accordingly, three districts and nine PAs (three from each district) were purposively selected from the East Gojjam Zone based on information collected from preliminary field surveys, discussions of agriculture experts and farmers live in each study site. Selection criteria's including agro-ecology, accessibility, the potential of the goat population, and the relative economic contribution of goats for the goat-keeping households income, were considered.
A total of 706 goats (589 does and 117 bucks) that were with dentition ≥1PPI, healthy, and physiologically lactating females and intact males were considered for the study. Samples were taken proportionally from each sampling PAs based on the size of the goat population after the total sample size is determined using the Cochran (Citation1977) formula suggested by FAO (Citation2012). The formula used to determine the goat population to study conformation traits was:
Where;
n = required sample size.
z = z value at a given percent confidence level.
m = error margin (for this study 0.06 was considered)
P = estimated % of the sample that was respond a given way to a survey question.
n’ = corrected sample size.
N = total population size.
2.4. Data types and methods of data collection
Quantitative and qualitative traits were collected from a total of 706 heads of goats (). The conformation traits considered, the reference points, and procedures used was as specified by ICAR (Citation2017) and FAO (Citation2012) for conformation traits recording of dairy goats and phenotypic characterization of animal genetic resources, respectively (). Animal care and all trait measurement procedures were complied with Federation of Animal Science Societies, Citation2010. A linear measurement scale (textile measuring tape) was used for conformation traits measurements, and live body weight was measured using weighing balance of 120 kg capacity and 0.2 kg precision. Measurements were taken in the morning to avoid the effect of feeding and watering. Qualitative information on loin strength, rump angle, angularity, rear legs set side view from both sexes and central ligament, fore udder attachment, teat placement rearview, teat placement side view, and teat form for female goats were collected by observation, and judgments were given based on the specifications set by ICAR (Citation2017) ().
Table 1. Summary of the total number of sample goats and PAs by districts
Table 2. Definition of conformation traits used in the study.
2.5. Data management and analysis
The collected data were checked for completeness and consistency, and qualitative data were coded. All coded qualitative and quantitative data were entered into Microsoft office excel worksheet, 2019, and arranged for software analysis. Before conducting the principal data analysis, screening of outliers was employed. Observations on qualitative conformation traits were analyzed for male and female goats of the sample districts using the Statistical Analysis System (SAS, 9.0). Chi-square (χ2) test of independence was done between districts and the respective qualitative traits.
On the other hand, quantitative data from morphometric measurements of conformation traits were analyzed using the statistical analysis system's (SAS, 9.0) general linear model (GLM) procedures. Location (districts) and goat's dentition class, were considered fixed factors, whereas, morphometric measurements of conformation traits were deemed to be dependent variables for the analysis. The significance of the independent variables’ effect on dependent variables was checked by analysis of variance (ANOVA), and if significance is declared, means were separated using Duncan multiple ranges mean separation method. The statistical model used to analyze linear conformation traits was as follow:
Where;
Yij = the records or measurement of linear conformation traits in the ith location and jth dentition class of the experimental goat
µ = overall mean
Li = effect of the ith location (i = Bibugn, Hulet Eju Enesie and Goncha Siso Enesie)
Dj = effect of the jth dentition class (j = 1PPI, 2PPI, 3PPI, 4PPI, and Broken)
eij = random error term associated with each observation
Correlation (Pearson's correlation coefficient) between body weight and other linear conformation traits of goats was calculated separately for does and bucks. Stepwise multiple linear regression analysis was used to obtain models to predict bodyweight from linear conformation trait measurements using the REG procedure of the SAS, 9.0. The best-fitted models were selected based on a higher coefficient of determination (R2) and lower mean square of error (MSE) and mallow's parameters C (p). The statistical model used for multiple regression analysis for does and bucks was as follow:
Where;
Υj = the response variable; live body weight
β0 = the intercept
X1, … , Xn are the explanatory variables (chest width, body depth, rump width, rear legs set rear view, body length, heart girth, paunch girth, wither height, hip height, cannon length, cannon circumference, neck circumference, neck length, rump length, rear udder height, rear udder width, udder width, udder depth, udder circumference, teat length, scrotal circumference, scrotal width, and scrotal length)
β1, … , βn are regression coefficients of the variables X1, … , Xn
ej = random error term associated with each observation
3. Results and discussions
3.1. Qualitative conformation traits descriptions
The observed results on qualitative conformation traits of the indigenous goat types for both sexes in the study area are presented in and , and illustrated on and . From the total observed does in the study districts, more than half, 51.82% in Bibugn, 55.7% in Goncha Siso Enesie, and 57.85% in Hulet Eju Enesie districts, of does had an intermediate level of fore udder attachment (FUA). Next to the intermediate level, does with strongly attached udder as viewed from the front covered the highest proportion in Goncha Siso Enesie (24.47%) and Hulet Eju Enesie (27.27%) districts. But, in Bibugn, does with loosely attached udder as viewed from the front (29.09%) covered the highest proportion. The proportions of does grouped in loose FUA in Goncha Siso Enesie (19.83) and Hulet Eju Enesie (14.88%) were significantly (P < 0.05) lower than in Bibugn (29.09%); whereas, a high percentage of strong/tight FUA was found in Hulet Eju Enesie (27.27%) than in Bibugn (19.09%) and Goncha Siso Enesie (24.47%). A similar result was reported by Mammo et al. (Citation2017) that almost all dairy (90%) and all dual and meat-type indigenous cattle had an intermediate FUA in Northwest Amhara. Mammo et al. (Citation2017) also noted that unlike strong/tight and intermediate FUA, loose/weak FUA indicates poor udder conformation. The ideal udder of dairy goats should be firmly attached in the front with a high and wide attachment in the rear and should not extend below the height of the hocks (Holyoke et al., Citation1979).
Figure 2. Structural qualitative conformation traits of a doe and a buck in the study area (Photo courtesy: Mezgebu Getaneh). A strong loin, straight rear legs as viewed from the side and rear, and normal rump angle doe (a); a buck with intermediate rump angle and loin strength, and strait rear legs as viewed from the side and rear (b); LS = Loin strength; RLSSV = Rear legs set side view.
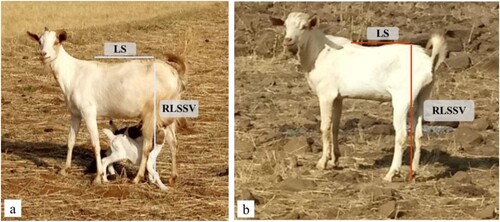
Figure 3. Different types of does’ udder and teat morphology in East Gojjam Zone (Photo courtesy: Mezgebu Getaneh). A well attached udder to the body wall and have a strong central ligament/cleft as viewed from the rear (a) and as viewed from the front (c); finger-like teats pointing downward (c), udder intermediately attached to the body wall as viewed from the front with teats pointing to the front as viewed from the side (b), loosely attached udder as viewed from both front and rear, have broken central ligament, hanging below the hocks and have tiny teats pointing to the front as viewed from the side (d).
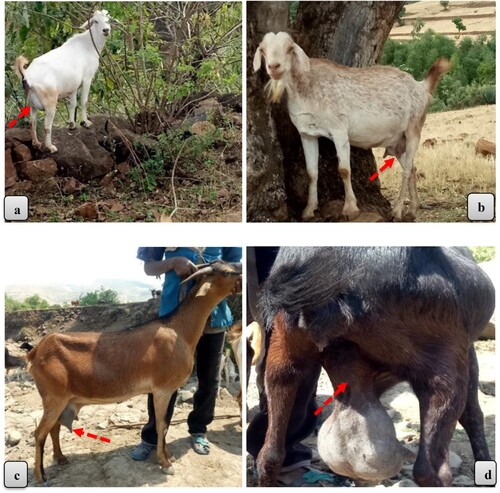
Table 3. Descriptions of qualitative conformation traits of does in East Gojjam Zone.
Table 4. Descriptions of qualitative conformation traits of does and bucks in East Gojjam Zone.
Similarly, in respect to teat placement rearview (TPRV) and teat placement side view (TPSV), the majority, 62.73% in Bibugn, 45.99% in Goncha Siso Enesie, and 60.74% in Hulet Eju Enesie and 62.73% in Bibugn, 62.45% in Goncha Siso Enesie, and 68.18% in Hulet Eju Enesie of the evaluated does were grouped under an intermediate level of TPRV and TPSV, respectively. The proportion of downward TPRV (24.55%) in Bibugn, (30.8%) in Goncha Siso Enesie and (26.03%) in Hulet Eju Enesie was higher than the proportion of outside TPRV (12.73%) in Bibugn, (23.21%) in Goncha Siso Enesie, and (13.22%) in Hulet Eju Enesie districts. Whereas, the proportion of front TPSV (20.91%) in Bibugn, (20.25%) in Goncha Siso Enesie, and (16.12%) in Hulet Eju Enesie was higher than the proportion of bottom TPSV (16.36%) in Bibugn, (17.3%) in Goncha Siso Enesie, and (15.7%) in Hulet Eju Enesie districts. Teats pointing outside as viewed from the rear were not desirable teat positions due to their difficulty for nurses and machine milking.
The majority of the evaluated does (40.91%) in Bibugn and (46.28%) in Hulet Eju Enesie districts were categorized in the intermediate teat form (TF), followed by finger-like/narrow and triangle/ wide teat form categories (36.36% and 22.73%) in Bibugn and (44.63% and 9.09%) in Hulet Eju Enesie districts, respectively. In contrast, from all examined does in Goncha Siso Enesie, about 62.45% were laid in finger-like/narrow teat form, followed by intermediate (29.11%) and triangle/wide (8.44%) teat forms, respectively. Triangular or wider teat form is not desirable teat morphology. Okano et al. (Citation2015) stated that changes in teat shape are associated with the incidence of mammary inflammation since the main route of mastitis transmission occurs by bacterial penetration through the teat. Thus, females with undesirable teat shapes (plumped and bottle-shaped) had a higher incidence of mastitis than females with desirable teat shapes, which affects longevity or productive life. Besides, as teat size becomes larger, they tend to be thicker, less symmetrical, and suspend below the hock, which are undesirable teat morphologies (Rasby, Citation2011).
From the examined does in each district, the highest proportion (74.55%) in Bibugn, (72.57%) in Goncha Siso Enesie and (69.01%) in Hulet Eju Enesie had cleft udder with strong central ligament (CL). Does with the intermediate divided udder, 16.36%, 14.35%, and 19.01% were covered for Bibugn, Goncha Siso Enesie and Hulet Eju Enesie districts, respectively. But, some proportion of the population in each district, Bibugn (9.09%), Goncha Siso Enesie (13.08%) and Hulet Eju Enesie (11.98%), had undivided udder with broken central ligament, which is undesirable udder traits because of the ideal udder morphology. Rasby (Citation2011) noted that weak/broken CL resulted in loose and pendulous udder attachment surpassed the height of the hock, and teats did not point downwards when filled with milk. Thus, a strong central ligament is essential for good udder conformation, rear teat placement and teat length indirectly (Mammo et al., Citation2017). The variation in udder and teat morphology of does from different locations, and presence of undesirable udder and teat morphology may be due to one-sided long term selection of does to rise milk production to nurse the new born kids (Vrdoljak et al., Citation2020). Regarding the rear legs set side view (RLSSV), almost all the examined goats from both sexes laid in the intermediate, and strait rear legs set side view. However, about 2.68% (5.13% males and 1.82% females) in Bibugn, 1.09% females in Goncha Siso Enesie and 4.96% females in Hulet Eju Enesie districts were judged as sickled rear legs as viewed from the side, which is not an indicator of an ideal set of rear legs. Sickled rear legs resulted in scuffing walk (Holyoke et al., Citation1979), which is difficult to walk long distances for browsing in fields and watering (Mammo et al., Citation2017).
Unlike few (2.54% females) in Goncha Siso Enesie and (2.48% females) in Hulet Eju Enesie districts, which had an extremely sloped rump profile, all of the evaluated goats from both sexes had less sloped rump profile, followed by an intermediate slope. Similarly, regarding angularity (Ag), almost all of the examined goats from both sexes had an intermediate angle, followed by a large angle in all the study districts. However, about 5.37% females in Bibugn, 9.06% females in Goncha Siso Enesie, and 7.12% females in Hulet Eju Enesie districts laid in small-angle and there were no male goats characterized with small-angle in all the study districts. From total examined goats including all sexes in each district, the highest proportions (73.83%) in Bibugn, (54.71%) in Goncha Siso Enesie, and (57.65%) in Hulet Eju Enesie districts were characterized as strong loin strength (LS). The second high percentage is about (24.83%) in Bibugn, (34.78%) in Goncha Siso Enesie, and (36.65%) Hulet Eju Enesie districts were covered by the intermediate loin strength. In contrast, some percentage of the examined goats (1.34%) in Bibugn, (10.51%) in Goncha Siso Enesie, and (5.69%) in Hulet Eju Enesie districts had weak loin strength. Extremely sloped rump, small-angle, and weak loin strength, which are rarely observed in the present study, are not indicators of suitable conformations of goats. Besides influencing the length and width of the udder, a rump that is steeply tilted and bound by a narrow pelvic girdle (hips and pins) hinders normal kidding (Holyoke et al., Citation1979). Holyoke et al. (Citation1979) also noted that the loin must be strong to support the muscles that carry the digestive organs’ weight and the young during pregnancy in females.
3.2. Quantitative conformation traits of does and bucks
3.2.1. Structural conformation traits variation for does
The result pertaining to quantitative conformation traits of does’ are presented in . In the current study, district had a significant (P < 0.001) effect on does’ bodyweight and conformation traits. However, body length (BL), cannon length (CL), and rear legs set rearview (RLSRV) were not significantly (P > 0.05) affected by location. Does in Bibugn were significantly (P < 0.001) higher than does in Goncha Siso Enesie and Hulet Eju Enesie in seven conformation trait measurements [whither height (WH), hip height (HH), heart girth (HG), paunch girth (PG), rump width (RW), rump length (RL), and cannon circumferences (CC)] from all compared linear conformation traits measurements. Hence, they were more prominent in skeletal measurements, the essential characteristics because of goats’ production and reproduction performances. In contrast, does in Hulet Eju Enesie were significantly (P < 0.001) higher in four conformation traits [body depth (BD), chest width (CW), neck circumference (NC), and body weight (BW)] than does in Bibugn and Goncha Siso Enesie districts. While does from Goncha Siso Enesie were measured a significantly (P < 0.001) higher value only in neck length (NL).
Table 5. Mean (±SD) of body weight (kg) and conformation traits measurements (cm) of local does in East Gojjam Zone.
The above results indicated significant variations in body weight and linear conformation traits measurements among goat populations of the study areas, a critical selection base for future breed improvement. The difference in body weight and conformation traits measurements of does among the studied locations may be due to the management differences between goat populations reared at different places that resulted in the genotype by environment interaction, which in turn either enhance or retard goats’ skeletal development. Population differences (Arandas et al., Citation2017) and (or) ecological variations (Hagan et al., Citation2012) resulted in morphologically variable goat populations. Researchers from Ethiopia and other parts of the world (Hagan et al., Citation2012; Tesfahun, Citation2013; Bedada et al., Citation2019; Birhanie et al., Citation2019; Lucas et al., Citation2020) were also noted that in addition to sex, age and their interaction effect, the location has a significant impact on goats body weight and linear body measurements.
Similarly, the does’ age group had a significant (at least P < 0.05) effect on body weight and other linear conformation trait measurements indicated that as does’ age increases, it exceeds in body weight and all linear conformation trait measurements. Webb et al. (Citation2011) stated that growth is a chronological process, and its inevitable consequences are an increase in size and aging. Different authors reported similar findings in Ethiopia (Alemayehu et al., Citation2015; Bedada et al., Citation2019; Birhanie et al., Citation2019). However, except for body depth (BD), heart girth (HG), and paunch girth (PG), there was no significant (P > 0.05) difference between 4PPI and Broken age groups. Fajemilehin and Salako (Citation2008) noted that the animal's age significantly influenced body weight and linear body measurements until 2–3 years.
The bodyweight of does in Hulet Eju Enesie (33.29 ± 5.64 kg) was comparable with Bati does (33.97 ± 0.49 Kg), but higher as compared with Borena (31.49 ± 0.36 kg) and short-eared Somali (24.67 ± 0.28 kg) does as reported by Gatew (Citation2014). On the other hand, bodyweight of does in Goncha Siso Enesie (30.86 ± 5.37 kg) was almost consistent with local does (30.4 Kg) reared in Arbaminch Zuria (Dea et al., Citation2019) but higher as compared with local does (22.66 ± 0.31 kg) raised in Central Zone of Tigray (Birhanie et al., Citation2019) and Borena does (27.99 ± 1.12 kg) reported by Bedada et al. (Citation2019). Body length (BL), whither height (WH), hip height (HH), heart girth (HG), and rump length (RL) of does’ in this study were higher than local goats reared in Central Zone of Tigray but, almost similar chest width (CW) was recorded (Birhanie et al., Citation2019). Similarly, Bedada et al. (Citation2019) was recorded lower overall mean values of body length (64.34 ± 1.06 cm), chest girth (69.6 ± 1.15 cm), and whither height (66.64 ± 0.06 cm) for Borena does. The paunch girth (PG) (68.96 + 0.77 cm) and neck circumference (NC) (28.69 + 0.32 cm) of West African Dwarf female goats reported by Rotimi et al. (Citation2020) were lower than the present findings. In contrast, Abdallah et al. (Citation2019) were recorded higher paunch girth (96.70 ± 2.96 cm), cannon circumference (9.10 ± 0.23 cm), and nearly similar neck circumference (32.70 ± 1.24 cm) for Boar does’. Alemayehu et al. (Citation2015) reported a greater value of neck length (30.58 ± 0.26 cm) and rump width (18.27 ± 0.14 cm) for local goats. These observed differences could be explained by genetic variation between goat populations, management differences, measurement season, and farmers’ trait preference and selection practices conducted by goat keepers from different locations and production systems.
3.2.2. Udder and teat traits measurements of does
The overall means (±SD) of udder and teat measurements of does are presented in . The location had a significant effect on rear udder height (RUH), rear udder width (RUW), and teat length (TL). But, udder width (UW), udder circumference (UC), and udder depth (UD) of does were not significantly (P > 0.05) affected by location. In other words, their variation was not explained by locational differences. Does in Hulet Eju Enesie were recorded significantly the highest values of RUH and RUW (P < 0.001) than does in Bibugn and Goncha Siso Enesie and the highest TL (P < 0.05) as compared with does in Goncha Siso Enesie. However, there were no statistical (P > 0.05) differences between locations in UW and UC measurements, the highest figurative values of these traits were observed for does in Hulet Eju Enesie district. Thus, does in Hulet Eju Enesie were recorded the highest values of external udder measurements suited for high milk production. Vrdoljak et al. (Citation2020) stated that the circumference, width, and depth of the udder are strongly correlated with the milk production of goats. Martínez et al. (Citation2011) also noted that udder circumference, width, and height had been identified as traits that could replace the udder volume, directly related to milk yield. This variation might be due to genotype, lactation stage of the examined does, parity, management differences, and farmers’ selection pressure practiced in the studied districts. Mingoas et al. (Citation2017) noted that udder traits are varied with the breed, udder portion, lactation stage, and parity. Similarly, Birhanie et al. (Citation2019) pointed out that udder circumference, rear udder diameter, and teat length of local does, raised in the Central Zone of Tigray, were significantly different among the studied districts. In contrast, Alemayehu et al. (Citation2015) mentioned that district had no significant effect on rear udder diameter, rear udder length, teat length, and udder circumference of local does’ reared in West Amhara.
Table 6. Mean (±SD) of udder and teat measurements (cm) of local does in east Gojjam Zone.
Does age had a significant (P < 0.001) influence on udder measurements (rear udder height, rear udder width, udder circumferences, and udder width) and teat length (P < 0.05), but not udder depth (P > 0.05). This showed that like other conformation trait measurements, as does age increases, external udder size and teat measurements were also increased. This may be due to an increase in the hormonal status of the animal's body, nutrient intake, and metabolic activity of the animal. Amao et al. (Citation2003) observed that udder traits of West African Dwarf goats were influenced by age, lactation status, and live body weight. Birhanie et al. (Citation2019) reported that teat length of local does in the Central Zone of Tigray was significantly (P < 0.001) affected by district, which is similar to the present finding. On the contrary, as pointed out by Merkhan and Alkass (Citation2011), udder and teat measurements (udder width, udder circumference, udder length, the distance between teats, right and left teat diameter, and right and left teat length) of Black and Meriz does were not significantly (P > 0.05) influenced by does’ age.
The overall mean of udder circumference was almost similar with Red Sokoto does (28.14 ± 0.13 cm) (Zahraddeen et al., Citation2008), the Sahel does (28.00 ± 2.35 cm), and Kano brown does (28.40 ± 2.57 cm) Sam et al. (Citation2017). But, it was lower than Black does (37.98 ± 1.96 cm) and Meriz does (34.36 ± 0.94 cm) (Merkhan and Alkass, Citation2011), and higher as compared with West African Dwarf does (24.53 ± 0.15 cm) (Zahraddeen et al., Citation2008). Alemayehu et al. (Citation2015) reported the overall mean of 9.21 ± 0.17 cm rear udder diameter and 3.46 ± 0.05 cm teat length of local does in west Amhara, nearly similar to the present finding. In contrast, Birhanie et al. (Citation2019) recorded higher rear udder diameter (10.02 ± 0.21 cm), and lower teat length (2.92 ± 0.06 cm) of local does. Merkhan and Alkass (Citation2011) also recorded higher udder width of Black (11.617 ± 0.363 cm) and Meriz (11.134 ± 0.24 cm) does. Kouri et al. (Citation2018) reported udder depth (12.9 ± 1.1 cm) and teat length (2.5 ± 0.2) of Bedouin does, which were lower than the present values. These variation in udder and teat measurments may be ascribed by location and population dismilarities across the studied goat breeds.
3.2.3. Structural conformation traits variation for bucks
The overall means (±SD) of body weight and linear conformation trait measurements of bucks are presented in . The location had a significant influence on body depth, rump width and cannon length (P < 0.05), neck circumference and rump length (P < 0.01), and cannon circumferences (P < 0.001) measurements of bucks. However, body weight, body length, whither height, hip height, heart girth, paunch girth, chest width, neck length, rear leg set rearview and scrotal measurements (length, width, and circumference) were not significantly (P > 0.05) affected by location. The former may be due to population and management (feeding, selection, and breeding) differences between the study districts, while the second may be due to the non-inclusiveness of elder age class (>2PPI) of bucks during the evaluation, which was not the case for does. Bucks in Hulet Eju Enesie were recorded the highest NC and the lowest CC and RW than bucks in Bibugn and Goncha Siso Enesie districts. On the other hand, bucks in Bibugn district were recorded the highest BD and the lowest RL than bucks in Hulet Eju Enesie and Goncha Siso Enesie districts. But, bucks in Goncha Siso Enesie district were only higher in CL measurement. In addition, bucks’ dentition class significantly affected bodyweight (P < 0.001), and other conformation trait measurements, except chest width, rump length, rear legs set rearview, cannon circumference, scrotal width, and scrotal length, which was also the case in does.
Table 7. Mean (±SD) of body weight (kg) and conformation traits measurements (cm) of local bucks in East Gojjam Zone.
The overall mean of bucks’ body weight (25.84 ± 4.01 kg) was nearly similar with Borana bucks (26.26 ± 1.27 kg) (Bedada et al., Citation2019) but lower than male goats in Arbaminch Zuria (30.9 kg) and Mirab-Abaya (29.7 kg) districts (Dea et al., Citation2019). Male goats in Arbaminch-Zuria and Mirab-Abaya were recorded lower BL (57.1 cm; 57.3 cm), WH (62.2 cm; 59.4 cm) and RL (16.3 cm; 17.6 cm) but, higher RW (16.3 cm; 14.9 cm), respectively as reported by Dea et al. (Citation2019). Hankamo et al. (Citation2020) also reported higher values of BW (29.08 ± 0.41 kg), BL (63.73 ± 0.54 cm), CG (68.26 ± 0.45 cm) and RW (15.45 ± 0.23 cm) but, lower values of WH (63.72 ± 0.40 cm), RH (65.97 ± 0.40 cm), RL (16.97 ± 0.19 cm) and NC (31.7 ± 0.3 cm) for local bucks aged 1–2 years reared in Aroresa area, Sidama Zone. All scrotal measurements in this study were slightly lower than local bucks reared in West Amhara (Alemayehu et al., Citation2015). These variations between bucks’ body weight and conformation trait measurements may be due to population dissimilarity and management differences across the study areas covered by different authors.
3.3. Relationships between bodyweight and conformation traits
The Pearson's correlation coefficients between body weight and conformation traits of does and bucks are presented in and . In this study, Pearson's correlation coefficients between bodyweight and linear conformation traits of both does, and bucks were varied from strong (r = 0.82 for does; r = 0.68 for bucks) to weak (0.12 for does; 0.02 for bucks) and from very highly significant (P < 0.001) to non-significant (P > 0.05). In does strong positive relationships were observed between body weight and heart girth (r = 0.82), paunch girth (r = 0.77), body length (r = 0.70), and body depth (r = 0.70). Whither height (r = 0.59), hip height (r = 0.58), neck circumferences (r = 0.58), and cannon circumference (r = 0.50) had correlated moderately and positively with does’ body weight. Strong positive correlations were also observed between hip height and whither height (r = 0.91), paunch girth with heart girth (r = 0.83) and body depth (r = 0.73), heart girth with body depth (r = 0.74), and udder circumference with udder width (r = 0.77) of does. The high correlation between body weight and linear conformation traits measurements implies that selection of does based on one or more of these traits except udder depth (r = −0.12) would indirectly enhance body weight or could be used to predict does live bodyweight.
Table 8. Pearson's correlation coefficients between structural conformation traits of local does in East Gojjam Zone.
Table 9. Pearson's correlation coefficients between structural conformation traits of local bucks in East Gojjam Zone.
A positive and strong correlation was observed between body weight and neck circumference (r = 0.68) in bucks. Heart girth (r = 0.58), body length (r = 0.52), paunch girth (r = 0.51), and body depth (r = 0.50) were moderately and positively correlated with body weight. Likewise, in bucks, strongly positive correlations were observed between conformation traits (body length, whither height, hip hight, heart girth, and paunch girth) considered. Similar to this study, Chiemela et al. (Citation2015) stated that neck circumference and body weight are highly correlated traits. From all traits considered, the highest strong and positive correlation was found between body weight and heart girth (r = 0.82) for does and between body weight and neck circumference (r = 0.68) for bucks. This indicated that either heart girth (for does) and neck circumference (for bucks) alone or combining these traits with other conformation traits could be suggested as a good estimator of live body weight for does and bucks. Similarly, Tilahun et al. (Citation2019), Bedada et al. (Citation2019), Dea et al. (Citation2019), Birhanie et al. (Citation2019), and Hankamo et al. (Citation2020) were observed the highest strong and positive correlation between body weight and heart girth of Ethiopian indigenous goats.
3.4. Prediction of bodyweight from conformation traits measurements
Knowledge of live body weight is vital for effective goat management (medication, feeding, monitoring growth, marketing, and selecting replacements). Most intuitively, it can be assessed by weighing scales, which is seldom met in the field (Mahieu et al., Citation2011). Thus, in such cases, body measurements, mostly heart girth, wither height, and body length, can be used to estimate goats’ live body weight (Abebe and Yami, Citation2008). A stepwise regression procedure was carried out to generate models for predicting the body weight of both does and bucks separately from conformation traits measurements. The results are presented in . All variables were fitted into the model, and through stepwise elimination procedure, the optimum models were identified by the higher R2, the smaller mallow's parameters C (p), and mean square of error (MSE).
Table 10. Regression of live body weight on different body measurements for local does and bucks in East Gojjam Zone.
The present result revealed that heart girth and neck circumference were the most important variables for predicting body weight of does and bucks, respectively. In does, heart girth alone accounted for 66.6% of the variation in body weight whereas, when combined with neck circumference, 71.5% of does’ body weight was explained. This result was evident by strong and moderate correlation of does’ bodyweight with heart girth and neck circumference (r = 0.82; r = 0.58), respectively. The model's accuracy was increased to 76.9% when body length, paunch girth, body depth, udder depth, rear udder height, and rump width were included alongside heart girth and neck circumference. Regarding bucks, neck circumference alone accounted for 45.7% of the variation in body weight, and when combined with cannon bone length, it was increased to 49.5%. The model's accuracy increased to 57.2% when the scrotal length and heart girth were combined with neck circumferences and cannon bone length. Better model accuracy was observed in does than bucks, which may be due to the non-inclusiveness of bucks older than 2PPI in the analysis. Alex et al. (Citation2010) note that body measurements were poorly estimated weight of animals at a younger age. Seid et al. (Citation2016), Dea et al. (Citation2019), Tilahun et al. (Citation2019), Bedada et al. (Citation2019) and Hankamo et al. (Citation2020) were reported heart girth as the outmost variable to predict the bodyweight of indigenous goats in Ethiopia, which was also the case in does in the present study. Whereas, the result about bucks was similar with Hankamo et al. (Citation2020), who stated that bucks with thicker necks usually have higher body weight.
4. Conclusion
Product-specific conformation traits characterization of indigenous goats in the study area revealed that most goats in the study areas have desirable qualitative body conformation (loin strength, angularity, rear legs set, and rump profile). Does in Bibugn and Hulet Eju Enesie districts have also desirable udder and teat morphology; however, many does in Goncha Siso Enesie district have narrow teat form. Bodyweight, most linear conformation traits measurements, and the qualitative traits of goats vary across the study location, shows the opportunity for genetic improvement through within-breed selection. Besides, the skeletal and udder measurements showed that indigenous goats in the study area have dairy biotypes. However, farmers are used for meat production. Thus, on-station and on-farm performance evaluation and identification of farmers’ goat breeding objectives in the area are vital to understanding indigenous goats’ real production potential and purposes in the study area.
Acknowledgment
The authors would like to express their great appreciation to the Ministry of Education, Dilla University, and Bahir Dar University, Ethiopia, for financial support and facilitation. The authors also duly acknowledge all agriculture development experts and goat keepers in the area for their help during data collection.
Disclosure statement
No potential conflict of interest was reported by the authors.
Additional information
Funding
References
- Abdallah S, Salman F, Shoukry M, Rahman HA-E, Mohamed M, Abedo A. 2019. Study of some morphological characteristics of boer goat raised in Egypt. Adv Anim Veterinary Sci. 7:888–897.
- Abebe G, Yami A. 2008. Sheep and goat management. In: Yami A and Merkel RC, editors. Sheep and goat production handbook for Ethiopia. Addis Ababa, Ethiopia: Ethiopia Sheep and Goat Productivity Improvement Program (ESGPIP); p. 34–57.
- Alemayehu K, Kebede D, Melese A, Andualem S. 2015. Selection of indigenous goat types for designing product specific breeding strategy in selected districts of west amhara, Ethiopia. World Appl Sci J. 33:1279–1285.
- Alex R, Raghavan K, Mercey K. 2010. Prediction of body weight of malabari goats from body measurements under field conditions. J Vet Anim Sci. 41:21–27.
- Amao OA, Osinowo OA, Onwuka CIF, Abiola SS, Dipeolu MA. 2003. Evaluation of udder traits in West African Dwarf goats. Niger J Anim Prod. 30:246–252.
- American Dairy Goat Association. 2014. Linear appraisal system for dairy goats. pp. 1–4.
- Arandas JKG, da Silva NMV, Nascimento RDB, Pimenta Filho EC, Albuquerque Brasil LHD, Ribeiro MN. 2017. Multivariate analysis as a tool for phenotypic characterization of an endangered breed. J Appl Anim Res. 45:152–158. doi:10.1080/09712119.2015.1125353.
- Bedada ZE, Gilo BN, Debela GT. 2019. Morphometric and physical characterization of borana indigenous goats in southern oromia, Ethiopia. Universal J Agric Res. 7:25–31. doi:10.13189/ujar.2019.070104.
- Birhanie M, Alemayehu K, Mekuriaw G. 2019. Morphological characterization of goat populations in Central Zone of Tigray, Ethiopia. Trop Anim Sci J. 42:81–89. doi:10.5398/tasj.2019.42.2.81.
- Chiemela PN, Sandip B, Egbu CF, Akpolu ES, Ugbo EH. 2015. Factors in HIV prevention. J Adv Academic Res. 1:1–8.
- Cochran W. 1977. Sampling techniques, 3rd edition. New York: John Wiley and Sons.
- Dea D, Eramo E, Gambura M, Zeleke B. 2019. Performance of boer and woyto-guji crossbred F1 goats (50%) under semi-intensive management system in konso district, south Ethiopia. J Agric Environ Sci. 4:15–25.
- Despain D, Nay K, Heaton K. 2018. Junior Livestock Shows “ Market Goats “.
- Districts’ Agriculture Development Offices. 2019. Livestock censes of Hulet Eju Enesie, Goncha Siso Enesie, and Bibugn districts, East Gojjam Zone, Ethiopia (unpublished).
- Fajemilehin OKS, Salako AE. 2008. Body measurement characteristics of the West African Dwarf (WAD) goat in deciduous forest zone of southwestern Nigeria. Afr J Biotechnol. 7:2521–2526. doi:10.4314/ajb.v7i14.59069.
- FAO. 2012. Phenotypic characterization of animal genetic resources. FAO Animal Production and Health Guidelines no 11,Rome, Italy.
- Federation of Animal Science Societies. 2010. Guide for the Care and Use of Agricultural Animals in Research and Teaching.
- Gatew H. 2014. On-farm phenotypic characterization and performance evaluation of Bati, Borena and Short eared Somali goat population of Ethiopia. MSc. thesis, Haramaya University, Ethiopia.
- Getahun S, Ahmed S, Zemene W. 2021. Morphometric characterization of indigenous goats in East Gojjam Zone, Amhara Region, ethiopia. J Nat Sci Res. 12:21–32. doi:10.7176/JNSR/12-17-03.
- Hagan J, Apori O, Bosompem M, Ankobea G, Mawuli A. 2012. Morphological characteristics of indigenous goats in the coastal savannah and journal of animal Science advances morphological characteristics of indigenous goats in the coastal savannah and forest Eco-zones of Ghana. J Anim Sci Adv. 2:813–821.
- Hankamo A, Woldeyohannes T, Banerjee S. 2020. Morphometrical characterization and structural indices of indigenous goats reared in Two production systems in sidama zone, southern Ethiopia. Int J Anim Sci Technol. 4:6–16. doi:10.11648/j.ijast.20200401.12.
- Holyoke A, Duane J, Ray Y, Gary S, Jake V, Randy D. 1979. Dairy and dairy goat evaluation and judging. Oregon: Oregon state university extension service. pp. 1-28.
- ICAR, (International Committee for Animal Recording). 2017. Guidelines for conformation recording of dairy cattle, beef cattle and dairy goats: Section 5.
- Kouri F, Charallah S, Kouri A, Amirat Z, Khamma F. 2018. Milk production and its relationship with milk composition, body and udder morphological traits in bedouin goat reared under arid conditions. Acta Scientiarum. Anim Sci. 41:42552–42510. doi:10.4025/actascianimsci.v41i1.42552.
- Lucas AS, Lanari MR, Oyarzabal MI. 2020. Caracterización fenotípica de la población caprina de la provincia de santa elena, ecuador. Arch Zootec. 69:22–29. doi:10.21071/az.v69i265.5035.
- Mahieu M, Navès M, Arquet R. 2011. Predicting the body mass of goats from body measurements. Livestock Res Rural Dev. 23:1–15.
- Mammo M, Alemayehu K, Tassew A. 2017. Conformation traits of dairy cattle populations in selected districts of northwestern amhara, Ethiopia. Biodivers J Biol Diversity. 18:1669–1679. doi:10.13057/biodiv/d180447.
- Martínez ME, Calderón C, de la Barra R, de la Fuente LF, Gonzalo C. 2011. Udder morphological traits and milk yield of chilota and suffolk down sheep breeds. Chil J Agric Res. 71:90–95. doi:10.4067/S0718-58392011000100011.
- Mckenzie-Jakes A. 2008. Getting started in the meat goat business. Reproductive management of small ruminants Volume VII.
- Merkhan KY, Alkass JE. 2011. Influence of udder and teat size on milk yield in Black and Meriz goats. Res Opinions Anim Veterinary Sci. 9:601–605.
- Mingoas KJP, Awah-Ndukum J, Dakyang H, Zoli PA. 2017. Effects of body conformation and udder morphology on milk yield of zebu cows in north region of Cameroon. Veterinary World. 10:901–905. doi:10.14202/vetworld.2017.901-905.
- Okano W, Junior CK, Bogado ALG, Negri Filho LC, Bronkhorst DE, Borges MHF, Junior FAB, dos Santos Diniz M, de Santana EHW, da Silva CB. 2015. Relationship between shape of teat and teat tip and somatic cell count (SCC) in dairy cows. Acta Scientiae Veterinariae. 43:1–6.
- Popoola MA. 2015. Zootechnical index analysis of West African Dwarf rams in southwestern Nigeria. Agricultura Tropica et Subtropica. 48:24–29. doi:10.1515/ats-2015-0004.
- Posadas MV, Corona JEB, Sahagún CAA, Gutierrez-Chavez AJ, Martinez-Jaime OA, Montaldo HH. 2017. Phenotypic correlations between milk production and conformation traits in goats. Acta Universitaria. 27:3–8.
- Putra WPB, Ilham F. 2019. Principal component analysis of body measurements and body indices and their correlation with body weight in katjang does of Indonesia. J Dairy, Veterinary Anim Res. 8:124–134. doi:10.15406/jdvar.2019.08.00254.
- Rasby R. 2011. A guide to udder and teat scoring beef cows. Angus J. 3–5.
- Rotimi EA, Momoh OM, Egahi JO, Dim NI. 2020. Multivariate principal component analysis of morphological traits in West African Dwarf goat. Fudma J Sci. 4:333–342.
- Sam I, Akpa G, Alphonsus C. 2017. Factors influencing udder and milk yield characteristics of indigenous goats in north - west Nigeria. Asian Res J Agric. 3:1–9. doi:10.9734/arja/2017/31593.
- Sebastian M, McLaren A, Mrode R, Coffey M, Rus M, Broadbent J, Conington J. 2016. Genetic aspects of conformation in dairy goats. Goat Veterinary Soc J. 32:37–43.
- Seid A, Kebede K, Effa K. 2016. Morphological characterization of indigenous goats in western Ethiopia: implication for community-based breeding programmes. Anim Genet Resour/Ressources Génétiques Anim/Recursos Genéticos Animales. 58:53–62. doi:10.1017/S2078633616000047.
- Sheriff O, Tegegne F. 2017. A review on the paradox of goat characterizations and their consequences on the development of the goat sector in Ethiopia. Livestock Res Rural Dev. 29(11).
- Tesfahun B. 2013. Phenotypic and production system characterization of Woyto Guji goats in lowland areas of South Omo zone. M.Sc. Thesis, Haramaya University, Ethiopia.
- Tilahun H, Haile A, Seid A. 2019. Phenotypic characterization of indigenous goats in north shewa zone, Amhara Region, Ethiopia. Int J Res Stud Agric Sci. 5:44–55.
- Vrdoljak J, Prpić Z, Samaržija D, Vnučec I, Konjačić M, Ugarković NK. 2020. Morfologija vimena, proizvodnja mlijeka i zdravlje mliječne žlijezde malih preživača. Mljekarstvo. 70:75–84.
- Webb EC, Casey NH, Simela L. 2011. Growth, development and growth manipulation in goats. In: Mahgoub O, Kadim I, Webb E, editors, Goat meat production and quality. London, Uk: CABI; p. 196–208.
- Zahraddeen D, Butswat I, Mbap S. 2008. Udder And teat traits As possible selection markers For milk yield In local goats Of Nigeria. Global J Agric Sci. 7:23–26. doi:10.4314/gjass.v7i1.2353.