
 ?Mathematical formulae have been encoded as MathML and are displayed in this HTML version using MathJax in order to improve their display. Uncheck the box to turn MathJax off. This feature requires Javascript. Click on a formula to zoom.
ABSTRACT
Weight prediction in live animals remains challenging. Several studies have been carried out trying to predict the body weight in livestock through morphometric measurements, the Schaeffer's model is one of them. However, the fit of those studies in small ruminants is not well covered. Therefore, a novel model to predict the weight of Pelibuey sheep through morphometric measurements and the Gray Wolf Optimizer algorithm is presented. The model involves calculating the volume of the specimen through a truncated cone and leaving density as an estimation parameter of the algorithm. Also, two alternative models were made where the original Schaeffer's model was optimized. The modified models from the original Schaeffer's formula showed improvements up to 22.61% in R-squared and decreases up to 33.48% in RMSE. However, the truncated cone model had the best estimates, with an RMSE of 2.57, R-squared of 89.02%, and the lowest AIC. This represented a 25.13% improvement in R-squared and a 38.31% reduction in the RMSE. The model is expected to improve its efficiency if the cattle sample is larger, and it is also intended to be implemented in animals of other proportions.
1. Introduction
Sheep farming is a livestock activity of great importance, such that according to the 2017 Census of Agriculture report (NASS Citation2017), the sheep market had an increase of 6.1% from 2012 to 2017. This census shows the reports every 5 years. In this context, it is very important to continue increasing production efficiency, but improvements through innovation and research are also required. For example, the study of the characteristics of the carcass allows establishing various parameters, among which the following stand out: carcass yield (Juárez et al. Citation2018; Prache et al. Citation2021), percentage of meat (Pavlov et al. Citation2018), among others. These characteristics provide information about the quality of the final product; however, to obtain this type of information, it is first necessary to sacrifice the animals, which is not always possible.
The ability to predict the final weight of the beef at slaughter and the survival rate of heifers in advance can help producers to optimize their strategies for better production (Hakem et al. Citation2022).
Therefore, it would be very useful to carry out studies aimed at predicting the composition in live animals, without the need to sacrifice them.
The concept of using body measurements of animals to estimate their weight has been applied to various livestock including cattle, buffalo, chickens, pigs, sheep, fish, horses, and rabbits (Tscharke and Banhazi Citation2013).
Among the characteristics most widely considered by many cattle weight studies are body length (BL), hip height (HH), height at withers (WH), heart girth (HG), and abdominal girth (AG) (Tebug et al. Citation2018; López-Carlos et al. Citation2010; Dohmen et al. Citation2022). This is to monitor animal performance through weight gain, to carry out research in the area and genetic improvements (Weber et al. Citation2020).
In this sense, many types of studies have been carried out trying to predict the body weight (BW) through morphometric measurements (MM) (Yan et al. Citation2009; Gurgel et al. Citation2021a Citation2021b; Iqbal et al. Citation2019), this with the aim of doing it in a faster way without the need to take the animals to a weighing area and avoid the possible stress to which they may be exposed. Correlation between ante-mortem and post-mortem parameters has also been used as a practical tool to identify animals whose carcasses are of better quality before slaughter (Assan Citation2013).
In the following research (Wangchuk et al. Citation2018) an analysis of different measurement techniques based on simple formulas that require MM is shown. The techniques consisted of Weighbridge, Weighing tape, Rondo tape, Schaeffer's formula, Agarwal's formula, and calculator method. It was concluded that Schaeffer's formula is the most reliable of all techniques to estimate live body weight of cattle, followed by the weighing tape.
The prediction of live weight of Somba cattle from linear body measurements was studied in Vanvanhossou et al. (Citation2018). They proposed different polynomial regression models, and found that the allometric regression model using only chest girth (CG) is the best for predicting weight, regardless of age and sex.
An investigation to determine if farmers adequately estimate the live weight of cattle was conducted by Machila et al. (Citation2008), since if the weight estimates are underestimated, then the drug doses administered will be insufficient when the farmers treat the animals.
Genetic and phenotypic correlations between BW and MM as cattle grow have been investigated (Kamprasert et al. Citation2019). It has been concluded that BW and MM in Brahman cattle can be genetically improved through a breeding program. Genetic correlations of up to 97% were found between BW and BL.
It is also common to find studies where artificial intelligence is used to assist decision-making in livestock farming. In order to detect more important parameters without having contact with the specimens, an artificial vision algorithm has been developed to collect body measurements of sheep efficiently and estimate the weight through different regression models (Lina Zhang et al. Citation2018). In the work (Sant'ana et al. Citation2021) a system for the prediction of the body mass of sheep through image processing and machine learning techniques is proposed. An automated computer vision system to create 3D models of Hereford cattle was designed by Ruchay et al. (Citation2020) based on RGB-D data to obtain various measurements from the body without having contact with the specimen. Errors of 3% were obtained using a 90% confidence interval with respect to manual measurements. However, the new measurement systems are expensive and it becomes difficult to acquire them in rural areas (Tebug et al. Citation2018).
Other studies proposed nonlinear models, which may result in a better prediction of BW but a wide variety of parameters to adjust are required, such as the ones in Cano et al. (Citation2015) and Maharani et al. (Citation2017), where different nonlinear equations are compared to predict weight in cattle. The nonlinear functions like Richard's, Brody's, Bertalanffy's, Gompertz's and Logistics are special cases of the four-parameter nonlinear function , where y is the observed BW (kg) at age t (day) and a, b, k, M are constants that are fixed depending on the conditions. The equations were fitted using the spline modelling and the Richard's model was found to be the best one. In Mgbere and Olutogun (Citation2002) nonlinear models were presented to estimate the weight of NDama cattle with respect to time. They showed that using nonlinear models allows to reduce the number of descriptive parameters on cattle growth.
In the previous works the importance of weight estimation in live animals is demonstrated and they show an overview of current models. However, the fit of those models in small ruminants is not well covered. Therefore, in this study a novel model for weight estimation of Pelibuey sheep through the use of MM and the Gray Wolf Optimizer (GWO) algorithm is presented. The model consisted of using certain MM, specifically those most correlated with weight, and calculating the volume of the specimen through a truncated cone and leaving density as an estimation parameter of the algorithm. Also, two alternative models were made where the original Schaeffer's model was optimized to compare the results of the truncated cone model. The number of parameters used was intended to be as few as possible to remain within the practicality of commonly used empirical models. The truncated cone model presented the lowest RMSE and a higher than the original and modified Schaeffer's models. The proposed methodology can be implemented in other existing models that estimate weight in animals of other sizes.
2. Material and methods
2.1. Data collection and experimental procedure
The animals were handled according to the regulations for ethical animal experimentation of the División Académica de Ciencias Agropecuarias of the Universidad Juárez Autónoma de Tabasco (ID project PFI: UJAT-DACA-2015-IA-02). The experiment was performed at the Southeastern Center for Ovine Integration (17N, 92
W;
). The data were collected from 56 non-pregnant and non-lactating pelibuey ewes aged from 4 to 10 months with a mean bodyweight of
. The animals for the experiment were placed in raised-slatted floor cages with a feeding group in a feedlot system. The experimental diet was a total mixed ration (80:20 concentrate to forage ratio) comprising ground maize, soybean meal, star grass hay, vitamins, and minerals premix and had a crude protein level of 16% dry matter (DM) (AFRC Citation1993).
The morphometric measurements (MM) were taken as described previously by Bautista-Díaz et al. (Citation2017): height at withers (HW), body length (BL), body diagonal length (BDL), body total length (BTL), rump height (RH), abdominal semi circumference (ASC), abdominal circumference (AC), girth semi circumference (GSC), girth circumference (GC) ( and ). All MM were recorded in centimeters. A flexible fiberglass tape was used for the measurements. For body weight (BW), a digital scale (EQB Model, Torrey®, Mexico) was used.
Figure 1. Morphometric parameters. (a) External measurements. (b) Internal measurements.
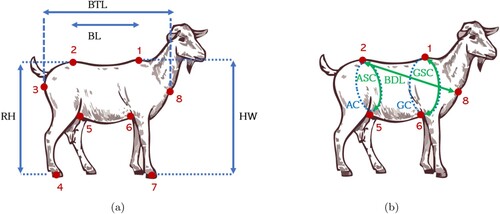
Table 1. References for morphometric measurements.
2.2. Modified formulas and the truncated cone model
Schaeffer's formula is used to estimate the body weight of cattle, and it has been shown that for cattle close to half a ton the estimates are around 5% deviation from the real weight. Using other techniques, deviations can reach up to 32%, depending on the type of cattle (Wangchuk et al. Citation2018). Previously, in the (Topai and Macit Citation2004) study, a significant correlation of 86.7% was shown between the variables Heart Girth (HG) and Body Weight (BW), although the correlation between BL and BW was 53.1%. In Wangchuk et al. (Citation2018) it was shown that Schaeffer's formula provides good estimate of body weight followed by weigh tape. Therefore, it was decided to implement this formula to calculate the weight of pelibuey-type sheep, see Equation (Equation1(1)
(1) ). Subsequently, a modified model of the latter was used that includes a coefficient for the denominator, named Schaeffer's modified 1 and can be seen in Equation (Equation2
(2)
(2) ). Another modified model is included with coefficients on the powers of the variables and named Schaeffer's modified 2, it can be seen in Equation (Equation3
(3)
(3) ).
(1)
(1)
(2)
(2)
(3)
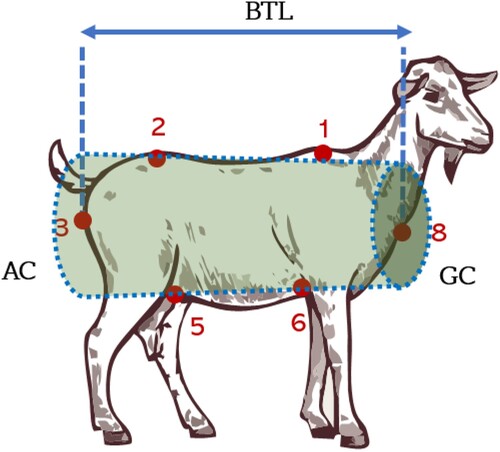
(3) Finally, the main model proposed in this research consists of using the AG, the HG and the BTL to approximate the volume with a truncated cone (), using a coefficient that approximates the density and adding a coefficient fit to the first expression. The proposed model can be seen in Equation (Equation4
(4)
(4) ), named as the truncated cone model.
Figure 2. Schematic representation of the truncated cone model.
2.3. Model fitting using the Gray Wolf Optimizer
The parameters ,
, and
are unknown value constants that allow the model to be adapted to the morphometric characteristics of the pelibueyes. Schaeffer's formula is the empirical formula analysed to compare the proposed model. Schaeffer's formula is adapted in Equations (Equation1
(1)
(1) ) – (Equation3
(3)
(3) ) with the parameters
to determine the performance of the modified formula and compare it with the model proposed in Equation (Equation4
(4)
(4) ). The model of Equation (Equation4
(4)
(4) ) based on the volume of a truncated cone also contains unknown fit parameters.
Artificial intelligence was used through a metaheuristic algorithm to find the value of these variables and obtain the best possible model. Genetic Algorithms (GA) are typically used as the standard metaheuristic algorithm. However, GA presents a high number of specific search parameters as a mutation probability or biological pressure. These parameters can condition the algorithm's performance to the correct selection of these specific search parameters. On the other hand, the Gray Wolf Optimizer (GWO) provides a metaheuristic algorithm tested in multiple fields but with the advantage of presenting only specific search parameters. This provides a simpler and faster parameter search compared to Genetic Algorithms.
The GWO is an algorithm bio inspired by how the wolf hunts, starting from an alpha wolf (best solution) and the next best solutions (beta, gamma, and omega wolves). The complete algorithm is summarized in . The search parameters required are the search agents (number of wolves), the number of iterations in the parameter search, the fitness function and the search space's limits (hunting territory). These parameters are summarized in .
Figure 3. Gray Wolf Optimizer flowchart.
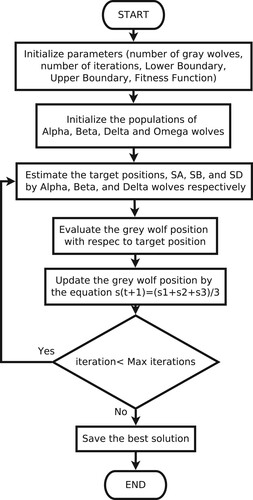
Table 2. General search parameters for Gray Wolf Optimizer.
3. Results
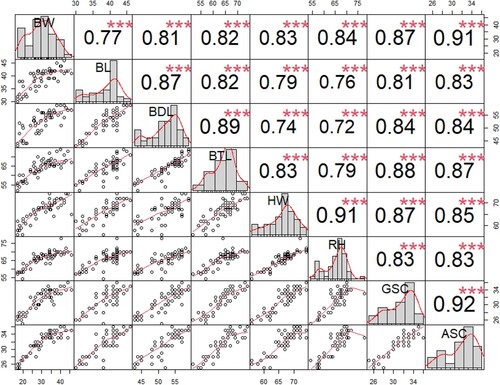
In total, seven morphometric parameters were measured and used for weight estimation. In order to summarize the correlations between the BW and MM, a correlation matrix was carried out and is depicted in through Pearson's correlation coefficient (PCC) and coefficient of determination ().
Figure 4. Correlation matrix.
Also linear regressions were performed to analyse each variable individually with BW. These results are shown in .
Table 3. Results of the linear regression for each variable related to BW.
According to , the best correlation and the lowest RMSE was shown by ASC. However, the variable with the lowest values in the same indicators was BL. The RMSE ranged from 3.23 to 4.90 while the ranged from 60.10% to 82.60%. The GSC also showed a high fit and correlation. In some investigations (Dohmen et al. Citation2022; Kamprasert et al. Citation2019; López-Carlos et al. Citation2010; Tebug et al. Citation2018) the BTL showed much higher correlations with respect to the BW, but although in these linear regressions it has not shown to be the variable with the highest correlation, it was still considered in the truncated cone model in Equation (Equation4
(4)
(4) ) since that parameter is the one defined as the height of the cone.
The results of the parameters obtained for each model with the GWO algorithm applied with the values shown in are summarized in . The estimated coefficient for the Schaeffer's modified 1 model in changed very little from the default value of 300 in the Schaeffer's original formula. Only this small change produced a significant increase in the fit for these small ruminants. In Schaeffer's modified 2 model can be seen that the coefficients of the powers change considerably with respect to the quadratic powers of the Schaeffer's original, and also the estimation of the denominator. This would magnify the contribution of the GC measurement.
Table 4. Estimated coefficients for all models.
The parameters obtained by GWO were used and evaluated in the proposed models. In total 4 statistical indicators were computed: The Root Mean Square Error (RMSE), coefficient of determination (), Akaike's Information Criteria (AIC) and Bayesian Information Criteria (BIC). The weight errors indicators for each model obtained with the estimated coefficients are shown in . However, the AIC and BIC are not usual indicators in this type of research (Dohmen et al. Citation2022). The BIC criterion was slightly higher than the models Schaeffer's modified 1 and 2 due to the fact that it penalizes the number of additional parameters in the model, but how viable it is depends on how all the evaluation parameters turn out. Globally, the truncated cone model presented the best statistical indicators. Additionally, the comparison between real and estimated weight for each sheep using the truncated cone model from Equation (Equation4
(4)
(4) ), is shown in . The truncated cone model estimated the same value of mean body weight as the real one, which was 30.3089, while the standard deviations were 7.3874 and 7.8299, respectively. The model underestimates approximately 44.6% of the data, while it overestimates the other 55.4%, see , which represents a balanced model.
Figure 5. Measured and estimated weights with the truncated cone model.
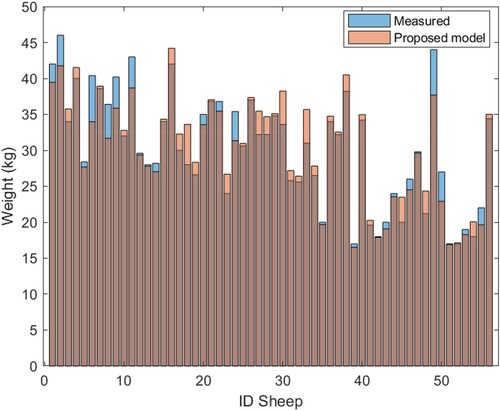
Table 5. Statistical indicators for the evaluated models.
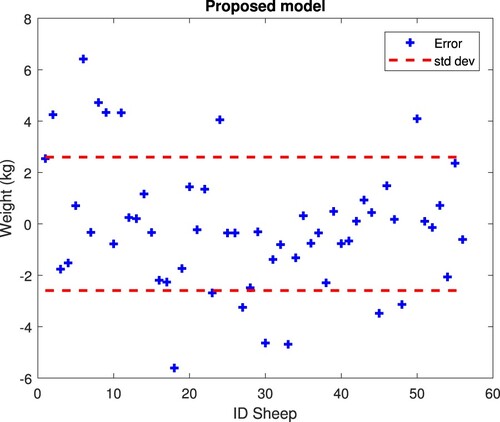
Finally, the error of the proposed model and the standard deviation of the error are evaluated and depicted in . It can be seen that 75% of the experimental data fall within the standard deviation of the error in the truncated cone model, as well as that the variability of the data is similar above and below the standard deviation lines, which may be due to the model underestimating and overestimating the weight in a balanced way.
Figure 6. Error and standard deviation with the truncated cone model.
4. Discussion
The first models (empirical formulas, tables, tapes, etc.) are calibrated for very specific cattle. However, to adjust this type of models to Pelibuey cattle samples, new approximations of the parameters are required. The application of these models in Pelibuey sheep shows considerable increases in the error. An attempt was made to adjust the formulas used in the literature, but the error was still high.
The constant of the denominator of the Schaeffer's formula is empirical, and it was decided to estimate it in case an increase in the of the model was achieved, what would produce the Schaeffer's Modified 1 model. This increase was 21.33% in
and a reduction of 31.14% in the variability of the estimates in relation to the original Schaeffer's model by simply adjusting the constant of the denominator. This means that Schaeffer's Modified 1, which is much simpler and faster to use, can serve as a good alternative for this type of cattle.
The model Schaeffer's Modified 2 showed an increase of 1.05% in the coefficient of determination and a reduction of 3.40% in the variability of the estimates with respect to Schaeffer's Modified 1.
The truncated cone model showed an increase of 2.05% in the coefficient of determination and a reduction of 7.25% in the variability of the estimates with respect to Schaeffer's Modified 2.
This means that the truncated cone model improves data prediction by 25.13% and reduces variability by 38.31% compared to the original Schaeffer's model.
Sales et al. (Citation2019) propose equations to estimate BW from body measures in the Cornigliese sheep, implementing multiple regression analysis and they do the analysis for males, females and the whole group. The best model considering the whole group obtains an of 93%, where seven different measurement variables are required, while the truncated cone model that we propose uses three measurement variables, obtaining an
of 89%.
Artificial learning techniques are progressively emerging in precision farming.
Meckbach et al. (Citation2021) used a deep neural network to calculate the weight of pigs by providing the model with standardized images of depth and the measured weight of more than 400 pigs. Weight was recorded over time, and ranged from 20 to 133 kg. Although the weight range is much higher than that evaluated in our work, the average RMSE was 3.75%, which is very close to those shown in this paper. This means that, if the sample size of this work were increased, the coefficient of determination could be closer to the 97% obtained with neural networks.
Various machine learning algorithms in Ruchay et al. (Citation2022) were used to estimate live weight of Hereford cows, and performed with a maximum of 0.713, with much larger sampling and an average weight of 521.68 kg. Although it may seem that their
is lower than that shown in our research, it must be said that they used thirteen morphometric parameters and each one with its respective variability.
It has been found that correlation between body weight of sheep at different ages increases as days increase, although there are some maternal or genetic components that maintain a high correlation with weight at early ages (Wolc et al. Citation2011). In our work this type of correlation with the time variable is not taken into account, but it is intended to add it in future works, and to consider the non-linearity of weight over time.
In another study Samperio et al. (Citation2021), a system was used to estimate the weight of lambs by capturing 3D images, and errors of less than 6% were obtained. This represents variation of the error of approximately 1.37 kg. If we consider that data from 272 lambs were used and the degree of difficulty of the methodology is greater, the approximations were lower, only 86%.
In contrast to this, shows that 75% of data enters if one standard deviation is taken, but if two standard deviations are taken, 97% of data enters.
Several regression models for different breeds of sheep are shown in the following research (Sant'ana et al. Citation2021), with variations of ranging from 0.49 using simple and multiple linear regression to 0.945 using cubic regression. In the following works (Gurgel et al. Citation2021a; Novoselec et al. Citation2020; Worku Citation2019; Kumar et al. Citation2017; Weber et al. Citation2020), the coefficients of determination closest to those shown in our research were obtained, between 0.81 and 0.92. The fit of our model is well above that shown in Sant'ana et al. (Citation2021), who had an
of 0.687 and a mean absolute error of 3.099 kg using machine learning techniques.
Now, it has been shown that even using vision techniques and machine learning, relatively low evaluation parameters can result, up to 0.747 in the coefficient of determination or around an average of 0.88 (Dohmen et al. Citation2022). It is worth mentioning that sheep were not used, if not, bovines and pigs. Many of the results shown are below the evaluation parameters in our investigation.
In a table presented in Tebug et al. (Citation2018), many different regression models to predict live weight for a group of animals and subgroups were presented. The RMSE ranged from 0.7685 to 0.9301, and the best model to predict all groups of animals had an of 0.86 and an RMSE of 32.81, which corresponds to a mean of 11.02%. The model consists of few predictor variables as in our investigation. The algorithm presented in our investigation can be used to fit the coefficients of Tebug et al. (Citation2018) and compare the results.
Although image processing of body shots and weight were well correlated at Lina Zhang et al. (Citation2018), no model exceeded 80% fit of . In this case, the partial least squares regression had the best correlation and lowest error of 0.7271 and 7.11 kg, respectively, and the support vector machine (SVM) model had 0.7938 in
and the lowest standard deviation of 5.49 kg.
In this other work (Weber et al. Citation2020), computer vision techniques and regression algorithms were used to estimate weight from images of the dorsal area of Nellore cattle. The best result of the correlation coefficient in this research was 0.75 using the bagging algorithm, and it is presumed that it could improve if height and volume are included in the experiment. Among the algorithms used, the RMSE errors ranged from 15.88 to 25.61 kg, although the weights analysed were around 500 kg, while in our investigation the average body weight was 30.31 kg. Computer vision was also used in Cominotte et al. (Citation2020), and coefficients of determination ranged from 0.63 to 0.92 at different growth phases in a herd of Nellore steers, with artificial neural network (ANN) being the best prediction. This means that the proposed model, despite not having artificial vision or measurements extracted from processed images, produces a relatively high coefficient of determination.
Some methods for estimating the weight of cattle through artificial vision have proven to be more approximate than conventional methods (Tscharke and Banhazi Citation2013), but this has caused them to stop proposing simpler and more practical models with a smaller required sample, almost zero equipment cost, and that they are used where it is not very essential to obtain deep mathematical relationships with other parameters such as growth and feeding.
It is important to understand that if you choose to use calibrated bands to estimate weight, you can fall into an overestimation or an underestimation, because the bands are calibrated for races from certain countries, and this can cause the doses of medicine or drugs supplied to the specimens vary considerably, even the estimates made by the farmers can deviate by 20% from the real weight (Machila et al. Citation2008).
5. Conclusions
In this study, a model was developed to estimate the weight of pelibuey sheep using morphometric measurements and the GWO algorithm. The model consisted of estimating the volume of the specimen through a truncated cone and leaving the density as an estimation parameter of the algorithm. Schaeffer's empirical formula was used as a reference and two other optimized models of the latter were calculated for the mentioned sheep.
Schaeffer's modified 1 and Schaeffer's modified 2 improved significantly, however, the model that predicts the best results was the truncated cone model.
The metaheuristic algorithm was always adaptable and adjustable, regardless of the weight estimation model used. The modified Schaeffer models showed a performance very similar to that of the truncated cone, although the latter model has an additional morphometric parameter (AC).
The model is expected to improve its efficiency if the pelibuey cattle sample is larger. Also, it remains to test the truncated cone model in a sample of another type of cattle, preferably with different proportions.
The capture of morphometric measurements of animals could be improved using artificial vision techniques where there is a greater background for discussion. Also, the presented prediction system can be transferred in the future to a low-cost embedded system to be implemented in farms and to be implemented in other existing models that estimate weight in animals of other sizes, as well as farmers and animal health workers can benefit from livestock live weight training and information to improve health care in low-resource rural areas. We believe that the presented models can motivate other researchers to implement metaheuristic algorithms in the solution of precision livestock problems.
Acknowledgments
This research was done with the help from the Politechnic University of Queretaro (UPQ).
Data availability statement
The data that support the findings of this study are available from the corresponding author, [ORA], upon reasonable request.
Disclosure statement
The authors declare no conflict of interest. The founders had no role in the design of the study; in the collection, analyses, or interpretation of data; in the writing of the manuscript, or in the decision to publish the results.
References
- AFRC. 1993. Agricultural Food and Research Council. Energy and Protein Requirements of Ruminants. An Advisory Manual Prepared by the Agricultural Food and Research Council Technical Committee on Responses to Nutrients. CAB International, Wallingford, UK.
- Assan N. 2013. Bioprediction of body weight and carcass parameters from morphometric measurements in livestock and poultry. Scientific Journal of Review. 2:140–150.
- Bautista-Díaz E, Salazar-Cuytun R, Chay-Canul AJ, Herrera RAG, Piñeiro-Vázquez Á.T, Monforte JGM, Tedeschi LO, Cruz-Hernández A, Gómez-Vázquez A. 2017. Determination of carcass traits in Pelibuey ewes using biometric measurements. Small Rumin Res. 147:115–119.
- Cano G, Blanco M, Casasús I, Cortés-Lacruz X, Villalba D. 2015. Comparison of B-splines and non-linear functions to describe growth patterns and predict mature weight of female beef cattle. Anim Prod Sci. 56:1787–1796.
- Cominotte A, Fernandes A, Dorea J, Rosa G, Ladeira M, van Cleef E, Pereira G, Baldassini W, Machado Neto O. 2020. Automated computer vision system to predict body weight and average daily gain in beef cattle during growing and finishing phases. Livest Sci. 232:103904.
- Dohmen R, Catal C, Liu Q. 2022. Computer vision-based weight estimation of livestock: a systematic literature review. N Z J Agric Res. 65:227–247.
- Gurgel A, Difante G, Emerenciano Neto J, Santana J, Dantas J, Roberto F, Campos N, Costa A. 2021. Use of biometrics in the prediction of body weight in crossbred lambs. Arq Bras Med Vet Zootec. 73:261–264.
- Gurgel ALC, Difante GdS, Emerenciano Neto JV, Fernandes de Araújo CG, Costa MG, Ítavo LCV, Araujo IMMd, Costa CM, Santana JCS, Ítavo CCBF, et al. 2021. Prediction of carcass traits of Santa Inês lambs finished in tropical pastures through biometric measurements. Animals. 11:2329.
- Hakem M, Boulouard Z, Kissi M. 2022. Classification of body weight in beef cattle via machine learning methods: a review. Procedia Comput Sci. 198:263–268. 12th International Conference on Emerging Ubiquitous Systems and Pervasive Networks/11th International Conference on Current and Future Trends of Information and Communication Technologies in Healthcare.
- Iqbal F, Ali M, Huma Z, Raziq A. 2019. Predicting live body weight of harnai sheep through penalized regression models. JAPS: J Anim Plant Sci. 29:1541–1548.
- Juárez M, López-Campos Ó, Roberts JC, Prieto N, Larsen IL, Uttaro B, Dugan M, Cancino-Baier D, Hosford S, Galbraith J, et al. 2018. Exploration of methods for lamb carcass yield estimation in Canada. Can J Anim Sci. 98:760–768.
- Kamprasert N, Duijvesteijn N, Van der Werf J. 2019. Estimation of genetic parameters for bw and body measurements in brahman cattle. Animal. 13:1576–1582.
- Kumar S, Dahiya S, Dahiya Z, Patil C. 2017. Prediction of body weight from linear body measurements in sheep. Indian J Anim Res. 52:1263–1266.
- Lina Zhang A, Pei Wu B, Tana Wuyun C, Xinhua Jiang D, Chuanzhong Xuan E, Yanhua Ma F. 2018. Algorithm of sheep body dimension measurement and its applications based on image analysis. Comput Electron Agric. 153:33–45.
- López-Carlos M, Ramírez R, Aguilera-Soto J, Aréchiga C, Rodríguez H. 2010. Size and shape analyses in hair sheep ram lambs and its relationships with growth performance. Livest Sci. 131:203–211.
- Machila N, Fèvre EM, Maudlin I, Eisler MC. 2008. Farmer estimation of live bodyweight of cattle: implications for veterinary drug dosing in East Africa. Prev Vet Med. 87:394–403.
- Maharani D, Amrullah AHK, Widayati DT, Sumadi S, Fathoni A, Khusnudin M. 2017. Predicting the age and weight at puberty of Ongole Grade cattle using nonlinear mathematical model in Kebumen Farmer Association. J Indones Trop Anim Agric. 42:233–239.
- Meckbach C, Tiesmeyer V, Traulsen I. 2021. A promising approach towards precise animal weight monitoring using convolutional neural networks. Comput Electron Agric. 183:106056.
- Mgbere OO, Olutogun O. 2002. A comparison of non-linear models for describing weight-age relationships in N'Dama cattle. J Appl Anim Res. 22:225–230.
- NASS U. 2017. Usda national agricultural statistics service census of agriculture 2017. Washington (DC):USDA NASS.
- Novoselec J, Gregurinčić I, Klir Željka, Mioč B, Širić I, Držaić V, Antunović Z. 2020. The estimation of body weight from body measurements of Travnik Pramenka sheep in the area of Bilogora, Croatia. J Central Eur Agric. 21:207–214.
- Pavlov AV, Rud AI, Zankevich MA. 2018. The correlation between lean meat percentage in primal cuts and total lean meat percentage in carcass. Theory Pract Meat Process. 3:33–39.
- Prache S, Schreurs N, Guillier L. 2021. Factors affecting sheep carcass and meat quality attributes. Animal. 16:100330.
- Ruchay A, Kober V, Dorofeev K, Kolpakov V, Dzhulamanov K, Kalschikov V, Guo H. 2022. Comparative analysis of machine learning algorithms for predicting live weight of hereford cows. Comput Electron Agric. 195:106837.
- Ruchay A, Kober V, Dorofeev K, Kolpakov V, Miroshnikov S. 2020. Accurate body measurement of live cattle using three depth cameras and non-rigid 3-D shape recovery. Comput Electron Agric. 179:105821.
- Sales F, Peralta OA, Narbona E, McCoard S, González-Bulnes A, Parraguez VH. 2019. Rapid communication: maternal melatonin implants improve fetal oxygen supply and body weight at term in sheep pregnancies. J Anim Sci. 97:839–845.
- Samperio E, Lidón I, Rebollar R, Castejón-Limas M, Álvarez-Aparicio C. 2021. Lambs' live weight estimation using 3D images. Animal. 15:100212.
- Sant'ana DA, Pache MCB, Martins J, Soares WP, de Melo SLN, Garcia V, de Moares Weber VA, da Silva Heimbach N, Mateus RG, Pistori H. 2021. Weighing live sheep using computer vision techniques and regression machine learning. Mach Learn Appl. 5:100076.
- Tebug SF, Missohou A, Sabi SS, Juga J, Poole EJ, Tapio M, Marshall K. 2018. Using body measurements to estimate live weight of dairy cattle in low-input systems in Senegal. J Appl Anim Res. 46:87–93.
- Topai M, Macit M. 2004. Prediction of body weight from body measurements in Morkaraman sheep. J Appl Anim Res. 25:97–100.
- Tscharke M, Banhazi T. 2013. Review of methods to determine weight and size of livestock from images. Aust J Multi-Discip Eng. 10:1–17.
- Vanvanhossou SFU, Diogo RVC, Dossa LH. 2018. Estimation of live bodyweight from linear body measurements and body condition score in the West African Savannah Shorthorn cattle in North-West Benin. Cogent Food Agric. 4:1549767.
- Wangchuk K, Wangdi J, Mindu M. 2018. Comparison and reliability of techniques to estimate live cattle body weight. J Appl Anim Res. 46:349–352.
- Weber VAdM, Weber FdL, Gomes RdC, Junior AdSO, Menezes GV, Abreu UGPd, Belete NAdS, Pistori H. 2020. Prediction of girolando cattle weight by means of body measurements extracted from images. Rev Bras Zootec. 49:e20190110.
- Weber VAM, de Lima Weber F, da Silva Oliveira A, Astolfi G, Menezes GV, de Andrade Porto JV, Rezende FPC, de Moraes PH, Matsubara ET, Mateus RG, de Araújo TLAC, da Silva LOC, de Queiroz EQA, de Abreu UGP, da Costa Gomes R, Pistori H. 2020. Cattle weight estimation using active contour models and regression trees bagging. Comput Electron Agric. 179:105804.
- Wolc A, Barczak E, Wójtowski J, Ślósarz P, Szwaczkowski T. 2011. Genetic parameters of body weight in sheep estimated via random regression and multi-trait animal models. Small Rumin Res. 100:15–18.
- Worku A. 2019. Body weight had highest correlation coefficient with heart girth around the chest under the same farmers feeding conditions for Arsi Bale sheep. Int J Agric Sci Food Technol. 5:006–012.
- Yan T, Mayne C, Patterson D, Agnew R. 2009. Prediction of body weight and empty body composition using body size measurements in lactating dairy cows. Livest Sci. 124:233–241.