
ABSTRACT
Six Holstein steers (153 kg ± 11) with cannulas in the rumen and proximal duodenum were used in a 6 × 6 Latin square design experiment to compare flake density (FD, kg/L), flake thickness (FT, mm), amyloglucosidase reactivity (AGR, % DM) and faecal starch (FS, % DM) as predictors of ruminal (RSD, %) and total tract (TSD, %) starch digestion. Dietary treatments consisted of a finishing diet containing 77% corn. The six corn processing treatments consisted of dry-rolled corn (DRC) with a density of 0.54 kg/L, and steam-flaked corn (SFC) processed to obtain densities of 0.46, 0.41, 0.36, 0.31 and 0.26 kg/L. Compared with DRC, steam flaking enhanced postruminal (34.2%, P < 0.01) and TSD (7.8%, P < 0.01). Measures of FS were the best single predictor of both ruminal (r2 = 0.97) and TSD (r2 = 0.98). Whereas AGR was a good predictor of RSD (r2 = 0.94), it was less effective than FS for estimation of TSD (r2 = 0.91). We conclude that compared with dry rolling, stream flaking markedly enhances the feeding value of corn. To evaluate the consistency of the flaking process, we recommend in addition to the determinations of FD, measurements of FT, starch enzymatic reactivity and FS are useful indicators.
KEYWORDS:
1. Introduction
Flake density (FD) is generally considered one of the most important quality control measures in the steam flaking process (Zinn et al. Citation2002; Sindt et al. Citation2006a). In commercial practice, corn is typically flaked to a bulk density of between 0.31 kg/L (24 lb/ bu) and 0.40 kg/L (31 lb/bu; Schwandt et al., Citation2006b). Optimal FD is a consideration of enhancements in ruminal and total tract digestion, flake production rate (T/h), flake durability and processing cost (Owens and Zinn Citation2005). Decreasing FD increases in a linear fashion the rate of in vitro and in vivo ruminal digestion (Zinn Citation1990a; Hales et al. Citation2010; Schwandt et al. Citation2016b), as well as postruminal and total tract starch digestion (TSD) (Zinn Citation1990a). There is an optimal FD at which starch digestion approaches 100%. Reducing FD beyond 0.36 kg/L may increase starch gelatinization, affording a more durable flake, but otherwise, may not further enhance total tract digestion, and perhaps lead to decreased feeding value (Zinn Citation1990a; Domby et al. Citation2014). Considering the wide variation in FD observed between steam flakers and feedlots, and the wide availability of analytical procedures to determine starch availability at the feed mill (Schwandt et al. Citation2016a), it is necessary to simultaneously evaluate the practicality of various measures for assessing consistency and process optimization. This study was conducted to test a wide range of corn flake densities (FD, kg/L) and associated changes in flake thickness (FT, mm), amyloglucosidase reactive starch (AGR, % DM) and faecal starch (FS, % DM) in order to further assess their comparative reliability as predictors of ruminal (RSD, %) and total TSD (%).
2. Material and methods
Dietary treatments and corn processing
Six dietary treatments consisted of a basal finishing diet containing 77% corn grain (DM basis) as dry-rolled (DR) with a density of 0.54 kg/L or 42 lb/bu (dry-rolled corn (DRC)) or steam-flaked to obtain densities of 0.46 (SFC46), 0.41 (SFC41), 0.36 (SFC36), 0.31 (SFC31) and 0.26 kg/L (36, 32, 28, 24 and 20 lb/bu).
Density measures were determined (Weight Per Bushel Tester, Mill & Elevatory Supply Co., Kansas City, MO) on processed grain obtained as it exited directly beneath the rolls. Experimental diets are shown in . Yellow corn used was a commercial blend of US #2 dent. DR corn was prepared by passing whole corn through rollers (46 × 61 cm rolls, 5.5 corrugations/cm; Memco, Mills Rolls, Mill Engineering & Machinery Co., Oklahoma, CA) that had been adjusted so that kernels were broken to a density of 0.54 kg/L. Steam-flaked corn (SFC) was prepared as follows: A chest situated directly above the rollers (46 × 61 cm rolls, 5.5 corrugations/cm; Memco, Mills Rolls, Mill Engineering & Machinery Co., Oklahoma, CA) was filled to capacity (440 kg) with whole corn and brought to a constant temperature (102°C) at atmospheric pressure using steam (boiler pressure 4.218 kg/cm2 or 0.0414 kPa). The corn was steamed for 20 min before starting the rollers, without prior tempering agent . Approximately 440 kg of the initial steam-processed grain that exited the rolls during warm-up was not fed to steers on this study. Tension of the rollers was adjusted to provide the indicated FD (0.46, 0.41, 0.36, 0.31 and 0.26 kg/L, in avoirdupois units these are 36, 32, 28, 24 and 20 pounds per bushel). Retention time of grain in the steam chamber was approximately 20 min. The SFC was allowed to air-dry (5 d) before use in diet preparation.
Table 1. Composition of diets fed for steers.
Metabolism trial
Animals and sampling
All procedures involving animal care and management were in accordance with and approved by the University of California, Davis Animal Use and Care Committee.
Six Holstein steers (153 ± 11 kg) with cannulas in the rumen and proximal duodenum (Zinn and Plascencia Citation1993) were used in a 6 × 6 Latin square experiment design to examine the effect of corn FD on site and extent of digestion. Steers were housed in individual pens (3.9 m2) in an indoor facility, with a concrete floor covered with a neoprene mat, automatic waterers and individual feed bunks. All steers received ad libitum access to the basal diet () for 14 days before the initiation of the trial. The basal diet was fed in two equal proportions at 0800 and 2000h daily. Chromic oxide (3.0 g/kg of diet air-dry basis) was used as an indigestible marker to estimate nutrient flow and digestibility. Chromic oxide was premixed with minor ingredients (urea and mineral supplement composed by limestone and trace mineral salt) before inclusion in complete mixed diets. To avoid feed refusals, DM intake was restricted to 2.25% of live weight (90% of observed DM intake during the 14-d preliminary period before start of the trial). Experimental periods consisted of 14 days, with 10 days for dietary treatment adjustment and 4 days for sample collection. During the collection period, duodenal and faecal samples were taken from all steers, twice daily as follows: d 1, 0750 and 1350 h; d 2, 0900 and 1500 h; d 3, 1050 and 1650 h; and d 4, 1200 and 1800h. Individual samples consisted of approximately 500 mL of duodenal chyme and 200 g (wet basis) of faecal material. Feed, duodenal and faecal samples from each steer and within each collection period were prepared for analysis as follows: Samples were first oven-dried at 70°C and then ground in a laboratory mill (Micro-Mill, Bell-Arts Products, Pequannock, N J). Samples were then oven-dried at 105°C until constant weight and stored in sealed glass jars.
Sample analysis and calculations
FT was determined according to Zinn (Citation1990a), and particle size distribution of DR and SF corn according to ASAE (Baker and Herman Citation2002). AGR (%) was determined according to Zinn (Citation1990a), with incubation time extended to 4 h. Enzymatic reactive starch (RS) was determined as described by Rodríguez et al. (Citation2001) as follows: (1) samples of the test grain were ground to pass through a 20 mesh screen; (2) approximately 0.15 g of the ground sample was placed in a 20 mL culture tube along with 2 stainless steel bearing (22 mm diam); (3) 20 mL of a phosphate buffer-enzyme solution (8.71 g potassium phosphate, 0.65 g sodium carbonate, 1.75 g calcium carbonate, 0.55 mg amyloglucosidase, 8 mg alpha-amylase, 8 mg pancreatin, 2 mg lytic enzyme, and 2 mg protease in 1 L water) plus a drop of toluene was added to each tube; (4) tubes were mixed and then incubated in a 39°C in a shaking water bath for 6 h; (5) tubes were removed from the water bath, 2 mL zinc sulphate was added and tubes were allowed to cool in an ice bath for 10 min before proceeding with glucose analysis (Zinn Citation1990b). Insoluble reactive starch (IRS) was calculated as: IRS = (RS − AGR)/6, where 6 represents the number of hours of the in vitro incubation. Insoluble starch digestion in the rumen (ISD, %) was calculated as: ISD = (100 − AGR) × [IRS/(IRS + 0.05)], where 0.05 is an estimate of the passage rate (fraction per hour) of grain from the rumen. Predicted ruminal starch digestion (PRSD, %) was calculated as: PRSD = 1.32 (AGR) + 0.93 (ISD)(Rodríguez et al. Citation2001).
Feed, duodenal and faecal samples were subject to the following analysis: dry matter (oven drying at 105°C until no further weight loss; method 930.15; AOAC Citation2000); chromic oxide (Hill and Anderson Citation1958) and starch (Zinn Citation1990b). The NEm value of processed corn treatments was calculated according to Zinn et al. (Citation2002): Corn NEm, Mcal/kg = −0.75 + 0.032 TSD, where TSD is the determined total TSD (%) for each treatment.
Statistical analyses
Statistical relationships (total starch digestion vs. FS; FT vs FD; FD vs. PRSD; PRSD vs. observed ruminal digestion of starch; rumen starch digestion vs FD and total starch digestion vs. FD) were determined using regression analysis (Statistix, Version 10.0, Analytical Software, Tallahassee, FL). The treatment effects on characteristics of digestion were analysed as a 6 × 6 Latin square design using the (Statistix, Version 10.0, Analytical Software, Tallahassee, FL). The fixed effect was treatment and random effects were steer and period. The statistical model for the trial was as follows:
Yijk = µ + Si + Pj + Tk + Eijk, where: Yijk is the response variable, µ is the common experimental effect, Si is the steer effect (n = 6), Pj is the period effect, Tk is the treatment effect and Eijk is the residual error. Treatments effects on digestion and fermentation variables were tested as follows: DRC vs SF corn treatments, and effect of FD (0.46, 0.41, 0.36, 0.31 and 0.26 kg/L) by means of polynomial contrasts (SAS, 2004 ). Comparisons were considered significant when the probability value was ≤0.05, and as trend when the P value was >0.05 and ≤0.10.
Results and discussion
Chemical composition of processed corn and in vitro enzymatic digestion
Characteristics of processed corn treatments are shown in . Starch concentration of SFC (77.6%) was slightly greater than the average value of 76%, and CP content was lower (8.5 vs 9.8%) than the tabular values reported by NASEM (Citation2016). White and Pollack (Citation1995) reported that measures for starch content of yellow corn range between 61 and 78%. Corn grain starch concentration is inversely with protein and oil concentration (Zinn et al. Citation2002). In vitro PRSD averaged 70.1 and 74.1% for DRC and SFC, respectively. The in vitro estimate of ruminal starch digestion (RSD) was inversely associated (PRSD = −0.3842FD + 0.8788, r2 = 0.98; ) with FD. As FD decreased from 0.46 to 0.26 kg/L, PRSD increased from 70.2 to 77.5%. It warrants noting that consistent relationships between FD and enzymatic starch digestion are more likely when measures are obtained from the same mill operation. Numerous factors affect the degree of starch disruption at the rolls for a given FD, including grain moisture, tempering, steaming time and flaker dimensions (Zinn et al. Citation2002). In a 17-feedlot survey, Schwandt (Citation2015) likewise observed linear increases in enzymatic starch availability (average 50.6%, range = 37.0–65.0%) with decreasing FD (average 0.35 kg/L, range = 0.31–0.4 kg/L). However, as their measures were taken across multiple feed mill operations, the relationship between FD and enzymatic starch availability was less closely associated (r2 = 0.31).
Figure 1. Relationship between PRSD (%) and FD (kg/L).
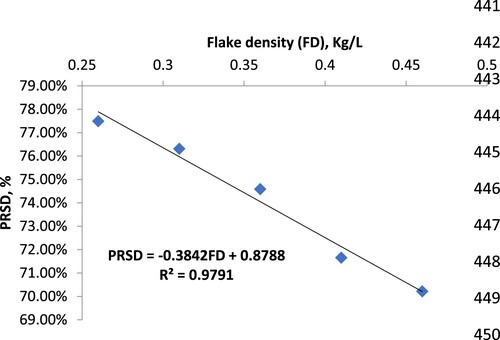
Table 2. Characteristics of processed corn.
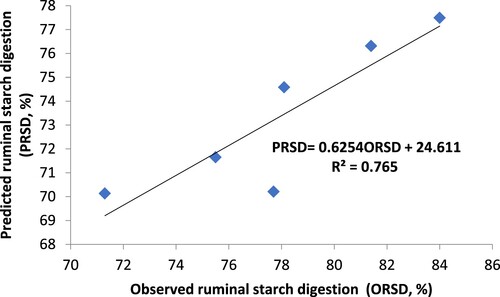
In vitro enzymatic estimates of the percentage of RSD () explained 77% (P < 0.01) of the variation () in in vivo measures. Previous studies (Rodríguez et al. Citation2001; Corona et al. Citation2006) reported that in vitro RSD explained from 78 to 90% of the variation of the in vivo RSD.
Figure 2. Relationship between the PRSD (%) and observed ruminal digestion of starch (ORSD, %).
Physical characteristics of processed corn
Consistent with previous studies (Zinn et al. Citation2002), FT (mm) was closely associated (r2 = 0.99) with FD (FD, kg/L): FD = 0.111 + 0.116 FT. Whereas by convention, FD measures must be obtained directly as grain exits the rolls, the advantage of FT is that measures may be obtained at any time or place (for example, from the feed bunk). Differences in the production of fines (in FD measures) as well as manual technique in obtaining FT measures contribute to the variation in the relationship between FD and FT (Zinn Citation1990a).
Across corn processing treatments, a major proportion of corn particles were concentrated in ranges from <16 mm to ≥4 mm (32.05 and 89.6% for DRC and SFC, respectively). Geometric mean particle size was 2981 and 5054 μm for DRC and SFC, respectively (). Values for DRC are within the ranges reported by Schwandt et al. (Citation2016b).
Table 3. Influence of processing on physical characteristics of corn.
Characteristics of ruminal, postruminal, and total tract digestion
Treatment effects on ruminal, postruminal and total TSD are shown in . Steam flaking enhanced (11.3%, P < 0.01) RSD compared with DRC. Measures of RSD obtained with cattle cannulated in duodenum, fell within the previously reported range of 80–85% for SFC (Huntington Citation1997; Zinn et al. Citation2002) and 68–76%for DRC (Zinn Citation1990b; Zinn et al. Citation1995; Corona et al. Citation2006; Plascencia and Jose Maria Citation2007). Due to the disruption of the protein matrix that envelops the starch in SFC, there is greater availability for ruminal starch fermentation (Zinn et al., Citation2002, Corona et al. Citation2006).
Table 4. Effect of corn processing on site and extent of starch digestion in cattle.
Compared with DRC, steam flaking markedly enhanced (34.2%, P < 0.01) postruminal starch digestion. This enhancement is due to processing effects on the physical properties of the grain particles entering the intestine (Theurer Citation1986; Zinn Citation1990b). Corn starch is encapsulated in a matrix of protein (89% of corn protein is found in the starch matrix; Watson Citation2003), although the protein content is higher in corn hybrids with higher protein content (Corona et al. Citation2006), that acts as a primary barrier to starch hydrolysis. Steam flaking disrupts this matrix, increases surface area for microbial or enzymatic attack together with gelatinization of the starch granules (Matsushima Citation2006) and enhances the exposure of starch to digestive processes postruminally.
Compared with DRC, steam flaking increased (7.8%, P < 0.01) total TSD. TSD for DRC was numerically greater (6%) than previously observed (Owens and Zinn Citation2005; Corona et al. Citation2006). Whereas, starch digestion measures for SFC were consistent with previous studies (Zinn et al. Citation2002; Owens and Zinn Citation2005; Corona et al. Citation2006). In a 9-trial summary, Huntington (Citation1997) observed that steam flaking increased total TSD 7.6% over that of dry rolling corn. As will be discussed later, variations in responses to steam flaking on total TSD are largely accounted for by differences in degree of processing.
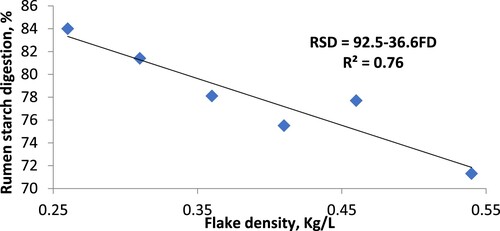
Total TSD was closely associated with FD: (TSD, %) = 96.5 + 30.2FD – 68.6FD2 (, r2 = 0.99). Likewise, RSD was a predictable function of FD: (RSD, %) = 92.5–36.6 FD (, r2 = 0.76). However, as mentioned previously, across multiple studies FD has been a less precise predictor of TSD and RSD (Zinn et al. Citation2002; 64-trial summary; total TSD, % = 107–0.256 FD; r2 = 0.57 and RSD, % = 118.9–109.3 FD; r2 = 0.22). Owens (Citation2015) observed that TSD by feedlot cattle generally exceeded 98% whenever FD was ≤0.39 kg/L. Notwithstanding, decreasing FD from 0.39 to 0.31 kg/L may further enhance ADG, feed efficiency and dietary NEm and NEg (Zinn Citation1990b; Zinn et al. Citation2002).
Figure 3. Relationship between total tract starch digestion (TSD, %) and FD (kg/L).
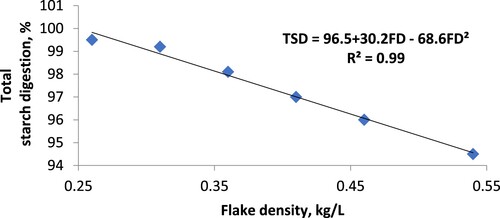
Figure 4. Relationship between RSD (%) and FD (kg/L).
There is a close association between TSD and the NE value of corn (r2 = 0.88; Zinn et al. Citation2002): NEm (Mcal/kg) = −0.75 + 0.032 TSD). Applying the above equation to the values observed in the present study, the NEm values for SFC46, SFC41, SFC36, SFC31, SFC26 and DRC are 2.31, 2.36, 2.40, 2.43, 2.44 and 2.17 Mcal/kg, respectively. Corresponding net energy for gain (NEg) values are 1.62, 1.66, 1.69, 1.73, 1.73 and 1.40 Mcal/kg, respectively. The estimated NEm represents 99, 101, 103, 104, 106 of the tabular value for SFC (NRC Citation2000), and 97% of the tabular value for DRC (NRC Citation2000). The NEm value for SFC averaged 2.39 Mcal/kg, compared with DRC, this represents an improvement of 9%. This is in close agreement with 11.1% obtained for corn with an FD of 0.34 kg/L (Zinn Citation1990b). In the present study, as FD decreased from 0.46 to 0.26 kg/L estimates of NE for SFC vs DRC was doubled (6.4–12.4%, respectively). The relative magnitude of the improvement will also depend on changes brought about through the degree of processing of DRC. Plascencia and Jose Maria (Citation2007) observed that the total TSD of DRC increased from 93.9% to 96.6% as the density of DRC decreased from 0.51 to 0.45 kg/L. Corona et al. (Citation2005) observed that whereas total TSD was greater (7%) for finely ground (mean particle size < 2 mm, 72%) vs DRC (mean particle size < 2 mm, 23%), the NE value of the corn based on growth performance was not improved (NEg averaging 1.43 and 1.4 Mcal/kg, respectively).
Consistent with previous studies (Zinn et al. Citation2007; Owens et al. Citation2016) FS (%, DM basis) was closely associated with both RSD (RSD, % = 85.9–2.88FS + 0.204FS2, r2 = 0.97) and TSD (TSD, % = 100.4–0.484FS, r2 = 0.98). Given the potential variation among feedmill operations in the relationship between FD and starch digestion, a mill might use FS to calibrate rolls for optimal FD within their operation process. Accordingly, they might adjust roll parameters noting FD when FS ranges between 2 and 3%.
FD values below 0.31 kg/L may reduce DMI, increase the variability of weight gain and predispose to acidosis and bloat (Zinn et al. Citation2002). In mill operations in USA, SFC is produced at a density between 0.31 and 0.41 kg/L (24–31 lb/bu; Owens et al., 2007). Zinn et al. (Citation1990a) observed that decreasing density from 0.42 to 0.30 kg/L increased dietary starch digestion, but did not appreciably enhance feedlot cattle growth performance. Whereas ruminal, postruminal and total TSD increased (P < 0.05; ) with decreasing FD, the magnitude of the effect was most apparent at flake densities greater than 0.31 kg/L. Hales et al. (Citation2010), evaluating the effects of SF corn density at differing dietary forage levels on the cattle performance, determined that the optimal FD was 0.335 kg/L. In consideration of the above, it is likely that the optimal corn FD is between 0.36 and 0.31 kg/L.
Conclusions
Compared with dry rolling, steam flaking markedly enhances the starch digestibility of corn. Improvements in starch digestion of flaked corn are dependent on its density and thickness. FT may be a convenient measure to evaluate the consistency in the steam flaking process. Measures of starch enzymatic reactivity and FS are also useful indicators for optimization of the steam flaking process.
Disclosure statement
No potential conflict of interest was reported by the author(s).
References
- Association of Official Analytical Chemist (AOAC). 2000. Official methods of analysis, 17th ed. Gaithersburg (MD): Association of Official Analytical Chemists.
- Baker S, Herman T. 2002. Evaluating particle size. Feed manufacturing MF-2051. Department of Grain Science and Industry. Kansas State University. Manhattan, KS, pp. 1–6. USA.
- Corona L, Owens FN, Zinn RA. 2006. Impact of corn vitreousness and processing on site and extent of digestion by feedlot cattle. J Anim Sci. 84:3020–3031.
- Corona L, Rodriguez S, Ware RA, Zinn RA. 2005. Comparative effects of whole, ground, dry-rolled and steam-flaked corn on digestion and growth performance in feedlot cattle. Prof Anim Scient. 21:200–206.
- Domby EM, Anele UY, Gautam KK, Hergenreder JE, Pepper-Yowell AR, Galyean ML. 2014. Interactive effects of bulk density of steam-flaked corn and concentration of sweet bran on feedlot cattle performance, carcass characteristics, and apparent total tract nutrient digestibility. J Anim Sci. 92:1133–1143.
- Hales KE, Cole NA, Galyean ML, Leytem AB. 2010. Nutrient concentrations and proportions in particle size fractions of corn steam flaked to different bulk densities. Prof Anim Scient. 26:511–519.
- Hill FW, Anderson DL. 1958. Comparison of metabolizables energy and productive energy determinations with growing chicks. J Nutr. 64:587–603.
- Huntington GB. 1997. Starch utilization by ruminants: basics to the bunk. J Anim Sci. 75:852.
- Matsushima JK. 2006. History of feed processing. Cattle grain processing symposium. Oklahoma State University. p. 1–16.
- National Academies of Science, Engineering, and Medicine (NASEM). 2016. Nutrient requirements of beef cattle. Eighth revised edition. Washington (DC): The National Academies Press. Doi: 10.17226/19014.
- National Research Council (NRC). 2000. Nutrient requirements of beef cattle. 7th rev. ed. Washington (DC): Natl. Acad. Press.
- Owens FN, Secrist DS, Hill WF, Gill DR. 1997. The effect of grain source and grain processing on performance of feedlot cattle: A review. Journal of Animal Science. 75:868–879.
- Owens CE, Zinn RA, Hassen A, Owens FN. 2016. Mathematical linkage of total-tract digestion of starch and neutral detergent fiber to their fecal concentrations and effect of site of starch digestion on extent of digestion and energetic efficiency of cattle. Prof Anim Scient. 32:531–549.
- Owens FN. 2015. Optimization of feedlot diets with high energy density on energy and nutrients. II symposium international of feedlot prod. University of Porto, Alegre, Brazil.
- Owens FN, Zinn RA. 2005. Corn grain for cattle: influence of processing on site and extent of digestion. Proc. 19th southwest nutrition conference, Phoenix, Arizona. p.86 - 112
- Plascencia A, Jose Maria AV. 2007. Influence of cracked, coarse grind, or fine grind of corn on digestion and rumen function in steers fed a 73% corn-based diet. J Anim Veterinary Adv. 6:118–122.
- Rodríguez S, Calderón J F, Zinn RA. 2001. Variation in ruminal starch digestion due to dry rolling versus steam flaking corn and sorghum can be reliably predicted based on changes in starch solubility and 6-h amylase reactive insoluble starch. Proceedings western section. American Society of Animal Science. 52:529–530.
- Schwandt EF. 2015. Grain processing considerations influencing starch digestion and performance of feed cattle [PhD thesis dissertation. Manhattan (KS). Kansas State University. Accessed March 29, 2020. http://krex.k-state.edu/dspace/bitstream/handle/2097/20571/ErinSchwandt2015.pdf?sequence=1
- Schwandt EF, Hubbert ME, Thomson DU, Vahl CI, Bartle SJ, Reinhardt CD. 2016a. A survey of starch availability of steam-flaked corn in commercial feedlots evaluating roll size and flaked density. Prof Anim Scient. 32:550–560.
- Schwandt EF, Wagner JJ, Engle TE, Bartle SJ, Thomson DU, Reinhardt CD. 2016b. The effects of dry-rolled corn particle size on performance, carcass traits, and starch digestibility in feedlot finishing diets containing wet distiller’s grains. J Anim Sci. 94:1194–1202.
- Sindt JJ, Drouillar JS, Montgomery SP, Loe ER. 2006a. Factor influencing characteristics of steam-flaked corn and utilization by finishing cattle. J Anim Sci. 84:154–161.
- Sindt JJ, Drouillard JS, Titgemeyer EC, Montgomery SP, Loe ER, Depenbusch BE, Walz PH. 2006b. Influence of steam-flaked corn moisture level and density on journal of animal science. the site and extent of digestibility and feeding value for finishing cattle. J. Anim. Sci. 84:424–432.
- Theurer CB. 1986. Grain processing effects on starch utilization by ruminants. J Anim Sci. 63:1649–1662.
- Watson SA. 2003. Description, development, structure and composition of the corn kernel. Page 59 in corn chemistry and technology. 2nd ed. PJ White and LA Johnson, ed. American Association of Cereal Chemists. St. Paul (MN).
- White PJ, Pollack LM. 1995. Corn as a food source in the United States; part II. Processes, products, composition, and nutritive values. Cereal Foods World. 40:756–762.
- Zinn RA. 1990a. Influence of flake density on the comparative feeding value of steam-flaked corn for feedlot cattle. J Anim Sci. 68:767–775.
- Zinn RA. 1990b. Influence of steaming time on site digestion of flaked corn in steers. J Anim Sci. 68:776–781.
- Zinn RA, Adam CF, Tamayo MS. 1995. Interaction of feed intake level on comparative ruminal and total tract digestion of dry-rolled and steam-flaked corn. J Anim Sci. 73:1239–1245.
- Zinn RA, Barreras A, Corona L, Owens FN, Ware RA. 2007. Starch digestion by feedlot cattle: predictions from analysis of feed and fecal starch and nitrogen. J Anim Sci. 85:1727–1730.
- Zinn RA, Owens FN, Ware RA. 2002. Flaking corn: processing mechanism, quality standards and impacts on energy availability and performance of feedlot cattle. J Anim Sci. 80:1145–1156.
- Zinn RA, Plascencia A. 1993. Interaction of whole cottonseed and supplemental fat on digestive function in cattle. J Anim Sci. 71:11–17.