
 ?Mathematical formulae have been encoded as MathML and are displayed in this HTML version using MathJax in order to improve their display. Uncheck the box to turn MathJax off. This feature requires Javascript. Click on a formula to zoom.
ABSTRACT
The present investigation was undertaken to explain the association of SNPs (single nucleotide polymorphisms) in exon 6 and 3′-UTR of OLR 1 gene with milk traits in Sahiwal cattle. Milk traits were observed from 328 Sahiwal cows sired by 64 bulls viz: – First lactation 305 days milk yield (Kg) (FL305MY), Average test day milk yield (Kg) (ATDMY), Average test day fat percentage (%) (ATDFP) and Lactational fat yield (Kg) (LFY). The animal model was used to estimate the breeding values for FL305MY and LFY. The traits ATDMY and ATDFP were corrected for significant non-genetic factors by using LSML-Harvey and subsequently used for association studies. A total of 130 animals for PCR-RFLP and 103 for sequencing were screened through three sets of primers for the presence of polymorphisms in exon 6 and 3′-UTR of the OLR1 gene. The CC genotype of SNP C337A in the 3′-UTR of OLR1 gene had a significant effect (p < 0.01) on ATDFP and LFY. Allele combination CGC had a positive effect (p < 0.05) on ATDFP. Identified SNP C337A and CCGGCC haplotype can be used as potential markers for improving milk yield and composition traits in Sahiwal cattle.
Introduction
Sahiwal is one of the best dairy breeds of indigenous cattle with its breeding tract in the Montgomery district of Pakistan. In India Karan-Swiss and Frieswal strains have been developed by crossing Sahiwal breed with exotic breeds like Brown Swiss and Holstein-Frisian. Considering its elite performance for various donor traits, the National Agricultural Commission (Citation1976) recommended improving the Sahiwal breed. Sahiwal is one of the few breeds, which FAO has undertaken improvement (FAO, Citation1983). The elite Sahiwal cattle is famous for its higher milk production, remarkable power of endurance in the hot climate of the tropics, resistance to tropical diseases, low maintenance cost and high feed conversion efficiency (Ilatsia et al., Citation2012). Improving the production potential of our native livestock is paramount to meeting the continued demand for dairy products, which in turn provide better economic sustainability, nutritional security and livelihood for marginal and small farmers of the region. Milk production traits in dairy cattle are influenced by many quantitative trait loci (QTLs) and environmental factors. For dairy cattle since Georges et al. (Citation1995) reported a QTL mapping study on milk yield characteristics, more than 1350 QTL for traits related to milk production have been reported (https://www.animalgenome.org/cgi-bin/QTLdb/BT/index accessed on 1 October 2020; Kim et al., Citation2021). Identifying, detecting and validating major genes/QTLs are critical for improving milk production in dairy cattle breeding (Ogorevc et al., Citation2009).
One of the most important candidate genes is the oxidized low-density lipoprotein receptor 1 gene (OLR1) located on chromosome 3 in sheep and consists of 6 exons (Adopted from ncbi.nlm.nih.gov). Based on combined data from different cattle maps, the gene has been estimated to be located in the interval of 106–108 cM of the bovine chromosome 5 and it consists of six exons that encode a 270-amino acid protein (Khatib et al., Citation2006; Mohammed et al., Citation2021). The OLR1 gene codes for a vascular endothelial cell-surface receptor that binds to and degrades oxidized low-density lipoproteins (Metha and Li, Citation2002). Internalization of ox-LDL (oxidized-low density lipoprotein) triggers a chain of events that might contribute to endothelial dysfunction and atherosclerosis (Dunn et al., Citation2008). Oxidized lipids have also been reported to affect lipid metabolism and impair glucose metabolism in the liver and mammary glands (Ringseis et al., Citation2007; Liao et al., Citation2008). Several groups investigated and reported the effect of OLR1-related quantitative trait loci (QTL) on milk production characteristics (Olsen et al., Citation2002; Rodriguez-Zas et al., Citation2002; Viitala et al., Citation2003; Ashwell et al., Citation2004). OLR1 has been proposed as a potential candidate gene influencing milk production characteristics in dairy cattle due to its role in lipid metabolism and ox-LDL degradation (Khatib et al., Citation2006). It has been reported that SNP 8,232 in the 3′-UTR of exon 6 of the OLR1 gene is associated with milk fat yield and percentage (Khatib et al., Citation2006; Khatib et al., Citation2007; Schennink et al., Citation2009; Soltani-Ghombavan et al., Citation2013). Considering the above-reported associations and to provide a better estimation of the impact and size of the association of the OLR1 gene with production traits, there is a need to validate its genomic association with the first lactation traits, viz: – First lactation 305 days milk yield kg (FL305MY), Average test day milk yield kg (ATDMY), Average test day fat percentage % (ATDFP) and Lactation fat yield kg (LFY) in the Sahiwal cattle population. Consequently, this study was designed to detect the polymorphisms within the Bos Indicus OLR1 gene exon 6 and 3′-UTR region and their association with milk production traits in Sahiwal cattle.
Materials and methods
Experimental animals and type of feeding
The experimental animals for the present study were taken from the herd of Sahiwal cattle maintained at Livestock Research Centre (LRC), ICAR-National Dairy Research Institute, Karnal. One hundred thirty animals were used to screen for polymorphisms in exon 6 and 3′-UTR of the OLR1 gene. Only 103 samples were used for genotyping of animals by sequencing. The Sahiwal cows received green maize and wheat straw in the hot/humid season and berseem with green oat fodder in the winter season. The concentrate, which consisted of 20% CP and 70% TDN was fed 1.5 kg/day/Sahiwal for body maintenance. The dry pregnant cows were provided additional concentrate 1.5 kg/cow before 21 days of the expected calving date, and milking cows were provided additional concentrate 1 kg/3 kg milk production. The concentrate mixture consisted of 33% maize, 21% ground nut cake, 12% mustered cake, 20% wheat bran, 11% de-oiled rice bran, 2% mineral mixture and 1% common salt. The concentrate mixture was given as per National Research Council (2001) recommendations.
Phenotype data
The phenotypic data on diverse milk attributes in the present investigation has been generated from the first lactation production records of 328 Sahiwal cows sired by 64 bulls collected from Record Cell, Animal Genetics and Breeding Division of ICAR-National Dairy Research Institute, Karnal.
Milk sampling and analysis
Milk samples for milk composition analysis were recorded as first lactation 305 days milk yield at an interval of 6th, 35th, 65th, 95th, 125th, 155th, 215th, 245th and 275th days of lactation. Samples were collected from 3 consecutive milkings (morning, noon, and evening) mixed in proportion to obtain a composite sample. The milk fat% was estimated using a Mega Lactoscan analyzer. The milk samples were maintained at 28-32°C at the time of analysis, which is the calibration temperature of the analyzer. Records of animals with a lactation length of less than 100 days and milk production in a lactation of less than 500 kg were excluded from the study.
Traits
The data on the following parameters were recorded and used for the generation of the traits viz.
Age at first calving (days) - AFC
First lactation 305 days milk yield(kg) – FL305MY
Average test day milk yield (Kg) - ATDMY
Average test day fat percentage (%) - ATDFP
Average test day fat yield (kg) - ATDFY
Lactation fat yield (kg) - LFY
Average test day milk yield (kg):
Average test day fat percentage (%):
Average test day fat yield (kg)
Lactation fat yield (kg)
Classification of data
The data were classified into nine periods of calving, four seasons of calving (Winter, Summer, Rainy and Autumn) based on the type of feed and fodder availability on the farm and prevailing climatic conditions in the region as recorded in ICAR-CSSRI, Karnal (Singh, Citation1983) and three age groups based on age at first calving (days) AFC, viz:- ≤ 1020, 1021-1110, 1111–1200 and ≥1200 based on Sturges rule (Sturges, Citation1926).
Molecular analysis
Genomic DNA preparation
As described by Sambrook and Russell (Citation2001), the phenol–chloroform method was used to isolate DNA from samples with minor modifications (extra washing step using ethanol and DNA is stored in milliQ water). Ten ml of venous blood was collected from the jugular vein of each milch animal under sterile conditions in a 15 ml polypropylene centrifuge tube containing 0.5 ml of 0.5 M EDTA solution after obtaining permission from the Institute Animal Ethics Committee. The tubes were kept in the refrigerator at – 20°C until DNA isolation was completed. The overall yield of DNA in Sahiwal cattle ranged from 350 - 510 μg with a mean of 414.64 ± 4.87 μg/ml and the overall purity of DNA (OD260/280) ranged from 1.70 - 1.90 with a mean of 1.80 ± 0.01.
PCR amplification and RFLP analysis
Primer designing
A detailed sequence of primers used in the present study and their characteristic nucleotide numbers, annealing temperatures/time, and amplicon size are presented in . PCR reaction was performed in a final volume of 25 μl containing 100 ng of template DNA, 10 pmol of each primer, 10X PCR buffer (20 mM Tris-HCL pH 8.4, 50 mM KCl), 1 mM MgCl2, 2.0 mM of dNTPs and 1 μl of Taq DNA polymerase (M/s Genetix Biotech Asia Pvt. Ltd). This solution was initially denatured at 95°C for 5 min, followed by 35 cycles of denaturation (95°C for 1 min), annealing (55.1, 59.3 and 58.7°C for 30 secs), elongation (72°C for 1 min), and a final extension at 72°C for 5 min. The amplified products were detected in 1.5% Agarose gel electrophoresis, and the resolutions visualized in the gel are depicted in . About 10 μl of amplified product was digested with 10 units of pst I enzyme ‘for 14 h’ at 37°C in a water bath. The digested products were detected by electrophoresis in 2% Agarose gel in 1X TBE buffer and ethidium bromide (10 mg/μl)(Al-Thuwaini, Citation2020).
Figure 1. Resolution of PCR products of OLR1 gene.
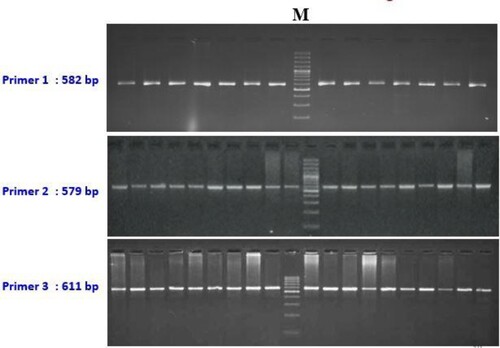
Table 1. Sequence of the primers designed, Annealing temperature and time for amplification of exon 6 OLR1 gene in Sahiwal cattle.
DNA sequencing and protein sequence analysis
PCR-RFLP by Pst1 restriction enzyme was used for genotyping of animals by Primer 1 using (Fermentas). Custom sequencing was performed on both ends (5’ and 3′) of amplified PCR products for Primers 2 and 3. BioEdit software (URL: http://www.mbio.ncsu.edu/BioEdit/bioedit.html.) was used to visualize and edit nucleotide sequences. ClustalW software (URL: http://www.ebi.ac.uk/Tools/msa/clustalo/) was used to identify SNPs by performing multiple sequence alignments of the edited sequence with corresponding reference sequences (Al-Thuwaini, Citation2021). The ExPASy Translate tool was used to convert nucleotide sequences to amino acids, edited and aligned with the reference OLR1 protein sequence of Bos taurus (Gasteiger et al., Citation2003). SIFT software (http://sift-dna.org) was used to examine amino acid substitutions (Sim et al., Citation2012).
Statistical analysis
Non-genetic factors
The normalized production traits were adjusted for significant non-genetic factors by least-squares analysis using the following model (Harvey, Citation1990). The model used was Yijkl = µ + Pi + Sj + (AG)k + eijkl.
where, Yijkl = Observation on lthcow in kthage group of first calving, calved in jthseason and ithperiod of calving, μ = Overall mean, Pi = Fixed effect of ith period of calving (1–9), Sj = Fixed effect of jth season of calving (1–4), (AG)k = Fixed effect of kth age group of animals at first calving (1–4) and eijkl = Random error ∼ NID (0, σ2e). The difference of means between any two subclasses of period, season, and age group was tested for significance using Duncan's Multiple Range Test (DMRT) as modified by Kramer (Citation1957).
Breeding value
The single trait animal model was adopted for estimation of breeding values through WOMBAT software (Meyer, Citation2007) with the following observed model parameterization:
where,
= kth observation of jth random effect and ith fixed effect,
= Vector of observation of fixed effects (period of calving, season of calving & age groups (AFC)),
= Vector of additive genetic effect (Random animal effect),
= Design matrix/ Incidence matrix of fixed effect,
= Design matrix/ Incidence matrix of random effect and
= Vector of residual errors with E (y) = Xb.
Association studies
General Linear Model as described in R package was used to determine the effect of genotype on the individual trait. Yij = µ +Gi + eij, where, Yij = Breeding value/Least square means of jth trait of ithgenotype, µ = Overall mean, Gi = Fixed effect of ith genotype of SNPs/Haplotype and eijk = Random error ∼ NID (0, σ2e). The population was in Hardy Weinberg equilibrium for allele and genotype frequencies as analyzed by Chi-square test using Popgene software (Yeh et al., Citation1999). The allele substitution effect at each SNP was estimated using the following linear regression model in R software. Yij = µ + βxi + eij, where, Yij = Breeding value/Least square means of jth trait of ith SNP/Haplotype, µ = Overall mean, β = is the regression coefficient representing half of the allele substitution effect (α/2), xi is the effect of ith SNP/Haplotype and eijk = Random error ∼ NID (0, σ2e).
Results
Average of the traits
The average first lactation 305 days or less milk yield, Average test day milk yield, Average test day fat percentage and Lactational fat yield were estimated as 1816.56 ± 40.79 kg, 6.61 ± 0.11 kg, 4.76 ± 0.02% and 84.68 ± 2.00 kg with the coefficient of variation as 29.50%, 37.98%, 4.99% and 39.81% respectively. The period of calving had a significant effect (p < 0.01) whereas, Season of calving and age group at first calving had no significant on FL305MY, ATDMY, ATDFP and LFY.
Clustal W and sequencing
Comparative analysis about nucleotide sequences of exon 6 region of the Sahiwal cattle of OLR1 gene with that of the reference sequence of Bos taurus by ClustalW2 multiple alignments tool revealed a total of 8 mutations that include 5 transitions and 3 transversions. The base configuration of 8 SNPs was found at positions T96C, C155T, A165G, G179A, C265T, T294G, and G392T (Primer 2) C337A (Primer 1) as compared to Bos taurus (Ref. Seq. ENSBTAG00000004547) (). Primer 3 revealed a monomorphic pattern. These polymorphic positions are depicted by representative chromatograms exhibiting base change as compared to the reference sequence of the OLR1 gene in Bos taurus (). The coding sequences were translated into amino acid sequences by using the ExPAsy translation tool and then subsequent multiple sequence alignment was performed with the corresponding Bos taurus sequence which revealed no amino acid change. The genotypic and allelic frequencies of the polymorphic loci are presented in .
Figure 2. Chromatogram and clustalw alignment showing variation at position 96 by primer 2 (T > C) of OLR1 gene in Sahiwal cattle.
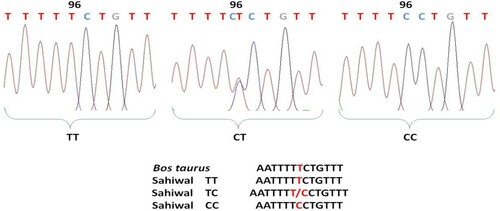
Figure 3. Chromatogram and clustalw alignment showing variation at position 155 by primer 2 (C > T) of OLR1 gene in Sahiwal cattle.
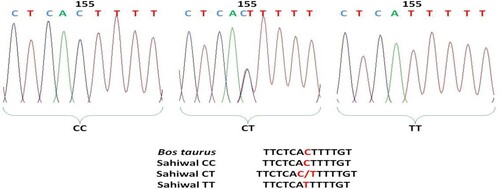
Figure 4. Chromatogram and clustalw alignment showing variation at position 165 by primer 2 (A > G) of OLR1 gene in Sahiwal cattle.
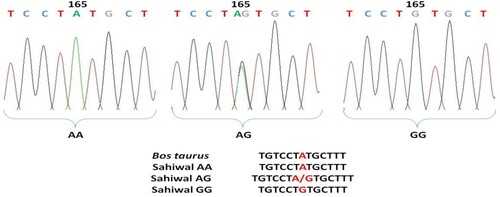
Figure 5. Chromatogram and clustalw alignment showing variation at position 179 by primer 2 (G > A) of OLR1 gene in Sahiwal cattle.
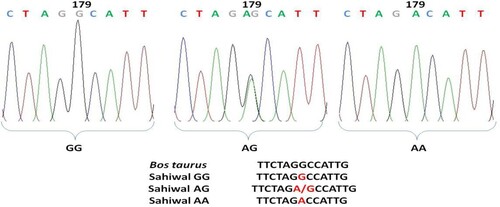
Figure 6. Chromatogram and clustalw alignment showing variation at position 265 by primer 2 (C > T) of OLR1 gene in Sahiwal cattle.
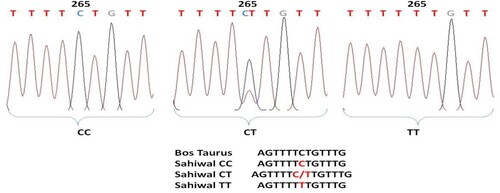
Figure 7. Chromatogram and clustalw alignment showing variation at position 294 by primer 2 (T > G) of OLR1 gene in Sahiwal cattle.
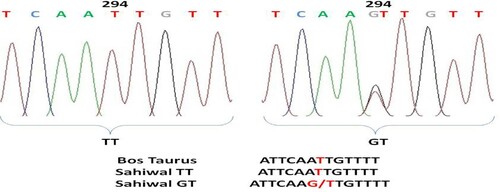
Figure 8. Chromatogram and clustalw alignment showing variation at position 392 by primer 2 (G > T) of OLR1 gene in Sahiwal cattle.
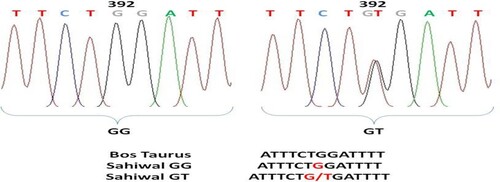
Table 2. Summary of nucleotide changes in OLR1 gene in Sahiwal cattle as compared to Bos taurus (Ensembl Gene ID ENSBTAG00000004547).
Table 3. Genotypic and allelic frequencies of OLR1 gene using sequencing and PCR – RFLP in Sahiwal cattle.
PCR-RFLP analysis of exon 6 amplified by primer 1 was carried out using the Pst1 restriction enzyme. Pst1-RFLP for exon 6 revealed three polymorphic patterns, AA (582 bp), AC (582 , 337 and 245 bp) and CC (337 and 245 bp) (). Genotypic frequencies of AA, AC, and CC were 0.03, 0.29, and 0.68 respectively. The allelic frequencies for A and C were 0.175 and 0.825, respectively. Post-Hoc Tukey's association testing for the difference of means among the genotypes concerning polymorphic loci revealed that P1 337(C < A) had a highly significant effect on ATDFP (p < 0.01). Genotypes of other polymorphic loci () revealed a significant effect on this trait at (p < 0.05) level of significance which includes P2-96, P2-155, P2-165, P2-179 and P2-265. However other identified mutational changes exhibited no significance on this trait. Similarly, the P1-337 locus significantly affected the LYF trait (p < 0.01). All other polymorphic loci revealed no significant or positive effect on the LYF trait. The population under study was in Hardy-Weinberg equilibrium.
Figure 9. PCR-RFLP pattern at loci 337(C > A) of OLR1 gene amplified by Primer 1 and digested by pst1 enzyme.
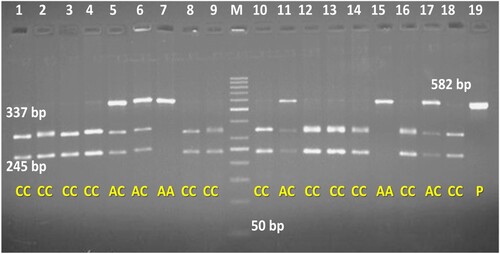
Table 4. Effect of polymorphism of OLR1 gene on average test day milk yield/ fat percentage and breeding value for the first lactation 305 days milk yield and lactational fat yield in different genotypes.
Seven SNPs and 1 RFLP marker were evaluated for the linkage disequilibrium test under haploview software. This analysis revealed two types of allele combinations CGC and TAT in the Sahiwal cattle population. The CCGGCC haplotype had a significant influence on ATDFP (). Haplotype inferences were taken from homozygous genotypes only as alleles in the heterozygous genotypes could not be traced back to the respective sire and dam families. The haplotype frequencies of the OLR1 gene are presented in ().
Table 5. Effect of haplotypes of OLR1 gene on average test day milk yield/ fat percentage and breeding value for the first lactation 305 days milk yield and lactational fat yield in different genotypes.
Table 6. Allele frequencies of OLR1 gene in Sahiwal cattle.
Discussion
Post-Hoc Tukey's association testing for identified SNPs concerning different polymorphic loci of the OLR1 gene is presented in . The general observations revealed that fewer SNPs had a positive and highly significant effect on the milk attributes. Khatib et al. (Citation2006), Komisarek & Dorynek (Citation2009), Wang et al. (Citation2012), and SoltaniGhombavani et al. (Citation2013) reported frequencies of 0.46, 0.43, 0.42, and 0.157 respectively for the A allele and 0.54, 0.57, 0.58, and 0.483 for the C allele, in the American-Polish, Czech Fleckvieh, Israeli Holstein and Iranian HF population. Our study showed a higher frequency of 0.825 for allele C and a lower frequency of 0.175 for allele A, consistent with Schennink et al. (Citation2009), who reported a frequency of 0.29 and 0.71 for alleles A and C in the Dutch Holstein population.
The genotype frequencies of AA, AC, and CC were found to be 0.03, 0.29, and 0.68, respectively, with the CC genotype being the most abundant. In the Israeli and Iranian Holstein populations, Wang et al. (Citation2012) and Soltani-Ghombavani et al. (Citation2013) found genotype frequencies of 13, 58, 29 percent and 28.9, 45.6, 25.5 percent for AA, AC, and CC, respectively. Komisarek and Dorynek (Citation2009) found the most common variant to be AC (51.66 percent) in Polish Holsteins, whereas Schennink et al. (Citation2009) found the most common genotype to be CC in the Dutch Holstein population.
The SNP C337A corresponded to three genotypes among which the CC genotype had a positive effect (p < 0.01) on ATDFP and was consistent with Khatib et al. (Citation2006) in North American Holstein cattle, Soltani-Ghombavani et al. (Citation2013) in Iranian HF, Komisarek, and Dorvnek (Citation2009) in HF polish bulls, Schennink et al. (Citation2009) in Dutch HF, Mashhadi et al. (Citation2014) in Iranian HF. Ates et al. (Citation2014) reported a significant effect of g.223 C > A, g.8232 C > A, allele C and g.8232 C > A on fat percentage in Turkey cow SAR and EAR. Association of SNP C337A with LFY(p < 0.01) was inconsistent with Khatib et al. (Citation2006) in North American Holstein cattle. In contrast, Komisarek and Dorynek (Citation2009) and Schennink et al. (Citation2009) did not find any association in their studies. Ardicli et al. (Citation2018) and Rychtarova et al. (Citation2014) observed no association between marker C223A and milk yield or composition traits in the Czech Fleckvieh and Holstein-Fresian cows, respectively. The genotypes corresponding to SNPs T96C, C155T, A165G, G179A, and C265T in the 3′-UTR region of exon-6 of the OLR1 gene had a significant effect (p < 0.05) on ATDFP. Milk production and composition traits in Sahiwal cattle were unaffected by genotypes at the remaining locus. In the Sahiwal population, the haplotype CGC had a significant (p < 0.05) influence on the average test day fat percentage (). The CCGGCC haplotype had a mean of 5.05 ± 0.12 for ATDFP with a frequency of 10% in the population, whereas the TTAATT haplotype had a frequency of 90% (). Khatib et al. (Citation2006) identified 4 intragenic haplotypes with haplotype 2 associated with a significant increase in fat yield and percentage in the cooperative dairy DNA repository (CDDR) Holstein population. The allele substitution effect of OLR1 variants on the milk traits was in conformity with the genotypic effects, further validating our findings (). The allele substitution effect at locus C337A was positive and significant on ATDFP by 0.030%, LFY by 2.275%, with a decrease of – 0.007% in ATDMY. Allele substitution effect at T96C had a negative effect on ATDFP by – 0.170% whereas at loci C155T, A165G and G179A had a positive and significant effects by 0.238%, 0.142% and 0.138%.
Figure 10. Linkage disequilibrium blocks with LD values (R-squared) along with corresponding haplotypes of OLR1 gene.
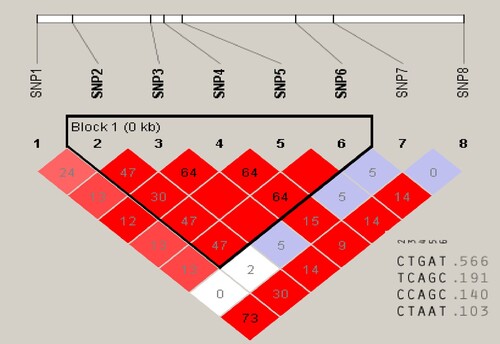
Table 7. Estimates of the allele substitution effect of OLR1 SNPs and Haplotypes.
The relationship between the C allele and increased milk fat may be due to linkage disequilibrium with a functional polymorphism site in the OLR1 gene or another closely related gene that influences OLR1 expression. This is supported by the fact that OLR1 expression was more significant in CC cows than in AA cows (Khatib et al. Citation2006). OLR1 removes ox-LDL from the circulation, thereby decreasing its negative effects on insulin production and signalling. The involvement of insulin in modulating lipoprotein lipase activity and mRNA in the mammary glands of nursing mice has been found (Jensen et al. Citation1994). Iverson et al. (Citation1995) reported a link between lipoprotein lipase activity and high milk fat during lactation in grey seals. Such a link might exist in the bovine mammary gland. Oxidized fat inhibited gene expression of lipoprotein lipase and fatty acid transporters in the mammary glands of rats, resulting in low milk triacylglycerol concentrations (Ringseis et al. Citation2007). As an oxidized fat, ox-LDL may decrease milk fat in the same way in the bovine mammary gland. More OLR1 gene expression and elimination of ox-LDL from the blood can explain the link between the C allele and more significant milk fat.
Conclusion
Milk and its products are the most important nutritional resource in meeting energy requirements, offering high-quality protein and various vitamins and minerals. Detecting genetic variants and their association with milk traits are essential for a better understanding of quantitative traits and genetic improvement of Sahiwal cattle for improved production and productivity. The present results confirmed previous investigations of SNP 8,232 in the 3′-UTR of exon 6 in the OLR1 gene. This work also found that other locis T96C, C155T, A165G, G179A, and C265T in the 3′-UTR region of exon 6 influenced ATDFP. The effects of allele substitution further validated our findings.
Moreover, we performed a linkage disequilibrium analysis resulting in a significant association of CCGGCC haplotype with average test day fat percentage. The association results reveal important information with potential in selection programmes for dairy cattle through Marker Assisted Selection. Further investigations are needed to confirm or refute the results and find mechanisms underlying the association found in this study.
Acknowledgments
The authors are indebted to the Director and Vice-Chancellor, ICAR-NDRI, Karnal, Haryana for providing the infrastructure facilities that enabled the successful completion of the project.
Disclosure statement
No potential conflict of interest was reported by the author(s).
References
- Al-Thuwaini T. 2020. Association between polymorphism in BMP15 and GDF9 genes and impairing female fecundity in diabetes type 2. Middle East Fertil Soc J. 25(1):1–10. doi:10.1186/s43043-020-00032-5.
- Al-Thuwaini TM. 2021. Novel single nucleotide polymorphism in the prolactin gene of awassi ewes and its role in the reproductive traits. Iraqi J Veterinary Sci. 35(3):429–435. doi:10.33899/ijvs.2020.126973.1423.
- Ardicli S, Soyudal B, Samli H, Dincel D, Balci F. 2018. Effect of STAT1, OLR1, CSN1S1, CSN1S2, and DGAT1 genes on milk yield and composition traits of Holstein breed. Rev Bras Zootec. 47:e20170247.
- Ashwell MS, Heyen DW, Sonstegard TS, Van Tassell CP, Da Y, VanRaden PM, Ron M, Weller JI, Lewin HA. 2004. Detection of quantitative trait loci affecting milk production, health, and reproductive traits in Holstein cattle. J Dairy Sci. 87:468–475. doi:10.3168/jds.S0022-0302(04)73186-0.
- Ates A, Hosturk GT, Akis I, Gursel FE, Yardibi H, Oztabak K. 2014. Genotype and allele frequencies of polymorphisms in ABCG2, PPARGC1A and OLR1 genes in indigenous cattle breeds in Turkey. ActaVeterinaria. 64(1):73–80.
- Dunn S, Vohra RS, Murphy JE, Homer–Vanniasinkam S, Walker JH, Ponnambalam S. 2008. The lectin–like oxidized low–density–lipoprotein receptor: a pro–inflammatory factor in vascular disease. Biochem J. 409:349–355. doi:10.1042/BJ20071196.
- FAO. 1983. Food and Agricultural Organization of United Nations. Animal Genetics Resources Information Newsletter 1. https://www.fao.org/.
- Gasteiger E, Gattiker A, Hoogland C, Ivanyi I, Appel RD, Bairoch A. 2003. ExPASy: the proteomics server for in-depth protein knowledge and analysis. Nucleic Acids Res. 31:3784–3788. doi:10.1093/nar/gkg563.
- Georges M, Nielsen D, MacKinnon M, Mishra A, Okimoto R, Pasquino AT, Sargeant LS, Sorensen A, Steele MR, Zhao X. 1995. Mapping quantitative trait loci controlling milk production in dairy cattle by exploiting progeny testing. Genetics. 139:907–920. doi:10.1093/genetics/139.2.907.
- Harvey WR. 1990. Guide for LSMLMW, PC-1 version, mixed model least squares and maximum likelihood computer programme. Mimeograph Ohio state. USA: University.
- Ilatsia ED, Roessler R, Kahi AK, Piepho HP, Zarate V. 2012. Production objectives and breeding goals of sahiwal cattle keepers in Kenya and implications for a breeding programme. Trop Anim Health Prod. 44(3):519–530. doi:10.1007/s11250-011-9928-8.
- Iverson SJ, Hamosh M, Bowen WD. 1995. Lipoprotein lipase activity and its relationship to high milk fat transfer during lactation in grey seals. Journal of Comparative Physiology B. 165:384–395.
- Jensen DR, Gavigan S, Sawicki V, Witsell DL, Eckel RH, Neville MC. 1994. Regulation of lipoprotein lipase activity and mRNA in the mammary gland of the lactating mouse. Biochem J. 298:321–327. doi:10.1042/bj2980321.
- Khatib H, Leonard S, Schutzkus V, Luo W, Chang Y. 2006. Association of the OLR1 gene with milk composition in Holstein dairy cattle. J Dairy Sci. 89:1753–1760. doi:10.3168/jds.S0022-0302(06)72243-3.
- Khatib H, Rosa K, Weigal F, Schiavini F, Snatus E, Bagnato A. 2007. Additional support for an association between OLR1 and milk fat traits in cattle. Anim Genet. 38:308–310. doi:10.1111/j.1365-2052.2007.01584.x.
- Kim S, Lim B, Cho J, Lee S, Dang CG, Jeon JH, Kim JM, Lee J. 2021. Genome-wide identification of candidate genes for milk production traits in Korean Holstein cattle. Animals. 11(5):1392. doi:10.3390/ani11051392.
- Komisarek J, Dorynek Z. 2009. Effect of ABCG2. PPARGC. 1A. OLR1 and SCD1 gene polymorphism on estimated breeding values for functional and production traits in Polish Holstein-Friesian bulls. J Appl Genet. 50:125–132.
- Kramer CY. 1957. Extension of multiple range tests to group correlated adjusted means. Biometrics. 13:13–18. doi:10.2307/3001898.
- Liao CH, Shaw HM, Chao PM. 2008. Impairment of glucose metabolism in mice induced by dietary oxidized frying oil is different from that induced by conjugated linoleic acid. Nutrition. 24:744–752. doi:10.1016/j.nut.2008.03.010.
- Mashhadi MH, Sobhanirad S, Nooraee SE, Kashani RB. 2014. Polymorphism of oxidized low density lipoprotein receptor1 (OLR1) gene in the Iranian Holstein dairy cattle. Res Opin Anim Veterinary Sci. 4(5):237–240.
- Metha JL, Li DY. 2002. Identification, regulation and function of a novel lectin-like oxidized lowdensitylipoprotein receptor. J Am Coll Cardiol. 39:1429–1435.
- Meyer K. 2007. WOMBAT—a tool for mixed model analyses in quantitative genetics by restricted maximum likelihood (REML). J Zhejiang Univ Sci B. 8:815–821. doi:10.1631/jzus.2007.B0815.
- Mohammed MM, Al-Thuwaini TM, Al-Shuhaib MBS. 2021. Association of OLR1 polymorphism with lipid profile levels and lipid ratio of Iraqi awassi ewes. Adv Anim Veterinary Sci. 9(9):1460–1465.
- NAC. 1976. The report of the national commission of agriculture, Government of India.
- Ogorevc J, Kunej T, Razpet A, Dovc P. 2009. Database of cattle candidate genes and genetic markers for milk production and mastitis. Anim Genet. 40:832–851. doi:10.1111/j.1365-2052.2009.01921.x.
- Olsen HG, Gomez-Raya L, Vage DI, Olsaker I, Klungland H, Svendsen M, Adnoy T, Sabry A, Klemetsdal G, Schulman N, et al. 2002. A genome scan for quantitative trait loci affecting milk production in Norwegian dairy cattle. J Dairy Sci. 85:3124–3130. doi:10.3168/jds.S0022-0302(02)74400-7.
- Ringseis R, Dathe C, Muschick A, Brandsch C, Eder K. 2007. Oxidized fat reduces milk triacylglycerol concentrations by inhibiting gene expression of lipoprotein lipase and fatty acid transporters in the mammary gland of rats. J Nutr. 137:2056–2061.
- Rodriguez-Zas SL, Southey BR, Heyen DW, Lewin HA. 2002. Interval and composite interval mapping of somatic cell score, yield, and components of milk in dairy cattle. J Dairy Sci. 85:3081–3091.
- Rychtarova J, Sztankoova Z, Kyselova J, Zink V, Stipkova M, Vacek M, Stolc L. 2014. Effect of DGAT1, BTN1A1, OLR1, and STAT1 genes on milk production and reproduction traits in the Czech Fleckvieh breed. Czech J Anim Sci. 59:45–53.
- Sambrook J, Russell DW. 2001. Cold spring laboratory press; NY, cold spring harbour. Molecular cloning: A laboratory manual III.
- Schennink A, Bovenhuis H, Leon-Kloosterziel KM, Van Arendonk JA, Visker MH. 2009. Effect of polymorphisms in the FASN, OLR1, PPARGC1A, PRL and STAT5A genes on bovine milk-fat composition. Anim Genet. 40(6):909–916.
- Sim N-L, Kumar P, Hu J, Henikoff S, Schneider G, Ng PC. 2012. SIFT web server: predicting effects of amino acid substitutions on proteins. Nucleic Acids Res. 40(1):452–457.
- Singh OP. 1983. Climate of Karnal. Bulletin No. 8. Karnal (India): Central Soil Salinity Research Institute (ICAR).
- Soltani-Ghombavani M, Ansari-Mahyari S, Ali-Edriss M. 2013. Association of a polymorphism in the 3’ untranslated region of the OLR1 gene with milk fat and protein in dairy cows. Archiv Tierzucht. 56(32):328–334.
- Sturges HA. 1926. The choice of a class interval. J Am Stat Assoc. 21:65–66. doi:10.1080/01621459.1926.10502161.
- Viitala SM, Schulman NF, De Koning DJ, Elo K, Kinos R, Virta A, Virta J, Maki-Tanila A, Vilkki JH. 2003. Quantitative trait loci affecting milk production traits in Finnish Ayrshire dairy cattle. J Dairy Sci. 86:1828–1836. doi:10.3168/jds.S0022-0302(03)73769-2.
- Wang X, Penagaricano F, Tal-Stein R, Lipkin E, Khatib H. 2012. Association of an OLR1 polymorphism with milk production traits in the Israeli Holstein population. J Dairy Sci. 95:1565–1567.
- Yeh FC, Yang RC, Boyle T. 1999. Popgene. microsoft windows-based freeware for population genetic analysis. version 1.31. Canada: University of Alberta.