
 ?Mathematical formulae have been encoded as MathML and are displayed in this HTML version using MathJax in order to improve their display. Uncheck the box to turn MathJax off. This feature requires Javascript. Click on a formula to zoom.
ABSTRACT
The use of multivariate adaptive regression splines (MARS) and classification and regression tree (CART) to estimate the live body weight at weaning age of the Sussex cattle breed remain poorly understood in South Africa. This study was conducted to examine the effect of linear body measurements on body weight at weaning using MARS and CART algorithms. The body weight and linear body measurements included sternum height, withers height, heart girth, hip height, body length, rump length and rump width were collected from 101 Sussex cattle (female = 57 and male = 44) at weaning. Goodness of fit criterions was used to select the best data mining algorithms. The results showed that MARS showed higher predictive performance in the criteria as compared to CART algorithm. The findings of the study suggest that MARS algorithm can be used to estimate the BW at weaning age in Sussex cattle breed. These findings might be helpful to cattle farmers in the selection criterions of breeding stock at weaning age.
1. Introduction
The Sussex cattle breed is characterized by a red to dark-red colour coat with a unique white tail switch of beef cattle from the Weald of Sussex, Surrey and Kent in South Eastern England (Annelie Citation2014). Sussex cattle animals are one of the oldest and pure breeds of English cattle used for meat production in the world (Bila Citation2019). At present, the Sussex cattle breed has both polled and horned strains available all over the world, including South African (SA) herds. Moreover, the Sussex cattle breed were selectively bred in the late eighteenth century to develop a contemporary beef breed, which is currently in used in various nations around the world (Annelie Citation2014). The first Sussex cattle breed, which involved 20 cows, was brought to South Africa in 1903 by Mr Alec Holm of the Potchefstroom College of Agriculture (SA Studbook and Animal Improvement Scheme Citation2004). Today, Sussex cattle stud and commercial herds are found throughout South Africa, Botswana and Namibia, after nearly a century, this testifies to their adaptability to South African climatic conditions (Bila Citation2019). However, there are other beef cattle breeds such as Bonsmara, Nguni, Afrikaner and Simmentaller that are found throughout South Africa provinces and used for beef cattle production (Mapholi et al. Citation2011; Pienaar et al. Citation2014; Sanarana et al. Citation2016; Grobler et al. Citation2018; Bareki Citation2019; Hendriks et al. Citation2022). The relationship between live body weight and linear body measurements assists to predict body weight, particularly in communal setups and pastoral production systems; thereby weighing scale is unavailable to describe the breed’s live body weight (Fatih et al. Citation2021). Live body weight of animals in many parts of the world is the most economic important trait due to the fact that incomes are directly derived from the animal’s body weight. Lately, animal breeders have paid more attention in enlightening the association between morphological traits and body weight with a specific objective to increase meat production (Faraz et al. Citation2021). Multivariate adaptive regression splines (MARS) is a non-parametric regression technique that does not involve some supposition around the dispersal of the variables and association between the variables entered into the predictive model to be built into statistical evaluation (Fatih et al. Citation2021). The classification and regression tree (CART) analysis is a great geometric approach that assesses the most imperative parameters in a specific data set and aids in designing a specific model (Fatih et al. Citation2021). Furthermore, CART is known as algebraic technique which is appropriate for different forms of data such as ordinal, nominal and continuous variables (Aytekin et al. Citation2018a; Tyasi et al. Citation2020). CART estimations can be used by animal keepers in decision-making processes regarding herd management. Faraz et al. (Citation2021) reported that CART and MARS algorithms overcome the multi-collineality problems in estimating body weight. While, Celik et al. (Citation2017) revealed that linear body measurements are positively effective on live body weight and assessed them as indirect selection criteria in sheep mating strategies. Several, reports have been published on predicting body weight from linear body measurements in diverse animal species such as cattle, sheep, rabbits, dogs and camels (Celik et al. Citation2017; Tandoh and Gwaza Citation2017; Aytekin et al. Citation2018a; Eyduran et al. Citation2019; Putra et al. Citation2020; Tırınk et al. Citation2021; Ağyar et al. Citation2022). The prediction of body weight from linear body measurements is of great importance for herd management, breed standards and national breeding schemes. However, to the deepest of our information, there is no literature well-known on predicting body weight at weaning age from linear body measurements in South African Sussex cattle breed. Hence, the objective of this research was to predict live body weight at weaning age from certain linear body measurements in South African Sussex weaner calve through MARS and CART data mining algorithms.
2. Materials and methods
2.1. Study site
This study was carried out at Huntersvlei farm also known as Rhys Evans Group (RE) in the Free State Province, South Africa. The farm is situated in Viljoenskroon, Fezile Dabi municipality; the site, temperatures, latitudes, longitude and rainfall of the study area are similar as described by Bila (Citation2019). Huntersvlei farm is one of the oldest and leading Sussex cattle stud herd in South Africa at present.
2.2. Animal management
All the animals used in the study were exposed to a traditional management grazing system which allows animals to freely graze in the camps during the day and afternoon. Fresh clean water was made available in the camps at all times for animals to drink. The animals received a routine inspection and dipping for herd health management purposes. The linear body measurements were taken while the animal was in a standing position with head raised up and weighed on all four feet. A functional handling facility with a crowding pen, working crush and head clamp was used for handling the animals to minimize movement during the measuring process.
2.3. Data collection
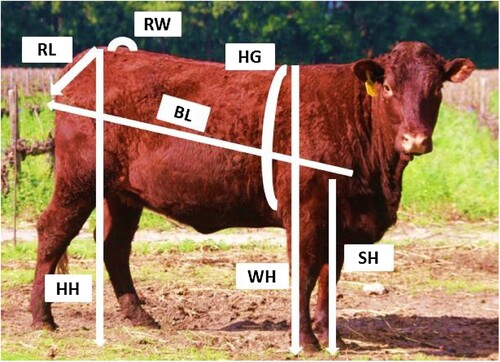
Linear body measurements and live body weight at weaning age were taken in 101 (female = 57 and male = 44) Sussex weaners. The animals used in the study at weaning age were between six to eight months old. The live body weight (BW) at weaning was measured using a balance weighing scale whereas linear body measurements were measured using a measuring tape calibrated in centimetres (cm). The body weight at weaning and linear body measurements () namely sternum height (SH), withers height (WH), heart girth (HG), hip height (HH), body length (BL), rump length (RL) and rump width (RW) were measured following the guideline defined by Bila et al. (Citation2021) and Hlokoe et al. (Citation2022). To prevent individual variations in the measurements, only one individual was taking the body weight and linear body measurements.
Figure 1. Showing linear body measurements measured during study. SH: Sternum height, WH: Withers height, HG: Heart girth, HH: Hip height, BL: Body length, RL: Rump length, RW: Rump width.
2.4. Statistical analysis
The statistical Package for Social Sciences (2019) version 26.0 with a probability of 5% 105 for significance was used to analyse the data for analysis of Student t-test to examine the influence of sex on linear body measurement traits. Decision tree algorithms were used to design the model to estimate BW from linear body measurements of SA Sussex cattle weaners using the study of Eyduran et al. (Citation2019). The cross-validation was kept at 10, as recommended by Celik and Yilmaz (Citation2018). Moreover, the goodness of fit criteria was used to perform the estimation of BW from linear body measurements of SA Sussex cattle weaners of MARS and CART (Faraz et al. Citation2021).
2.5. Multivariate adaptive regression spline algorithm
The multivariate adaptive regression spline algorithm is a non-parametric machine learning algorithm introduced by Friedman (Citation1991) for handling pattern recognition problems in regression and classification for handling non-linear data. For this purpose, the MARS model fits a series of linear regression functions for predicting the values of the continuous dependent variable Iqbal et al. (Citation2023). A multivariate adaptive regression spline algorithm was carried out as described by Hlokoe et al. (Citation2022) and Iqbal et al. (Citation2023). MARS data mining algorithm can be defined as:
where f(x) is the estimated value of the dependent variable, β0 and βm are intercept, hm(Xv(k,m)) is the basis function, where v(k, m) is an index of the predictor for the mth component of the kth product, K is the parameter regulating the order of interaction. After building the most suitable MARS model, the basic functions that did not contribute much to the model fitting performance were removed in the pruning process based on the following generalized cross-validation error (GCV) (Eyduran et al. Citation2019; Zaborski et al. Citation2019; Hlokoe et al. Citation2022).
where n is the number of training cases, yi is the observed value of a response variable, yip is the estimated value of a response variable and M(λ) is a penalty function for the complexity of the model with λ terms.
2.6. Classification and regression tree algorithm
CART as replicating data mining algorithm tree was constructed by splitting a node into pairs of child nodes repetitively, opening with the root node that encompasses the whole learning sample following Breiman et al. (Citation1984) and Kuhn and Johnson (Citation2020) suggestions.
2.6.1. Goodness of fit test
The best model between MARS and CART was determined by calculating the goodness of fit test criteria (Celik and Yilmaz Citation2018; Hlokoe et al. Citation2022). The following goodness of fit was used in the study.
2.7. Pearson’s correlation coefficient
Pearson’s correlation coefficient (r) is a descriptive statistic, meaning that it summarizes the characteristics of a dataset. Precisely, it describes the strength and direction of the linear relationship between two quantitative variables.
2.7.1. Relative root-mean-square error
Relative root-mean-square error (RRMSE) normalizes the root mean squared error by the mean of observations. It goes from 0 to infinity. The lower relative root mean square error the better the prediction performance of a dataset.
2.7.2. Mean error
Mean error (ME) is an informal term that usually refers to the average of all the errors in a set. An “error” in this context is an uncertainty in a measurement, or the difference between the measured value and true/correct value.
2.7.3. Performance index
Performance index (PI) is used in technical analysis to compare a stock's price trend to the general trend of a benchmark index.
2.7.4. Coefficient of determination
Coefficient of determination (Rsq) is the proportion of variation of the dependent variable explained by independent variables is measured by the coefficient of determination (Rsq). The range of Rsq is from 0 to 1, with values close to 1 indicating a better fit. The Rsq can be computed by taking the square of the correlation coefficient.
2.7.5. Adjusted coefficient of determination
Adjusted coefficient of determination (ARsq) is an adjustment for the coefficient of determination that takes into account the number of variables in a data set. It also penalizes one for points that don’t fit the model.
2.7.6. Root-mean-square error
Root-mean-square error (RMSE) is defined as the square root of the mean squared error and is also known as the standard deviation of the residuals (prediction errors). Smaller values of RMSE are desired. The formula for calculating the RMSE is given as follows:
2.7.7. Standard deviation ratio
Standard deviation ratio (SDR) is another evaluation measure used to assess the performance of fitted models. It is measured by taking the ratio of the observed to the model’s fitted values.
2.7.8. Akaike information criteria
Akaike Information Criteria (AIC) is a method for evaluating how well a model fits the data. The best model for the data is chosen by comparing its fit to the data using the AIC.
2.7.9. Mean absolute percentage error
Mean absolute percentage error (MAPE) is a popular measure of prediction error. The MAPE measures the size of the error in percentage terms and is hence easy to interpret and understand. The smaller the MAPE, the better the prediction. The MAPE is defined as follows:
2.7.10. Mean absolute deviation
Mean absolute deviation (MAD) is a measure of the error where the error is defined as the difference between the fitted values of the model and the actual (observed) values. Since the absolute errors are used, the MAD avoids the problem of negative and positive errors cancelling each other out. A smaller MAD value from a model is an indication of a better fit (Iqbal et al. Citation2023).
2.7.11. Global relative approximation error
Global relative approximation error (RAE) it calculates and returns global relative approximation error.
2.7.12. Coefficient of variance
Coefficient of variance (CV) is a statistical measure of the relative dispersion of data points in a data series around the mean. In finance, the coefficient of variation allows investors to determine how much volatility, or risk, is assumed in comparison to the amount of return expected from investments.
Package in R was used in the statistical evaluation of the MARS and CART data mining algorithms using EhoGof package (version 0.1.1) introduced by Eyduran (Citation2020).
3. Results
Descriptive statistics of body weight at weaning age and linear body measurements for female and male calves are presented in . The descriptive statistics of body weight and linear body measurements for male and female calves discovered a significant difference (p ≤ 0.05), except for RL and RW.
Table 1. Descriptive statistics of body weight and linear body measurements in South African Sussex weaner calve.
denotes Pearson’s correlation coefficients for predicting the association between body weight at weaning and linear body measurements. In the female calves, the body weight at weaning age was highly correlated with HG 0.76 (p ≤ 0.01) while insignificant correlated with SH 0.23 (p ≥ 0.05). The body weight at weaning age was found highly significant (p ≤ 0.01) correlated with WH (0.60), HH (0.62), BL (0.44), RL (0.41) and RW (0.60). In the male calves, the body weight at weaning age was highly correlated with HH 0.74 (p ≤ 0.01) while insignificant correlated with SH 0.24 (p ≥ 0.05). Lastly, the body weight at weaning age was found highly significant (p ≤ 0.01) correlated with WH (0.51), HG (0.51), BL (0.63) and RW (0.53) while RL (0.33) significant (p ≤ 0.05).
Table 2. Correlation matrix of measured traits, female below diagonal and male above diagonal.
shows the MARS model results. The first term of the model had an intercept that had a coefficient of 214.54. The second term, HG, had a cut-point of 141 cm for a positive coefficient of 2.65. The third term, HH, had a cut-point of 111 cm with a positive coefficient of 3.30. While the last term was RW, with a negative coefficient of 2.49. The basic functions that reduce the performance of the model obtained after the forward and backward pass stages were eliminated due to the GCV in MARS modelling.
Table 3. MARS model.
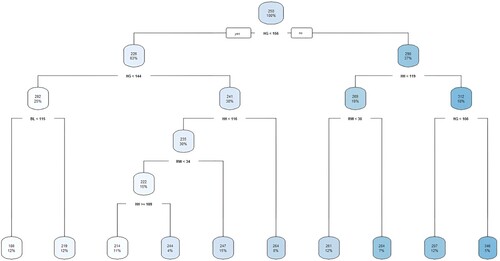
shows findings of CART data mining algorithms based on the cross-validation technique. The algorithms produced a tree structure of nine terminal nodes with the smallest relative error (the cross-validation error, 0.12) and mean of the error (0.43), which indicates that the cross-validation and coefficient of determination were close to each other. The leading predictors on BW at weaning age as a response variable were HG, HH, BL and RW. At the top of the regression diagram, generally the body weight at weaning age of the South African Sussex weaner calves was recorded as 250 kg.
Table 4. CART algorithm outcome based on the cross-validation method.
3.1. Comparison of the MARS and CART algorithms
The goodness of fit criteria worked out for measuring the predictive performance, the test data set was used to make sound decision between MARS and CART data mining algorithms and the results are summarized in . MARS showed higher predictive performance in the criteria as compared to CART data mining algorithms. MARS data mining algorithm showed smaller RMSE, RRMSE, SDR, CV, MAPE, AIC, PI and MAD test results. While on the other hand CART data mining algorithm showed smaller r, Rsq and ARSq. In practice, the MARS model created a simple interpretable equation with the greatest performance in three predictors HG, HH and RW, compared to the CART data mining algorithm outcome based on the cross-validation method that produced 10 complexity parameters with nine numbers of splits.
Table 5. Goodness of fit criteria for MARS and CART algorithms.
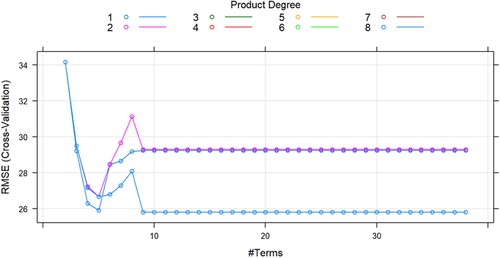
depicts graph of candidate model selection for the optimal MARS model. Moreover, MARS models were established with the use of train function in caret R package (). Between the 185 candidate MARS models 2–38 terms and 1–8 degrees of interaction, MARS model of the seven terms with no interaction effect was selected as an optimal model that had the smallest cross-validated RSME value ().
Figure 2. Model selection for the optimal MARS model.
shows the regression tree diagram created by the CART algorithm in predicting body weight at weaning age from the linear body measurements. At the top most of the regression tree diagram, overall the body weight at the weaning age of the South African Sussex weaner calves was recorded as 250 kg. At the first tree average, the body weight was 226 kg Sussex weaner calve with HG <144 cm was lighter by 64 kg. At the second depth of the tree, the average body weight was 202 kg of Sussex weaner calve BL < 115 cm. The second depth of the tree, the average body weight was 241 kg of Sussex weaner calve HH < 116 cm. Furthermore, at the third depth of the tree, the average body weight was 235 kg of Sussex weaner calve.
Figure 3. CART model.
4. Discussion
Celik and Yilmaz (Citation2018) reported that the linear body measurements are positively influential on live body weight and are evaluated as indirect selection criteria in breeding strategies. The current study firstly investigated the relationship between linear body measurements and live body weight of Sussex cattle at weaning age. The correlation results indicated that the female calves, body weight at weaning age were highly correlated with heart girth while insignificant correlated with sternum height. In male calves, the body weight at weaning age was highly correlated with hip height while insignificant correlated with sternum height. The findings of the current study are in lined with the reports made by Tyasi et al. (Citation2020) who revealed that male Nguni cattle, linear body measurements such as sternum height, heart girth, withers height and rump width had a significant positive correlation with live body weight. However, the correlation coefficient does not stipulate the effect of linear body measurement traits on the live body weight of animals, it only indicates the magnitude of the relationship among the measured traits (Tyasi et al. Citation2020). Hence the regression models have been employed to estimate the body weight from linear body measurements of Sussex cattle at weaning. Moreover, the regression models cannot overcome the challenge of the multi-collinearity (Mathapo et al. Citation2022). Hence, data mining algorithms had been used to predict live body weight from linear body measurements of the Sussex cattle weaners. In this study, MARS and CART data mining algorithms had been compared for the estimation of the live body weight of the South African Sussex cattle breed at weaning age. The results of the present study showed that MARS had a higher predictive performance in the criteria as compared to CART algorithm. The findings of the study suggest that MARS algorithm can be used to predict the body weight at weaning age in South African Sussex cattle breed. MARS data mining algorithm had been recommended on prediction of live body weight in Nguni cows (Hlokoe et al. Citation2022). Furthermore, MARS had been recommended for the prediction of different factors in cattle breeding. For example, MARS had been also recommended based on the training and test data set by Çanga (Citation2022) on prediction of hot carcass weight of seven cattle breeds such as Aberdeen-Angus, Simmental, Limousine, Holstein – Friesian, Charolais, Zebu and Hereford using breed, age and live body weight. Karadas and Birinci (Citation2019) used CART, Chi-Square Automatic Interaction Detector (CHAID), Exhaustive Chi-Square Automatic Interaction Detector (Exhaustive CHAID), MARS and Multilayer Perceptron (MLP) to determine the factors affecting dairy cattle and recommend that MARS outperformed the other algorithms used. Aytekin et al. (Citation2018a) recommended the use of MARS data mining algorithm for the prediction of fattening final live weight from some-body measurements and fattening period in young bulls of crossbred and exotic breeds such as Holstein, Simmental and Brown Swiss. Our MARS model produced a simple interpretable equation with the greatest performance in three predictor’s heart girth, hip height and rump width, compared to the CART algorithm outcome based on the cross-validation method that produced 10 complexity parameters with nine numbers of splits. The cross-validation results obtained by the MARS model produced 2–38 terms. Our findings differ from the findings of Faraz et al. (Citation2021) which produced seven terms without interaction in the model selection graph. Lastly, these results produced only eight degrees. Hlokoe et al. (Citation2022) showed that MARS produced 10 important variables such as ear length, withers height, body depth, sternum height, rump length, bicoastal diameter, head length, hearth girth, body length and rump height for the prediction of body weight in Nguni cows. Çanga (Citation2022) showed that MARS includes age, breed and live body weight for the prediction of carcass weight in seven cattle breeds. Karadas and Birinci (Citation2019) showed that mastitis control before milking; birth month, lactation length and feed supply were important factors on average milk yield per cow. Aytekin et al. (Citation2018b) showed that MARS includes chest circumference, back rump height, fattening period, body length, withers height, front rump height, back height and breed for the prediction of fattening final live body weight.
5. Conclusions
This research showed a positive correlation between body weight and certain linear body measurements of South African Sussex cattle breed at weaning age. MARS indicated that heart girth, hip height and rump width had an effect on the body weight of the South African Sussex cattle weaners. While CART indicated that heart girth, hip height, body length and rump width had an effect on the body weight of the South African Sussex weaners. Further studies need to be done on MARS and CART techniques with the purpose of improving BW of cattle breeds or more sample sizes of Sussex cattle.
Ethics approval
The experimental procedures were conducted following the University of South Africa (UNISA) Ethics code for the use of live animals in research, ethics reference number: 2022/CAES_AREC/171.
Acknowledgements
The authors are thankful to the Huntersvlei managing director (Claire Evans-Anderson) and farm manager (Enrico Cronje) for allowing us to collect the data from the animals as well as the farm workers who assisted during the data collection process.
Disclosure statement
No potential conflict of interest was reported by the author(s).
Data availability statement
For data requests, please contact the author T.L.T.
Additional information
Funding
References
- Ağyar O, Tırınk C, Önder H, Şen U, Piwczyński D, Yavuz E. 2022. Use of multivariate adaptive regression splines algorithm to predict body weight from body measurements of anatolian buffaloes in türkiye. Animals. 12:2923. doi: 10.3390/ani12212923.
- Annelie C. 2014 Mar 31. Huntersvlei Sussex: introducing polled English genetics to SA. Farmers Weekly.
- Aytekin C, Ni X, Cricri F, Aksu E. 2018b. Clustering and unsupervised anomaly detection with l2 normalized deep auto-encoder representations. International Joint Conference on Neural Networks (IJCNN), Rio de Janeiro, Brazil. p. 1–6. doi: 10.1109/IJCNN.2018.8489068.
- Aytekin I, Eyduran E, Karadas K, Akşahan R, Keskin I. 2018a. Prediction of fattening final live weight from some body measurements and fattening period in young bulls of crossbred and exotic breeds using MARS data mining algorithm. Pak J Zool. 50:189–195. doi: 10.17582/journal.pjz/2018.50.1.189.195.
- Bareki NP. 2019. Genetic evaluation of growth and reproductive performance of the Afrikaner cattle breed [M.Sc. thesis]. North West University.
- Bila L. 2019. Using pelvic area measurements in the selection of replacement Sussex heifers [Unpublished masters dissertation]. Bloemfontein: Department of Agriculture, Central University of Technology. p. 42–48.
- Bila L, Tyasi TL, Fourie P, Katikati A. 2021. Classification and regression tree analysis to predict calving ease in Sussex heifers using pelvic area dimensions and morphological traits. J Adv Vet Anim Res. 8(1):164–172. doi: 10.5455/javar.2021.h499.
- Breiman L, Friedman JH, Olshen RA, Stone CJ. 1984. Classification and regression trees. New York (NY): Chapman and Hall, WadsworthInc.
- Çanga D. 2022. Use of MARS data mining algorithm based on training and test sets in determining carcass weight of cattle in different breeds. J Agri Sci. 28:259–268.
- Celik S, Eyduran E, Karadas K, Tariq MM. 2017. Comparison of predictive performance of data mining algorithms in predicting body weight in Mengali rams of Pakistan. Rev Bras Zootech. 46(11):863–872. doi: 10.1590/s1806-92902017001100005.
- Celik S, Yilmaz O. 2018. Prediction of body weight of Turkish Tazi dogs using data mining techniques: classification and regression tree (CART) and multivariate adaptive regression splines (MARS). Pak J Zool. 50(2):575–583. doi: 10.17582/journal.pjz/2018.50.2.575.583.
- Eyduran E. 2020. ehaGoF: calculates goodness of fit statistics. R package version 0.1.0. https://CRAN.R-project.org/package = ehaGoF.
- Eyduran E, Akin M, Eyduran SP. 2019. Application of multivariate adaptive regression splines through R software. Ankara: Nobel Academic Publishing. p. 104.
- Faraz A, Tirink C, Eyduran E, Waheed A, Tauqir NA, Nabeel MS, Tariq MM. 2021. Prediction of live body weight based on body measurements in Thalli sheep under tropical conditions of Pakistan using CART and MARS. Trop Anim Health Prod. 53:301. doi: 10.1007/s11250-021-02748-6.
- Fatih A, Celik S, Eyduran E, Tirink C, Tariq MM, Sheikh IS, Faraz A, Waheed A. 2021. Use of MARS algorithm for predicting mature weight of different camel (Camelus dromedarius) breeds reared in Pakistan and morphological characterization via cluster analysis. Trop Anim Health Prod. 53(191):1–14. doi: 10.1007/s11250-021-02633-2.
- Friedman J. 1991. Multivariate adaptive regression splines. Ann Stat. 9:1–67.
- Grobler R, van-Marle-Köster E, Visser C, Capitan A. 2018. Haplotype variation at the POLLED locus in the South African Bonsmara cattle breed. Proceedings of the world congress on genetics applied to livestock production. p. 11.814.
- Hendriks J, Neser FWC, van Wyk JB, Jordaan FJ, Scholtz MM. 2022. Estimates of variance components for feedlot traits of the Simmentaler breed in South Africa. S Afri J AnimSci. 51(6):793–800.
- Hlokoe VR, Mokoena K, Tyasi TL. 2022. Using multivariate adaptive regression splines and classification and regression tree data mining algorithms to predict body weight of Nguni cows. J Appl Anim Res. 50(1):534–539. doi: 10.1080/09712119.2022.2110498.
- IBM SPSS. 2019. SPSS release 26.0 Statistical Packet Program, SPSS for Windows. Chicago (IL): SPSS Inc.
- Iqbal F, Raziq A, Zil-E-Huma, Tirink C, Fatih A, Yaqoob M. 2023. Using the artificial bee colony technique to optimize machine learning algorithms in estimating the mature weight of camels. Trop Anim Health Prod. 55:86. doi: 10.1007/s11250-023-03501-x.
- Karadas K, Birinci A. 2019. Determination of factors affecting dairy cattle: a case study of ardahan province using data mining algorithms. Rev Bras Zootec. 48: e20170263. doi: 10.1590/rbz4820170263.
- Kuhn M, Johnson K. 2020. Applied predictive modeling. New York (NY): Springer. Vol. 26, p. 443.
- Mapholi NO, Maiwashe A, Matika O, Riggio V, Bishop SC, MacNeil MD, Marufu MC, Qokweni L, Chimonyo M, Dzama K. 2011. Relationships between tick counts and coat characteristics in Nguni and Bonsmara cattle reared on semiarid rangelands in South Africa. Ticks Tick-Borne Dis. 2:172–177. doi: 10.1016/j.ttbdis.2011.07.001.
- Mathapo MC, Mugwabana TJ, Tyasi TL. 2022. Prediction of body weight from morphological traits of South African non-descript indigenous goats of lepelle-nkumbi local municipality using different data mining algorithm. Trop Anim Health Prod. 54:102. doi: 10.1007/s11250-022-03096-9.
- Pienaar L, Grobler JP, Neser FWC, Scholtz MM, Swart H, Ehlers K, Marx M. 2014. Genetic diversity in selected stud and commercial herds of the Afrikaner cattle breed. S Afr J Anim Sci. 44(5):81–84.
- Putra WPB, Said S, Arifin J. 2020. Principal component analysis (PCA) of body measurements and body indices in the Pasundan cows. BSJ Agri. 3:49–55.
- Sanarana Y, Visser C, Bosman L, Nephawe K, Maiwashe A, Van Marle-Köster E. 2016. Genetic diversity in South African Nguni cattle ecotypes based on microsatellite markers. Trop Anim Health Prod. 48:379–385. doi: 10.1007/s11250-015-0962-9.
- SA Studbook and Animal Improvement Scheme. 2004. South African livestock breeding. Bloemfontein: Picasso Headline.
- Tandoh G, Gwaza DS. 2017. Sex dimorphism in the one hump-camel (Camelus dromedarius) from selected populations in Nigeria. J Appl Life Sci Int. 15(3):1–10. doi: 10.9734/JALSI/2017/37788.
- Tırınk C, Eyduran E, Faraz A, Waheed A, Tauqir NA, Nabeel MS, Tariq MM, Sheikh IS. 2021. Use of multivariate adaptive regression splines for prediction of body weight from body measurements in Marecha (Camelus dromedaries) camels in Pakistan. Trop Anim Health Prod. 53:339. doi: 10.1007/s11250-021-02788-y.
- Tyasi TL, Makgowo KM, Mokoena K, Rashijane LT, Mathapo MC, Danguru LW, Molabe KM, Bopape PM, Mathye ND, Maluleke D, et al. 2020. Classification and regression tree (CRT) analysis to predict body weight of Potchefstroom koekoek laying hens. Adv Anim Vet Sci. 8(4):354–9. doi: 10.17582/journal.aavs/2020/8.4.354.359.
- Zaborski D, Ali M, Eyduran E, Grzesiak W, Tariq MM, Abbas F, Waheed A, Tirink C. 2019. Prediction of selected reproductive traits of indigenous Harnai sheep under the farm management system via various data mining algorithms. Pak J Zool. 51:421–431. doi: 10.17582/journal.pjz/2019.51.2.421.431.