
 ?Mathematical formulae have been encoded as MathML and are displayed in this HTML version using MathJax in order to improve their display. Uncheck the box to turn MathJax off. This feature requires Javascript. Click on a formula to zoom.
ABSTRACT
The study aimed to identify the relationship between body measurements and the weight of sheep and goats. A total of 324 heads of sheep and 261 heads of goats were used. Measuring of body weight (BWt) and body measurements as heart girth (HG), height at wither (HW) and body length (BL) were taken on both types of animals for 3 successive months. Correlations between body weight and measurements were tested. Linear and non-linear regressions of body weight on the most correlated body measurements were calculated. HG, HW and BL were significantly related to BWt. HG had the largest correlation coefficient. Power regression had the highest coefficient of determination (R2 = 0.91) and lowest error of estimate (SE = 7.42). The power regression model (BWt = 0.0006*HG2.5608) was tested against the actual weight of another animal’s population of 119 heads of goats and 171 heads of sheep using paired t-test analysis. No significant variation was observed between the actual and estimated body weights. The model overestimated weight by 1.5%. It was concluded that body weight could be estimated with a high accuracy using the corrected model BWt (kg) = (0.0006*(HG2.5608))–(1.5*(0.0006*(HG2.5608)/100)).
KEYWORDS:
Introduction
Small ruminants are the major livestock raised in Qatar. According to Al-Ghanim et al. (Citation2022), they resemble 88.5% (62.4% were sheep and 26.1% were goats) of the total livestock population which amounted to 1,476,363 heads. Camels and cattle were 8.1% and 3.4% of this population, respectively. Awassi, Erbi, Najdi sheep and Shami and Aaridi goats were well-recognized breeds in Qatar. They adapted more easily to the harsh environmental conditions of the country. Awassi breed resembled 57% of the sheep population followed by the Erbi breed, which accounted for 34% of the sheep population, whereas the other sheep breeds and crosses represented only 9% of the sheep population. Aaridi goat’ breed, accounted for 67% of the population of goats, whereas the Shami breed was 13% and the other breeds and their crosses accounted were 20%.
Body weight and body measurements are crucial selection criteria for improving livestock production. The weight and measurements of animals significantly affect farmer or breeder income (Ajafar et al. Citation2022; Al-Thuwaini and Al-Hadi Citation2022). The most used way to assess body mass is weighing animals with a suitable scale balance. However, such a device is too expensive for most traditional animal holders. Agamy et al. (Citation2015) stated that the best method for determining of animal’s weight without a scale is to predict body weight from body measurements. Linear measurements are indicators of an animal’s body growth (Goe et al. Citation2001; Attah et al. Citation2004). Body growth is a complex biological process that is induced by differential development rates of growth of the different body tissues. External measurements usually reflect the development of the skeleton and/or soft tissues of the body. The various lengths, heights and girths of live animals were used to assess the relationship between these variables and live weight. The use of these measurements in estimating live weight has been reported by several authors (Atta and El Khidir Citation2004; Adeyinka and Mohammed Citation2006; Fajemilehin and Salako Citation2008; Olatunji-akioye and Adeyemo Citation2009; Agamy et al. Citation2015; Sam et al. Citation2016). For animals growing over a wide weight range, the relationship between live weight and heart girth has been curvilinear (Lawrence and Fowler Citation1997). For cattle, Brody (Citation1945) added that body weight changed with a cubed heart girth. Atta and El Khidir (Citation2004) examined the reliability of body measurements based on heart girth, wither height and scapula-ischial length to predict the live weight of Sudan Nilotic sheep using a nonlinear regression equation. The reviewed literature revealed that different models were developed to estimate body weight using body measurements for different breeds and conditions. The aim of this study was to establish a regression equation model that could be potentially used to predict body weight in sheep and goats under field conditions in Qatar.
Materials and methods
Site of the research
The current study was carried out in the Animal Research Station at Alsheehaniya Municipality at 25°21’ N and 51°14’ E, about 25 km west of the capital Doha.
In the research station, three breeds of sheep (Awassi, Najdi and Erbi) and two breeds of goats (Aaridi and Shami) are raised. All animals were reared under an intensive system i.e. stall feeding. All breeds are maintained under the same environmental conditions, each in its own barns. Each breed is accommodated, fed and managed in groups according to similarity of age and physiological status i.e. adult males, dry females, milking females, weaned females and weaned males. Newborns are separated from their dams during the night. The barns are half-shaded, sandy-floored and equipped with stainless steel drinkers and feeders. Dry females, mature bucks, rams and weaners were fed on dried Rhodes as roughages at the rate of 1 kg/head/day, while pregnant and suckling females were fed on dried alfalfa at the same rate. Pelleted concentrate feed of 16% crude protein content that mainly contained soybean meal, barley grains and wheat bran was fed to all animals at rates ranging between 200 and 450 g/head//day according to the physiological status of animals. Salt licks and clean drinking water were always available in front of animals. During the suckling period, lambs and kids were fed with their mother’ milk to be weaned at approximately 100 days of age. All animals in the station are weighed regularly on a monthly basis.
Experiments
The experimental part of the research consists of two experiments:
The main experiment for the collection of the basic data required to build the mathematical model. Body weight and measurements were collected for three successive months (November 2021 to January 2022).
Sensitivity testing experiment for the examination of the uncertainty in the output of the built mathematical model (Saltelli Citation2002). Body weight and measurements were taken to examine the sensitivity of best fitted equation obtained from the main experiment.
Animals
For the main experiment, all animals in the station were available. After the exclusion of visually pregnant ewes and does, five hundred and eighty-five sheep and goats were used in this experiment. shows the distribution of type, sex and breed of the used animals.
Table 1. Distribution of experimental animals according to type, breed and sex.
Another population of animals of 290 heads was used for the sensitivity testing experiment. These animals were kept in another animal’s holding. shows the distribution of type, sex and breeds of the animals used in the sensitivity testing experiment.
Table 2. Distribution of sensitivity testing animals according to type, breed and sex.
Data collection
For the two experiments, animals were fasted for 12 h before weighing in early morning. Using a digital small ruminant, balance animals were weighted to the nearest 100 g. After weighing, linear body measurements were taken using a flexible measuring tape to the nearest 0.5 cm. Body measurements were taken according to that described by Atta and El Khidir (Citation2004):
- Body length (BL): (Scapulo-ischial length), the distance from the dorsal tip of the scapula to the tip of the ischium
- Height at wither (HW): Vertical distance from the highest point of the shoulder (wither) to the ground surface at the level of the foreleg
- Heart girth (HG): The body circumference at a point immediately posterior to the front leg and perpendicular to the body axis.
Statistical analyses
Using the data obtained from the main experiment, Pearson’s correlations of body weight and the different body measurements were computed for pooled data and types (sheep and goats) and sex (males and females) groups (StatSoft Citation2011). Regression analysis was employed to predict live weight from body measurements. For the pooled data, Stepwise multiple linear regression analysis was performed. Simple linear and non-linear regressions were also tested for the measurements of the highest correlation coefficient. Linear, exponential, logarithmic and power mathematical models were tested for best fitting by comparing the coefficient of determination (R2) and the error of estimate. The equations with the largest R2 and smallest error were considered the best-fitting equations. For the regression model of the highest R2, t-test described by Ali (Citation2008) was used to examine the regression coefficients for the significance of the difference between types of animals (sheep vs. goats), sex (males vs. females) and breeds of sheep (Awassi vs. Erbi, Awassi vs. Najdi and Erbi vs. Awassi) and goats (Aaridi vs. Shami). A stepwise multiple regression analysis was performed to test the performance of body weight prediction models using combinations of the body measurements.
Using the data obtained from the sensitivity testing experiment, the body weight of animals was estimated according to the best-fitted equation resulting from the main experiment. A paired t-test was performed to test the significance of the difference between the estimated and actual body weight of this population of animals.
Results
shows the correlation coefficients of body weight and the examined body measurements. The results revealed that all the correlations were significant (P < 0.05). HG always was the measure of the highest correlation coefficient. illustrates the performance of regression models used to describe the relationship between body weight (y) and heart girth (x) for the pooled data. The power model had the highest determination coefficient (R2) and lowest error of the estimate. Power regressions for the different types, sexes and breeds of the experimental animals are shown in . All the regressions were significant. In the same table, the statistical analysis for the significance of the difference of regression coefficients of animal types (sheep vs. goats), sex (males vs. females) breeds of sheep (Awassi vs. Erbi, Awassi vs. Najdi and Erbi vs. Awassi) and goats (Aaridi vs. Shami). The statistical analyses revealed no variations among the examined groups.
Table 3. Correlation coefficients of weight with body measurements.
Table 4. Parameters of the different mathematical models of regression of body weight (y) on heart girth (x) for the pooled data.
Table 5. Parameters and statistical analysis of Power regressions of body weight (y) on heart girth (x) for the different animals’ groups (type, sex and breeds).
shows the parameters of the stepwise regression. R2 and error of estimate were considered as criteria for selecting the appropriate linear model. The equation of combination of the three linear measurements (step 4) had the largest R2 and smallest standard error. In this equation, HG resembled 69% of regression coefficients, whereas BL and WH resembled 19% and 13%, respectively.
Table 6. Parameters of stepwise multiple regression of body weight on the linear body measurements.
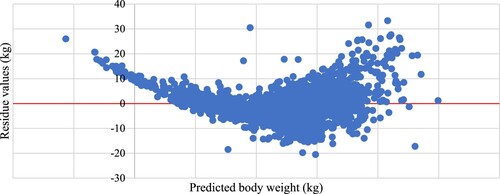
Regressing the residue values (actual weight – predicted weight) on the predicted weight illustrated the trend of the model prediction. () shows the regression of residue values on body weight predicted by the power model estimation, whereas () shows the regression of residue values on body weight predicted by the multiple regression estimation. The former figure illustrates a homogeneous trendless distribution of residues with the increase in body weight. Whereas the latter figure demonstrates that the residue values concentrated above zero at the low and heavy weights and below zero at the medium weights indicating that the model underestimated predication at low and heavy weights and overestimated the prediction at medium weights.
Figure 1. Plotting of body weight predicted by the power regression model on its residue values.
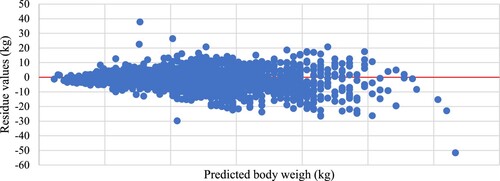
Figure 2. Plotting of body weight predicted by the multiple regression model on its residue values.
Model sensitivity testing
demonstrates the results of testing of significance of the difference between values of measured and estimated body weight of animals used to test the sensitivity of the power model. There was no significant variation (P > 0.05) between the measured and predicted body weight values. The difference between measured and estimated weights (kg) (Estimated weight –Measured) and the percentage of this difference (100*Difference between measured and estimated weights/estimated weight) were calculated and the prediction formula was then corrected by subtracting the percentage of difference.
Table 7. Statistical examination of the difference between measured and estimated body weights of sensitivity testing population.
Estimated body weight = (0.0006*(HG2.5608))–(1.5*(0.0006*(HG2.5608)/100)).
Discussion
Phenotypic correlation (R) is one of the most common and useful statistics that describes the degree of relationship between two variables. The present significant positive correlations between body weight and the examined body measurements were reported by all the reviewed literature (Yakubu Citation2010; Patil et al. Citation2013; Shirzeyli et al. Citation2013; Agamy et al. Citation2015; Singh et al. Citation2020). The observed highest correlation coefficient was also noticed for sheep breeds by Atta and El Khidir (Citation2004), Elsheikh et al. (Citation2012), Sam et al. (Citation2016) and Ali et al. (Citation2017) and in goat by Nsoso et al. (Citation2003) Thiruvenkadan (Citation2005), Khan et al. (Citation2006), Abdel-Mageed and Ghanem (Citation2013) and Abd-Alla (Citation2014). Lawrence and Fowler (Citation1997) added that skeletal measurements (wither height and body length) were less variable for body weight compared to heart girth. It is documented that there is a close relationship between the distance around an animal’s heart girth and its body weight (Otoikhian et al. Citation2008). Choosing heart girth as the predictor of body weight in the present study, complies with the observations of Singh et al. (Citation2020), Kamarudin et al. (Citation2011) and Ravimurugan et al. (Citation2013). They reported that since it has the highest correlation with body weight, it may be used as a selection criterion to improve body weight indirectly, and it is the most practical way to estimate the live weight of goats. These findings agree with those of Nigm et al. (Citation1995) who found that heart girth was the best single predictor and accounted for 77% of the variation in body weight of Merino males. Agamy et al. (Citation2015) noted that the best equation for predicting the live body weight of Rahmani lambs was attained when heart girth and body length were included in the equation with the coefficient of determination (R2) being 92%. In the same context, Abdel-Moneim (Citation2009) found that body length and heart girth accounted for 47 and 86% of the body weight of Barki and Rahmani, respectively, whereas both paunch girth and body length represented 93% of the variation in Ossimi’s body weight.
Topal et al. (Citation2003) reported that the coefficient of determination of regression (R2) and error of estimate (SE) might be confidently applied to investigate the fitting state of simple and multiple regression models for the estimation of body weight in livestock. Accordingly, the present power model was reported as the best-fitting regression since it has the highest determination coefficient (R2) and lowest error of estimate. These findings agreed with those reported by Brody (Citation1945). In the same context, Atta and El Khidir (Citation2004) studied the relationship between body weight and linear measurements of Nilotic sheep (from birth to onset of puberty). They found that the regressions of live weight on body measurements showed a non-linear relationship based on y = axb. where the prediction of the body weight of Nilotic sheep can be based on y = 0.0001668×2.867 for males and y = 0.0010674×2.407 for females, where y and x are body weight and heart girth, respectively. The present power regression equations did not show any significant variation due to animal types (sheep vs. goats), sex (males vs. females) breeds of sheep (Awassi vs. Erbi, Awassi vs. Najdi and Erbi vs. Awassi) and goats (Aaridi vs. Shami). This agreed with the observations of Sam et al. (Citation2016). They reported that the coefficient of determination was highest in the equations with pooled data (irrespective of age) compared to equations formed at different age groups hence, the obtained equations may be used to predict the body weight of West African dwarf goats at different age groups.
The present stepwise multiple regression analysis showed that the equation of the three linear measurements (step 4) had the largest R2 and smallest standard error. In this equation, HG resembled 69% of measurement regression coefficients, whereas BL and WH resembled 19% and 13%, respectively. Similar observations were reported by Shirzeyli et al. (Citation2013), Sam et al. (Citation2016) and Singh et al. (Citation2020). They noticed the increase of R2 values and decrease of SE values when the number of combined body measurements increased compared to HG alone as body weight predictors. Tadesse et al. (Citation2012) stated that heart girth and length were the most appropriate parameters to predict body weight in the established regression equations. Lawrence and Fowler (Citation1997); Atta and El Khidir (Citation2004) and Chitra et al. (Citation2012) noted that the coefficient of determination of multiple regression of heart girth and any other linear measurement of body weight was slightly higher than that of the simple regression of heart girth on body weight. However, they concluded that live weight estimations based on two or more body measurements were not more accurate than the estimations based on heart girth alone. This conclusion was in line with the present result of regressing values of residue on values of body weight prediction according to the multiple regression model. As illustrated in () this model underestimated prediction at low and heavy weights and overestimated the prediction at medium weights. Whereas the power model depending on HG alone () illustrated a homogeneous trendless distribution of residues with the increase in body weight.
To test the accuracy of the present proposed power model equation, it was examined against the actual body of another small ruminant population. The results indicated the prediction model overestimated actual body weight by about 1.5%. Such error was also mentioned by Johanson and Hildman (Citation1954). They noted that estimating the live weight of cattle from heart girth measurement is slightly greater than the actual body weight. Accordingly, an allowance for variations was added to the equation that is equal to the percentage of the difference between the predicted and actual body weight. To conclude with the corrected model formula:
Body weight (kg) = (0.0006*(HG2.56))–(1.5*(0.0006*(HG2.56)/100)).
Conclusion
Body weight and linear body measurements were significantly correlated with each other. Heart girth is the most suitable linear measurement for body weight prediction. The best-fitting model was obtained when the heart girth was included in a power regression equation offering accurate prediction of body weight. So at the field bases body weight can be estimated with a high accuracy using the corrected model:
Body weight (kg) = (0.0006*(HG2.56))–(1.5*(0.0006*(HG2.56)/100)).
Therefore, with such a management decision system, performance improvement and genetic resource conservation may be more promising.
Acknowledgements
The authors acknowledge the sincere efforts of workers in the Animal Production Research Station of the Agricultural Research Department. The logistic support received from the department administration is also gratefully acknowledged.
Disclosure statement
No potential conflict of interest was reported by the author(s).
Data availability statement
Raw data were generated at the Animal Research Station, Department of Agricultural Researches, Ministry of Municipalities – Qatar. Derived data supporting the findings of this study are available from the corresponding author [M. Atta] on request.
References
- Abd-Alla MS. 2014. A comparative study on body measurements and carcass characteristics in Egyptian sheep and goats. Asian J Anim Veterinary Adv. 9:292–301. doi:10.3923/ajava.2014.292.301.
- Abdel-Mageed I, Ghanem N. 2013. Predicting body weight and longissimus muscle area using body measurements in subtropical goat kids. Egypt J Sheep Goat Sci. 8:95–100. doi:10.12816/0005029.
- Abdel-Moneim AY. 2009. Use of live body measurements for prediction of body and carcass cuts weights in three Egyptian breeds of sheep. Egypt J Sheep Goat Sci. 4:17–32.
- Adeyinka LA, Mohammed ID. 2006. Relationship of live weight and linear body measurement in two breeds of goats of Northern Nigeria. J Anim Veterinary Adv. 5:891–893.
- Agamy R, Abdel-Moneim AY, Abd-Alla MS, Abdel-Mageed II, Ashmawi GM. 2015. Using linear body measurements to predict body weight and carcass characteristics of three Egyptian fat-tailed sheep breeds. Asian J Anim Veterinary Adv. 10:335–344. doi:10.3923/ajava.2015.335.344.
- Ajafar MH, Al-Thuwaini TM, Dakhel HH. 2022. Association of OLR1 gene polymorphism with live body weight and body morphometric traits in Awassi ewes. Mol Biol Rep. 49(5):4149–4153. doi:10.1007/s11033-022-07481-3.
- Ali MAM. 2008. Experimental methods in agriculture, 2nd ed. Khartoum, Sudan: Currency printing press; p. 298, ISBN: 99942-809-4-5.
- Ali AS, Ibrahim MT, Mohammed MM, Elobied AA, Salih MM. 2017. Association between body measurements trait and live body weight of some Sudanese sheep ecotypes. J Veterinary Sci Agric. 18(1):71–83.
- Al-Ghanim KBA, Diop A;, Al-Awad A, King LT, Aqeed M, Al-Qasim R, Al-Ali SM, Badr L, Atta M, Awad MAA, Abdul-Rahman AAAM. 2022. Qatar agricultural census 2021 executive report. In: The social and economic survey research institute (SESRI). Doha, Qatar: Qatar University; p. 70–75, ISBN: 9789927162008.
- Al-Thuwaini TM, Al-Hadi ABA. 2022. Association of lamb sex with body measurements in single and twin on the Awassi ewes. Adv Anim Vet Sci. 10(8):1849–1853.
- Atta M, El Khidir OA. 2004. Use of heart girth, wither height and scapuloischial length for prediction of live weight of Nilotic sheep. Small Ruminant Res. 55:233–237. doi:10.1016/j.smallrumres.2004.01.005.
- Attah S, Okubanjo AO, Omojola AB, Adesehinwa AOK. 2004. Body and carcass linear measurements of goats slaughtered at different weights. Livestock Res Rural Dev. 16:160–172.
- Brody S. 1945. Bioenergetics and growth. New York, USA: Reinhold publishing corporation.
- Chitra R, Rajendran S, Prasanna D, Kirubakaran A. 2012. Prediction of body weight using appropriate regression model in adult female Malabari goat. Veterinary World. 5:409–411. doi:10.5455/vetworld.2012.409-411.
- Elsheikh MM, Zeinelabdeen WB, Atta M. 2012. Relationship between live weight and body measurements of Kabashi, Ashgar and Nilotic adult rams. Res Opinions Anim Veterinary Sci. 2(4):287–290.
- Fajemilehin OKS, Salako AE. 2008. Body measurement characteristics of the west African dwarf (WAD) goat in deciduous forest zone of Southwestern Nigeria. Afr J Biotechnol. 7(14):2521–2526.
- Goe MR, Alldredge JR, Light D. 2001. Use of heart girth to predict body weight of working oxen in the Ethiopian highlands. Livest Prod Sci. 69(2):187–195. doi:10.1016/S0301-6226(00)00257-8.
- Johanson I, Hildman SE. 1954. The relationship between certain body measurement and live and slaughter weights in cattle. Anim Breeding Abstract. 22:1–17.
- Kamarudin NA, Omar MA, Marimuthu M. 2011. Relationship between body weight and linear body measurements in Boer goats. 6th Proceedings of the Seminar on Veterinary Sciences. p. 68–73.
- Khan H, Muhammad F, Ahmad R, Nawaz G, Rahimullah A, Zubair M. 2006. Relationship of body weight with linear body measurements in goats. J Agricu Biol Sci. 1:51–54.
- Lawrence TL, Fowler VR. 1997. Growth of farm animals. Wallingford, Oxon, UK: CAB International; p. 330.
- Nigm AA, Abdalla OM, Aboul-Ela MB, Kamel HM, Ahmed MA. 1995. Meat characteristics of sheep and goat breeds commonly consumed in UAE. 2. Use of body dimensions for predicting body and carcass weights. Emirates J Agric Sci. 7:39–54.
- Nsoso BSJ, Aganga AA, Moganetsi BP, Tshwenyane SO. 2003. Birth weight, body condition score and heart girth in indigenous Tswana goats during dry and wet season in Southeast Botswenyane. Livestock Res Rural Dev. 15:32.
- Olatunji-akioye A, Adeyemo OK. 2009. Liveweight and chest girth correlation in commercial sheep and goat herds in Southwestern Nigeria. Int J Morphol. 27:49–52. doi:10.4067/S0717-95022009000100009.
- Otoikhian CSO, Otoikhian AM, Akporhuarho OP, Isida-homan C. 2008. Correlation of body weight and some body measurement parameters in Quda sheep under extensive management system. Afr J Gen Agricu. 17:129–133.
- Patil BS, Pachpute ST, Dhage BS. 2013. Growth performance of Sangamneri goats under field conditions. Indian J Small Ruminants. 19(2):151–155.
- Ravimurugan T, Thiruvenkadan AK, Sudhakar K, Panneerselvam S, Elango A. 2013. The estimation of body weight from body measurements in Kilakarsal sheep of Tamil Nadu, India. Iran J Appl Anim Sci. 3(2):357–360.
- Saltelli A. 2002. Sensitivity analysis for importance assessment. Risk Anal. 22(3):1–12. doi:10.1111/0272-4332.00040.
- Sam I, Ekpo J, Ukpanah U, Eyoh G, Warrie M. 2016. Relationship between linear body measurement and live body weight in West African Dwarf goats in Obio Akpa. J Biol, Agric Healthcare. 6(16):118–124.
- Shirzeyli FH, Lavvaf A, Asadi A. 2013. Estimation of body weight from body measurements in four breeds of Iranian sheep. Songklanakarin J Sci Technol. 35(5):507–511.
- Singh SG, Kaur A, Kumar B. 2020. Predicting the body weight using appropriate regression model in beetal goat kids. Theriogenology Insight. 10(1):01–06.
- StatSoft Inc. 2011. STATISTICA (data analysis software system), version 10. www.statsoft.com.
- Tadesse A, Gebremariam T, Gangwar SK. 2012. Application of linear body measurements for predicting body weight of Abergelle goat breed in Tigray region, Northern-Ethiopia. Global J Bio-Science Biotechnol. 1(2):314–319. ISSN 2278–9103 314.
- Thiruvenkadan AK. 2005. Determination of best-fitted regression model for estimation of body weight in Kanni Adu kids under farmer's management system. Livestock Res Rural Dev. 17(7).
- Topal M, Yildiz N, Esenbuga N, Aksakal V, Macit M, Ozdemir M. 2003. Determination of best fitted regression model for estimation of body weight in Awassi sheep. J Appl Anim Res. 23:201–208. doi:10.1080/09712119.2003.9706422.
- Yakubu A. 2010. Path coefficient and path analysis of body weight and biometric traits in Yankasa lambs. Slovak J Anim Sci. 43(1):17–25.