
ABSTRACT
Income from goats highly depends on prolificacy, which is difficult to improve by traditional breeding methods. The study aimed to identify SNP markers for prolificacy, using a case–control genome-wide association study (GWAS) on 111 genotyped Cameroon native goat (CNG) does, based on the 50 K single nucleotide polymorphism (SNP) chip panel. None of the top SNPs reached the significant p-value of 5 × 10⁻⁸. The highest p-value was 0.0009. Despite the number of cases being about a quarter of the number of controls, the highest allele frequency of some of the top 20 variants in the cases was indicative of their potential role in the trait. These top variants included the following 15: rs268285661, rs268235169, rs268236449, rs268235135, rs268240394 in Sphingosine-1-phosphate phosphatase 2 (SGPP2) gene, rs268283635 in Solute carrier family 24 member 2 (SLC24A2) gene, rs268251678 in Androgen-induced gene 1 (AIG1) gene, rs268267018, rs268239617, rs268281364, rs268273029, rs268286941, rs268236144, rs268233233 in CEP126 gene and rs268278159, respectively. Our findings indicate that GWAS enable the identification of some loci within genes, with known biological functions and pathways in human being and mice animal model but far-ranging to what was previously hypothesized and tested in goat.
Background
Goats are one of the most reared livestock species in Africa with a population of about 387.67 million (FAO Citation2016), occupying the second position in the world after Asia. This suggests that they play a fundamental role in people’s livelihoods. Despite the harsh production environments in the tropics, their ubiquity in the region suggests that they are fairly well adapted. They are mostly produced under extensive production systems with limited external inputs (Alexandre et al. Citation2012) and their productivity is low.
The analysis of the access and benefit sharing (ABS) of goats may attest to their high potential to improve people’s livelihoods. Unfortunately, this is not yet reflected in livestock research and development strategies in many countries, where actions are more focused on cattle and monogastric animals. This may be due to the undervaluation of the potential of goats in terms of their sociocultural importance and their contribution to food and nutrition security. According to Dhanda et al. (Citation2003), a high proportion of goat meat production is either sold to consumers directly at the farm gate without following proper marketing channels or is consumed in the home and therefore not marketed at all.
Growth and reproduction are key parameters with great impact on goat productivity. Given that goats are mainly produced under a traditional breeding system characterized by an empirical selection, it is expected that improving the knowledge of the genetic determinism of these traits will positively impact their productivity. In Cameroon, the West African dwarf goat (WADG) is one of the most adapted genetic types in the Western highland (WHAZ) and bimodal rainforest agro-ecological zones (BRFAZ) which is greatly concerned by the above-mentioned described poor knowledge statute. They are known to be precocious and prolific. Observations in this population of different types of birth such as twins, triplets (Tchouamo et al. Citation2005), quadruplets (Manjeli et al. Citation1994; Tchoumboué Citation1997) and sextuplets (Kouam et al. Citation2015) suggest the influence of one or several major genes. However, the low heritability of this trait (Ricordeau Citation1992) together with the fact that the trait is expressed late do not ease the selection of best females. Kouam et al. (Citation2015) revealed a high phenotypic correlation between conformation trait and the prolificacy of the Western Highland and the Bimodal rainforest Cameroon native goats (CNG), suggesting some of these traits may be governed by a group of genes transmitted together or under pleiotropic effect.
No data which can be used as the baseline for genetic parameter estimation for this trait are available. Nowadays, molecular investigation approaches are expected to rapidly fill similar gaps. Apart from the studies of Meutchieye et al. (Citation2014) and Tarekegn et al. (Citation2019) on molecular diversity study and the non-conclusive study of Wouobeng et al. (Citation2018) on the polymorphism investigation of three genes on the prolificacy, no other work has been reported in CNG. With the decrease in sequencing and genotyping costs and the increase in genomic studies in small ruminants, it is expected that many more major genes and causal mutations will be available soon (Rupp et al. Citation2016).
Compared to other livestock species (cattle, sheep, pig and chicken), very few major genes have been identified in goat populations. Among others, there is the Prp for scrapie resistance (Barillet et al. Citation2009), and a 11.7-kb deletion for polled in goat (Pailhoux et al. Citation2001). Some were identified from candidate gene studies: SMAD1 (Wijayanti et al. Citation2022a), CLSTN2 (Wijayanti et al. Citation2022b), SMAD2 (Wijayanti et al. Citation2022c), BMP15, Prp, and caseins and more recently from genome-wide association studies (GWAS) using the 50 K single nucleotide polymorphism (SNP) chip such as the Socs2 for mastitis susceptibility and Tmem154 as reported by Rupp et al. (Citation2016).
Using GWAS appears as a leapfrog which can solve the issue of the long length of conventional breeding via the calculation of estimated breeding values (EBV) from phenotypic and pedigree information and the blindness quality of the candidate gene approach when choosing the gene to be tested. GWAS are large-scale genetic studies involving the study of large numbers of genes or SNPs across extensive populations with a particular phenotype compared to controls (Alawieh et al. Citation2014). In goats, this has only been possible by recent advances in goat genome exploration resources and tools. Significant outputs have been the goat reference genome, made available by the International Goat Genome Consortium (IGGC) (Dong et al. Citation2013) and the 50k goat SNP panel (Tosser-Klopp et al. Citation2014) and the recent goat ARS1 reference genome (http://www.ensembl.org/Capra_hircus/Info/Index) released in 2018. This study aims to identify the genes responsible for reproductive traits in the Cameroon native goat.
Results
Distribution of the p-values of the variants
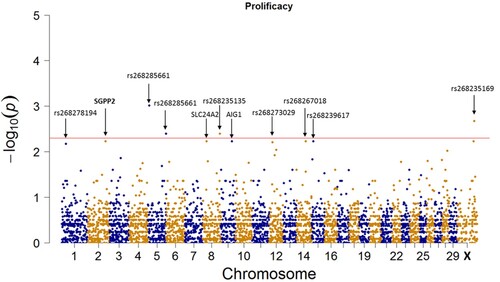
and show the quantile-quantile (QQ) plot and the Manhattan plot of the GWAS for the level of prolificacy in CNG, respectively.
Figure 1. QQ plot of the GWAS for prolificacy in CNG.
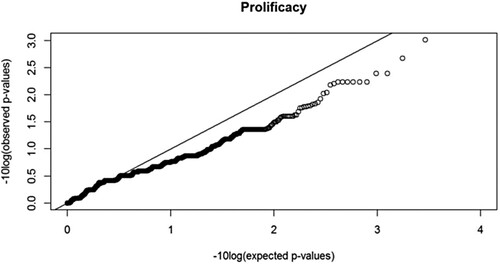
Figure 2. Manhattan plot of GWAS for prolificacy. The red line is a subjective line at −log10 (p) where p = 3 × 10⁻³.
As shown in , only a few SNPs extremely deviate from the expected phenotypes while the general trend of the observed values is slightly below the line of the expected values, which may be due to population stratification. The QQ plot for the prolificacy shows that there is a downward deviation of the observed p-values compared to those expected under the null hypothesis. A QQ plot is used to inspect GWAS results for systematic bias such as population stratification. In the absence of systematic bias, all p-values will be distributed on a straight line corresponding to expected values under the null hypothesis, except for p-values corresponding to few truly associated SNPs, which will have higher observed values with genome-wide or least suggestive significance. Downward deviation indicates type II error inflation (risk of false negative results).
As shown in , a few variants reached or passed the point −log10 (p) = 2. The Manhattan plot shows that none of the variants reached the recommended p-value of 5 × 10⁻⁸. This indicates that none of the variants have a single strong effect on the CNG prolificacy. Then, all the top recorded variants may only act as a result of the combination of the moderate effects of each of them.
Genes in or near the identified variants
shows the top 20 variants from the GWAS of prolificacy.
Table 1. List of the first top 20 SNPs markers and their characteristics ranked according to the p-value from the GWAS output for prolificacy in CNG.
As shown in , 6 of the top 20 SNPs are in genes, all of them being a protein-coding type. Among these genes, only one shows the highest frequency in the control group suggesting this gene may partially impact the low prolificacy of some does. On the contrary, the remaining genes show the highest frequencies in the case group. However, all the variants are in intronic regions.
Up to 15 of the top 20 variants had high allele frequency in the case group (high prolific does). These are rs268285661 (Capra hircus chromosome 5, (CHI5)); rs268235169 (CHI30); rs268236449 (CHI5); rs268235135 (CHI8); rs268240394 in Sphingosine-1-phosphate phosphatase 2 (SGPP2) gene (CHI 2); rs268283635 in Solute carrier family 24 member 2 (SLC24A2) gene (CHI8); rs268251678 in Androgen-induced gene 1 (AIG1) gene (CHI9); rs268267018 (CHI14); rs268239617 (CHI15); rs268281364 (CHI30); rs268273029 (CHI12); rs268286941 (CHI12); rs268236144 (CHI12); rs268233233 in CEP126 gene (CHI15) and rs268278159 (CHI8).
The consecutive series (for the 3rd to the 4th then from the 5th to the 11th top SNP) of low frequencies of alleles in both case and control groups but with identical proportion may be illustrative of many small recombination events followed by little consequences on the prolificacy level. Prolificacy in GNG is probably involved in various molecular events with common consequences. This is supported by our previous finding revealing the influence of some morphometric traits of different natures on the reproduction parameter among which the prolificacy. It appears that many pathways may affect the prolificacy in CNG supporting the involvement of the regulatory process which the underlining mechanism remains to be highlighted.
Analysis of the selected top variants for the level of prolificacy
The first top (p-value = 0.0009) SNP variant is rs268285661 located on CHI5. This variant was mapped as an intergenic variant of the goat genome, between NAV3, neuron navigator 3 (ENSCHIG00000012255) overlapping another Protein coding gene (ENSCHIG00000020619) at less than 40 kb and a LincRNA (ENSCHIG00000001373) located upstream at more than 80 kb (Additional_file_6). The NAV3 gene belongs to the neuron navigator family and is expressed predominantly in the nervous system. In the database, no information about the LD SNP is available. The frequency of the minor allele for this SNP in the case group (0.24) is higher than that of the control group (0.07). This may suggest its important role in the regulation of this trait. This potential role needs to be highlighted in the future. Interestingly, variant rs268285661 on CHI 5 may have a major role in the regulation of both reproduction and zoometric traits especially chest girth and the live body weight. It has been found within the top eleventh variant regulating the size level of the chest girth and the live body weight in WAGD (non-published) suggesting its pleiotropic effects on goat phenotypes.
The second lower p-value was obtained for the SNP rs268235169 located on the sexual chromosome (CHI 30). However, the genomic location and the potential consequence of this variant are not yet available in the database. Moreover, in the database, no information about the LD SNP is available. The frequency of the minor allele (G nucleotide) for this SNP in the case group (0.33) is higher than in the control group (0.13). This may suggest the important role of the sexual chromosome in the regulation of the litter size in CNG.
The rs268236449 is located on CHI 5. The SNP variant is in high LD with two other SNPs. Then some of these markers may only be a tag SNP with an indirect subjective effect on the trait. These have been recorded as intergenic variants with no immediate nearest genes. However, the variant falls within constrained elements for 103 eutherian mammals (Additional_file_7) Enredo-Pecan-Ortheus (EPO)-low-coverage of 103-way Genomic Evolutionary Rate Profiling (GERP). Mutations in such regions may have consequences on the goat’s prolificacy. Although the frequencies of the minor alleles in the case (0.09524) and control (0.012) groups are low, the one in the case group is greater than that in the control.
The rs268235135 is located on CHI 8 and was found in LD with six others (r² varies from 0.834–to 0.949). The variant is mapped as an intergenic variant but with no immediate nearest genes. The 1MB flanking region of this SNP is available (Additional_file_8). The same frequency value pattern of the minor allele as for the previous variant was recoded for the case and the control group.
The fifth top subjective SNP (rs268240394) is in CHI 2, in gene SGPP2, sphingosine-1-phosphate phosphatase 2, gene ID ENSCHIG00000021868. The variant is mapped as an intron variant and does not have any other in LD. This may suggest that a single mutation of this variant may affect the gene activity. The gene has two transcripts and its molecular function is associated with catalytic activity. Although the frequencies of minor alleles in the case (0.071) and control (0.006) groups are low, the one in the case group was greater than in the control group. Such findings highlighted the potential influence of SGPP2 in the prolificacy of CNG.
The gene SLC24A2, Solute carrier family 24, gene ID ENSCHIG00000025681, is located on CHI 8. The SNP variant is in high LD (0.84–0.9) with five other SNPs. Some of these markers may only be tagged SNPs with an indirect subjective effect on the trait. These have been recorded as intron variants. This variant overlaps three transcripts, sodium/potassium/calcium exchanger NA + /K + /CA 2 + exchange retinal NA CA + K exchanger Solute carrier family 24 member. The molecular function of the SLC24A2 gene is associated with calcium channel activity; GO:0008273 calcium, potassium: sodium antiporter activity. Although the frequencies of the minor alleles in the case (0.071) and control (0.006) groups are low, the one in the case group was greater than that in the control group.
The gene AIG1, an Androgen-induced gene 1 protein (PTHR10989:SF11) is in CHI 9. The main variant is in LD with another (r² = 0.855). The variant is an intron variant and overlaps one transcript. Its molecular function is related to a protein in the context of a larger network of proteins that interact to accomplish a process at the level of the cell or organism, such as mitosis (http://www.pantherdb.org/about.jsp).
The variant rs268267018 (CHI14) was found in LD with six others (r² varies from 0.951 to –0.984) and is in an intergenic region. Its intergenic position is located closer (at less than 10 kb) to a lincRNA of gene ENSCHIG00000001258, not yet labelled (Additional_file_9). However, the low frequencies of minor alleles in the case (0.071) and control (0.006) groups are low and appear to have less impact on the trait.
The variant rs268239617 located on CHI15 was found in very high LD with single other (r² = 0.99). It is also an intergenic variant. Its intergenic position is located closer (at nearly 10 kb) to a lincRNA of a not yet labelled gene ENSCHIG00000002112 (Additional_file_10). However, the low frequencies of minor alleles in the case (0.071) and control (0.006) groups are low and appear to have less impact on the trait.
The variant rs268281364, located on sex chromosome X (CHI 30) had no available information about potential LD with other SNP variants in the database. Moreover, the variant has not been mapped on the available goat genome database. This may be a spurious variant or needs to be more investigated as the X chromosome in a goat remains very poorly labelled compared to autosomes. However, the low frequencies of minor alleles in the case (0.071) and control (0.006) groups are low and appear to have less impact on the trait.
The variant rs268273029 located on CHI12 had no available information about potential LD with other SNP variants in the database. This variant is an intergenic one. Its intergenic position is located between the protein-coding gene known to participate in DNA replication, the RNASEH2B (ribonuclease H2 subunit, ENSCHIG00000018220) at less than 76 kb downstream and far away from a LincRNA ENSCHIG00000006067 at around 336 kb upstream (Additional_file_11). Deep screening of the region at 101 bp scale reveals that the variant is located just at 2 bp from a deletion site of 12 bp segment length still an intergenic variant. However, the low frequencies of the minor allele (A) in the case (0.071) and control (0.006) groups are low and appear to have less impact on the trait.
The rs268278194 is located on CHI1. The SNP variant is in high LD with 28 other SNPs among which 10 had complete LD (r² = 1), 13 with r² of 0.815–0.819 and five others varying from 0.928– to 0.986. Then some of these markers may only be a tag SNP with an indirect subjective effect on the trait. These have been recorded as intergenic variants with no immediate nearest genes. Its intergenic position is located between coding genes ENSCHIG00000001258 around 140 kb downstream and ROBO1 at 100 kb upstream (Additional_file_12). The frequencies greatly change and increase here compared to those previously found in the other variants. The difference in frequencies of minor alleles in the case (0.25) and control (0.48) groups appears to have a probable impact on the trait.
The rs268286941 is located on CHI 12. This variant is not in LD with any other SNP variant in the database. The variant is mapped as an intergenic variant but with no immediate nearest genes (Additional_file_13). However, the minor allele frequency (0.62) for this marker was the highest obtained among the top previous variants in the case group and was also greater than its respective frequency (0.39) in the control group. This is indicative of the high occurrence of this marker in highly prolific does of CNG.
The rs268271762 is located on CHI 28. Like the rs268286941, it was not in LD with any other SNP variant in the database. The variant is mapped as an intergenic variant but with no immediate nearest genes (Additional_file_14). The frequency of the minor allele was twice in the control group (0.42) as compared to that of the case group (0.2). and was also greater than its respective frequency (0.39).
The gene ATP8A2, ATPase phospholipid transporting 8A2 (ENSCHIG00000008913) is located on CHI 12. The observed variant, rs268236144 is in high LD (r² = 0.985 and 0.971) with two other SNPs both located in gene ATP8A2, close to a deletion site at 30 bp (Additional_file_15). Then some of these markers may only be a tag SNP with an indirect subjective effect on the trait. These have been recorded as intron variants. The greater frequency of the minor allele in case (0.15) than in the control group where it is even null (0.04) implies the important role of the variant in high prolific does. Some variants have been mentioned on CHI 12. The pattern of allele frequencies may also indicate the contribution of specific haplotype architecture in the regulation process.
The variant rs268244753 located on CHI 3 is in high LD (r² = 0.965) with another SNP. Then one of both markers may only be a tag SNP with an indirect subjective effect on the trait. The variant was recorded as an intergenic variant but very close to a deletion site at only 16 bp (Additional_file_16). The greater frequency of the minor allele in control (0.15) than in the case group where it is even null (0.00) implies the important role of the variant in some low prolific does.
The gene CEP126, Centrosomal Protein 126 or KIAA1377, is located on CHI 15. The observed variant, rs268233233 is in high LD with four other SNPs among which three with complete linkage and 1 with r² = 0.835 all located in gene CEP126. Then some of these markers may only be a tag SNP with an indirect subjective effect on the trait. These have been recorded as intron variants. The greater frequency of the minor allele in the case (0.16) than in the control group where it is even null (0.05) implies the important role of the variant in the high prolific does. Diseases associated with CEP126 include Amyotrophy and monomelic. In a human being, the tissue specificity of this protein-coding gene shows the highest expression in testis (www.ncbi.nlm.nih.gov).
The rs268289122 is located on CHI 28. However, no information about potential LD with other SNP variant is available in the database. The variant is mapped as an intergenic variant but with no immediate nearest genes (Additional_file_17). The frequency of the minor allele in the control (0.38) was greater than that in the case group (0.17).
The gene PRKG1, Protein Kinase CGMP-Dependent 1, (ENSCHIG00000012195), is a protein-coding located on CHI 26. The observed variant, rs268233233 is in high LD with six other SNPs among which two with complete linkage, two (r² = 0.976) and the last two (r² = 0.975) all in intron except one splice region variant (r² = 0.976) of the gene. Then some of these markers may only be a tag SNP with an indirect subjective effect on the trait. However, the variant located in the splice region of the gene may have functional consequences. The greater frequency of the minor allele in control (0.25) than in the case group (0.07) implies the important role of the variant in some low prolific does. Among the molecular functions there is the synthesis of the Serine/threonine protein kinase that acts as a key mediator of the nitric oxide (NO)/cGMP signalling pathway. Activation of PRKG1 by NO signalling alters gene expression in several tissues. In humans, prediction suggests low expression in the ovary. Meanwhile, high expression in adult testis and moderate in ovary have been predicted in mice (www.ncbi.nlm.nih.gov). Interaction Proteins analysis in humans for the PRKG1 gene using the STRING Interaction Network tool (version11.string-db.org) revealed five top genes (Additional_file_18a) among which SMAD4 was strongly interacting with the Gene BMPR2 through the BMP pathway of cardiac activating regions. In muscle physiology, SMAD4 plays a central role in the balance between atrophy and hypertrophy. BMPR2 was however among the top 25 (Additional_file_18b) interactant genes of the PRKG1.
The rs268278159 is located on CHI8. The SNP variant is in high LD with eight other SNPs among which five had complete LD (r² = 1), one with r² of 0.987and two others with r² equal to 0.928 and 0.908 respectively. Then some of these markers may only be a tag SNP with an indirect subjective effect on the trait. These have been recorded as intergenic variants with no immediate nearest genes. rs268278159 is located at 120 kb downstream from a LincRNA gene, ENSCHIG00000007878 (Additional_file_19). The frequency of the minor allele in the control (0.42) was greater than that in the case group (0.14).
Discussion
Efficiency of SNP chip in CNG
More than 50% (21049/41129) of the remaining SNPs after the HWE test and missing genotype had a minor allele frequency (MAF) less than 0.05 indicating a high proportion of low allele frequencies in CNG. A higher proportion of low allele frequencies has been associated with greater genetic diversity in indicine populations obtained by sequencing data (Gibbs et al. Citation2009; Murray et al. Citation2010). The intrinsic nature of the goat 50 K SNP chip may also justify such results due to the type of breeds used during its conception. The 50k goat SNP panel (Tosser-Klopp et al. Citation2014) was developed by combining the sequencing of whole genomes and reduced representation libraries from six different breeds/populations from Europe and Asia. These breeds included meat, milk and mixed types: Alpine, Boer, Creole, Katjang, Saanen and Savanna, comprising a total of 97 animals. It can be found that the number of animals involved is relatively small and reduced to a few breeds when considering the worldwide scale. This tool may fail to capture common variants in the CNG breed. Consequently, the SNP density on the actual commercial SNP chip may not have the same efficiency in genetically distant breeds. A similar observation has been made in cattle by Bejarano et al. (Citation2018) who suggested that the lower MAF could be attributed to the fact that the Bovine SNP50K_V2 used Bos Taurus breed sequence data, which is genetically distinct from the Bos indicus breeds. As recommended by Bush and Moore (Citation2012) for GWAS in African vs European human populations, the capture of the commonly occurring SNPs in GNG may require a more improved SNP chip than the actually available one.
Around 91.5% (r²≥0.5) of SNPs were removed after the pruning suggesting that most of those markers are correlated. The pruning does not lead to any missing information. It is based on the LD between markers and is basically used to reduce the computational time. We also found that the quality of the Manhattan plot, which was noisy without pruning, has also improved. Moreover, a good proportion (15.6%, r²≥ 0.9, 3138/20080) of SNPs showing a very high degree of LD has been observed within the SNP chip which has been assessed by the r² instead of D’. The r2 is a more robust measure of LD because it is less sensitive to allele frequency and a small sample size (Berihulay et al. Citation2019). LD could be the most widely important measurement of connectedness between allele pairs and haplotype block structures across a given population (Al-Mamun et al. Citation2015). The pattern of LD between adjacent markers is generally high, decreases with increasing marker distance, and is affected by various factors, such as genetic drift, population growth/structure, mutation, artificial/natural selection and the recombination rate (Berihulay et al. Citation2019).
The number of other SNP markers in high LD with the top variants varied from 0 to 67 and sometimes the information was simply not yet available in the database. Most of these variants in LD with others may only be tagged SNPs and require to be mapped. High r² values indicate that two SNPs convey similar information as the allele of the first SNP is often observed with one allele of the second SNP, all the top SNPs with high LD could be the indirect association and will require additional studies to map the precise location of the influential SNP Bush and Moore (Citation2012). On the contrary, top single SNPs, which are not in LD with another, may directly influence the trait.
Among the top 20 first variants identified for prolificacy, many were in the sex chromosome (X, CHI30). Surprisingly, none of these variants match with any region of the goat genome, suggesting that the goat genome has not yet been completely studied or only partially studied. An initial trial (unpublished) using only autosomes gives different results suggesting that a holistic approach is convenient for the exploratory study of important genes. Moreover, the available tools need to be improved to capture meaningful variations. For instance, of the 21343 protein-coding genes in the ARS1 (Ensembl release 97) reference transcriptome, 7036 (33%) had no informative gene name. Many of these unannotated genes are likely to have important hidden functions. Muriuki et al. (Citation2019) released new genes and currently, ARS1 has about 6000 unannotated genes. Nevertheless, the actual ARS1 (Ensembl release 100-April 2020) contains 21361 coding genes not fully annotated. Many of these unannotated genes are likely to have important functions. The issue of such a gap had previously been mentioned in human beings by Khaitovich et al. (Citation2006) suggesting a growing body of evidence indicating that a much greater proportion of the human genome is transcribed than is accounted for by the existing annotation.
Significance of the variants
None of the top SNPs reached the significant p-value of P < 5 × 10⁻⁸. We pruned the SNP data until a value of 1713. Using the Bonferroni correction of 0.05/k, the expected significant p-value in our case was supposed to be 0.00002. Unfortunately, our top p-value was 0.0009. This suggests that those traits could be mostly under regulatory mechanisms.
Most of the top SNPs were in intergenic regions. Based on these findings, one may confirm the polygenic nature in the regulation of the prolificacy of CNG. This may be the result of the fact that CNG is a non-specialized breed with a high degree of recombination and which optimally combines various resources to better fit their environment. Such findings have been reported by Wang et al. (Citation2016) using analysis of selection signatures. Indeed, these authors found that none of the conserved SNPs in four genes in evolutionary conserved regions in mammals were located within coding regions that lead to amino acid exchanges, thereby indicating that the genetic basis of goat production and adaptive traits are complex and that the variants are rather regulatory.
The locations of the SNPs in the non-coding region are also in line with the findings of Brodie et al. (Citation2016) in disease-associated SNP using GWAS. For variants located in the intergenic region, it is not excluded that, they are the only marker of far variation located within a gene, especially those without any known LD. Using a pathway-based approach to explore how far the SNP may be from the affected Genes, Brodie et al. (Citation2016) found that affected genes are often up to 2 Mbps away from the associated SNP, and are not necessarily the closest genes to the SNP. This suggests that the quest for the responsible genes may not be completed until a significant marker is physically confirmed at a given position on the genome.
On the other hand, the absence of significant SNPs might be due to the low sample size used or the strict threshold applied. Although the number of individuals in the case group was a quarter of those in the control group, the highest frequency of some top p-value variants in the case is indicative of their potential role in the trait. According to Hong and Park (Citation2012), a 1:4 case–control ratio is one way to achieve higher statistical power in studying a common disease in a case–control study. It has been suggested that to achieve results with relatively high statistical power a sample size of more than 2000 is required (Spencer et al. Citation2009). With 2000 cases and 2000 controls, only common variants with quite a strong effect can be reliably detected at this level; with 5000 cases and controls, common variants of modest effect can be detected although the power to detect rare variants (minor allele frequency <0.05) is still quite low (Barrett et al. Citation2014). Sample sizes in GWAS of domestic animals vary from 329 sheep (Zhang et al. Citation2013) to 1000 sheep (White et al. Citation2012) and 2000 cattle (Pausch et al. Citation2011). In this study, there were only 104 goat samples. A non-significant threshold was also not reached by Guðmundsdóttir (Citation2015) using 96 samples of sheep genotyped. Less sample size per breed has been used (Wang et al. Citation2016; Onzima et al. Citation2018) in selection signature in goat. However, the sample size is also highly dependent on the SNP chip size. For instance, testing a single SNP marker requires 248 cases, while testing 500 000 SNPs and 1 million markers requires 1206 and 1255 cases, respectively, under the assumption of an odds ratio of 2, 5% disease prevalence, 5% minor allele frequency, complete linkage disequilibrium (LD), 1:1 case/control ratio, and a 5% error rate in an allelic test (Hong and Park Citation2012). These provisions are based on simulation and are practically not yet easy to achieve due to the limited amount of available resources. Moreover, previous experiences show that increasing the sample size will not solve the issue of the great proportion of trait variation not explained by the marker SNP.
In their GWAS study on Human height, Allen et al. (Citation2010) reported that by increasing the sample size to more than 100,000 individuals, they identified common variants that account for approximately 10% of phenotypic variation. These authors support the idea that biological insights, rather than predictive power, will be the main outcome of this initial wave of GWAS, and that new approaches, which could include sequencing studies or GWAS targeting variants of lower frequency, will be needed to account for more of the ‘missing’ heritability. Reaching a larger sample size is unrealistic in local breeds given the perception of their economic interest, the limited financial and technological resources and the lack reliable record system for data of different natures. Nevertheless, more interesting results may be obtained through harmonious collaboration between the scientific community by merging available data.
Identified top variants for the level of prolificacy
The QQ plot for the prolificacy has shown that there is a downward deviation of the observed p-values compared to those expected under the null hypothesis. The downward deviation of the QQ plot for the prolificacy indicates type II error inflation (risk of false negative results). Such a pattern has been recorded by Chan et al. (Citation2015). However, the deviation at the upper end of the graph shows few SNPs with the least suggestive significance.
The Manhattan plot shows that none of the variants reached the p-value of 5 × 10⁻⁸. Paim et al. (Citation2019) used less p-value (log p-value > 3) to identify SNP associated with selection signatures in various breeds. The significant regions (log p-value > 3) were identified and local population trees and haplotype clusters of each region were plotted. The local population trees used only those SNPs located within the regions of signatures of selection identified to show the breeds’ undergoing selection. Costa et al. (Citation2015) used log 10 (BF) equal to 2 as a threshold to find 42 SNPs that were significant for the studied binary trait Heifer rebreeding (HR). However, by considering the less strict p-value in our case, it was possible to identify important genomic regions, chromosomes and even some genes with potential effects.
Based on the available literature, some reported SNP variants among the 20 top seemed interesting. The first top variant rs268285661 on CHI5 was also found within the top eleventh variant regulating the size level of the chest girth and the live body weight in WAGD (non-published) suggesting its pleiotropic effects on goat phenotypes. This may explain the significant association previously observed by Kouam et al. (Citation2015) between these traits at the phenotypic level. Furthermore, this finding provides strong evidence of the previous phenotypic correlation observed between these traits, confirming the high potential of chest girth and weight as indicator traits for prolificacy in CNG.
The fifth top SNP (rs268240394) was located on CHI 2, in an intronic region of the gene SGPP2. The gene is known to have 2 transcripts and its molecular function is associated with catalytic activity (https://www.ebi.ac.uk/QuickGO/term/GO:0042392). Mizugishi et al. (Citation2007) found that mutant mice for SPHK1 and SPHK2 produced infertile females, with reduced production of S1P.
The gene PRKG1, located on CHI 26, was reported as the nineteenth top variant (rs268233233) and showed among its top 25 interactant genes, a well-known fecundity gene BMPR2. Genes belonging to the BMP type have already been reported as strong candidate genes in sheep. An illustration is BMPR1B (FecB or Booroola) and the BMP15 (Fec X in Lausaune) genes. Interestingly, these genes have been tested by Wouobeng et al. (Citation2018) in CNG without conclusive results. This finding depicts the crucial role that PRKG1 may play in the prolificacy regulation of CNG.
Previous attempts of assessing the prolificacy gene in CNG consisted in investigating the polymorphism of 3 genes BMPR-1B (Booroola gene Fec B), GDF9 and BMP 15 (Fec X) on a set of 24 does among which 12 were highly prolific and 12 low prolific as reported in Wouobeng et al. (Citation2018). These results showed a non-conclusive effect of the observed polymorphism in BMPR-1B and in GDF9 while BMP 15 was monomorphic. Some of those 24 does were among the samples used for this GWAS. The actual study confirms that the above-mentioned three genes are not responsible for the prolificacy of CNG from WHAZ and BRFAZ. However, by considering less strict p-value, it was possible to identify important genomic regions, chromosomes and even some genes with potential effects. Compared to other livestock species, cattle, sheep, pigs and chicken, very few major genes have been identified in goat populations. Among others there is the Prp for scrapie resistance (Barillet et al. Citation2009), and a 11.7-kb deletion for polled in goat (Pailhoux et al. Citation2001). Some were identified from candidate gene studies (Bmp15, Prp and caseins) and also more recently from GWAS using the 50 K SNP chip such as the Socs2 for mastitis susceptibility, as reported by Rupp et al. (Citation2016). Other genes are the Prp for scrapie resistance (Barillet et al. Citation2009). Few were identified from candidate gene studies (Bmp15, Prp and caseins) and more recently, Socs2 and Tmem154 from GWAS using the 50 K SNP chip (Rupp et al. Citation2016).
Different results have also been reported using transcriptomic studies. In pregnant and nonpregnant Anhui white goats, six genes (DCDC2, TBC1D15, PTHRP, SLC1A2, RDH16 and SST) were enriched for biological regulation, enzyme regulator activity, growth, metabolic process and response to stimulus Gene Ontology terms (Quan et al. Citation2019). We reported one gene, SLC24A2, belonging to the same family of Solute carriers like SLC1A2, suggesting that Solute Carrier Family genes may play an important role in the reproductive processes in goats. Miao et al. (Citation2016) used RNA-Seq technology to perform a GWA of the miRNAs and identified differential miRNAs that are predicted to contribute to different prolificacies of two goat breeds (Jining Grey and Laiwu Black) through several biological processes and pathways. In particular, Chi-miR-187, chr12_10768_star and chi-miR-874-3P may play an important role in the reproductive regulation processes. They also found that TGFB1, THBS1, ACVR18 and BMP88 and chr12_10768_star regulate three genes, including CHRD, SMAD1 and BMP7. In addition, chi-miR-874-3P regulates three genes, including MAPK3, BMPR2 and CHRD. However, some of these genes or close members (BMPR2 and SMAD1) belong to various illustrated STRING network interactant proteins together with other important genes in mammals. This is an indicator illustrating the breed variability in terms of the regulation of biological processes, conferring the breed specificity and therefore, the importance of examining them individually with great attention.
Conclusion
CNG has a singular fecundity determinism which was not yet described in any other caprine breeds. GWA study appears as a leapfrog which can solve the issue of the long length of phenotypic breeding and the blindness approach of the candidate gene approach when choosing a gene to be tested. Many SNPs variants have been identified, displaying various molecular consequence types depending on the genomic region in which they were located. These genomic regions were in great proportion either intergenic or intron and few downstream genes and upstream genes. The great proportion of intergenic and intron variants illustrates that prolificacy in CNG is predominantly controlled by regulatory events. A series of markers with low allele frequency both in the case and control may suggest that the hyper prolificacy events are the result of various genetic recombination mechanisms. Most of these variants may only be a tag SNP as some of them were in high LD with others. Among the recorded genes, good numbers had coherent implications in the trait studied with that previously reported in human and mice animal models. Many uncharacterized and unlabelled variants are illustrative of the necessity to improve the screening tools.
The study also clearly shows the potential usefulness of GWAS for exploratory study in less specialized breeds. The major recommendations are: Increasing the sample size or using the available sample to access those markers through collaboration or cooperation with other institutions, exploring a quantitative model for analysis workflow, samples resequencing to confirm the existence of the site and assess the polymorphism between animals, settling on the station research programme to affine and optimize these results, identifying and assessing the influence of other molecular variants like CNV on production traits and initiate an investigation of the polymorphism of identifying candidate genes in the population.
Methods
Sampling and data collection
Study area
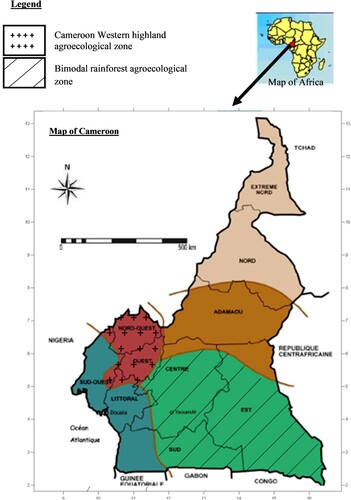
Data were collected in the western highland and the bimodal rainforest agroecological zone of Cameroon (). The first zone is located between 5° and 8° latitude North and 9°45–11°15 longitude East and the second, 2° to 4° latitude North and 11°15–16 ° longitude East (ASEB Citation2010).
Figure 3. Study zone. Source: Adapted from PNGE (Citation2009).
Animal material and sampling
A total number of 111 does (aged from 1 to 9 years) sampled in 41 villages from the WHAZ and BRFAZ of Cameroon were used in the study; they had given birth at least once and were characterized for maximum litter size (the highest litter size in the reproductive life of each doe). The production system among villages is comparable, mainly characterized by free range with modalities such as temporary confinement depending on farming activities. Feed is dominated by natural forage with irregular complementation made up of kitchen waste (Manjeli et al. Citation1994; Teguia et al. Citation1997; Njiki Citation2011).
Data collection
All the records were collected according to the United States Department of Agriculture (USDA) sampling protocol adopted for the African Goat Improvement Network (AGIN), as described by Huson et al. (Citation2014). The recorded data included animal and sample ID, litter size and GPS coordinates (Additional_file_1). For the DNA isolation, ear tissue samples were collected on each female using an adapted punch (Additional_file_2).
DNA extraction and genotyping
The genomic DNA was extracted in 2014 from ear tissues, performed with the Qiagen PurGene tissue protocol and stored at −80°C at the Biosciences Eastern and Central Africa-International Livestock Research Institute (BecA-ILRI) laboratory until the genotyping in 2016. Genotyping products from 111 females, which were genotyped with the caprine 50 K SNP BeadChip array (Illumina Inc., San Diego, CA) described by Tosser-Klopp et al. (Citation2014), were used (Additional_file_3; Additional_file_4 and Additional_file_5). The quality control (QC) of genotypes was performed iteratively as described by Marees et al. (Citation2018).
Data quality control
Loaded SNPs consisted of 51940 variants (autosomes and X chromosomes). Samples were first controlled for main variants. The genotyping sample call rate was set at 99% after which 104 females were retained downstream, while 7 were removed due to missing genotype data. The total genotyping rate in the remaining samples is 0.948611 and 4491 variants were excluded due to missing genotype data. Missing SNP genotypes were not imputed, and the marker effect of the missing SNP genotypes was set to zero for affected animals. This step was followed by the HWE test with a p-value for binary trait <1e−10 during which 6320 deviating variants were removed. The last stage consisted of filtering out the remaining SNPs for MAF settle as less than a threshold of 0.05. At the end of this first QC stage, 21049 variants were removed while 20080 variants and 104 does passed. To avoid the effects of ascertainment bias (on the level of admixture) and computational slowness, these 20080 SNPs were subjected to linkage disequilibrium (LD) pruning. The LD coefficient r² was used and has been set at a threshold value greater than 0.5. Thus, 18367 SNP variants were highly correlated to each other and removed. Finally, a total of 1713 variants and 104 does remained for association analysis. Among the remaining phenotypes, 21 are cases and 83 are controls for the level of prolificacy. gives the number of variants pruned and remaining per chromosome.
Table 2. Evolution of the number of loaded SNPs per chromosome after quality control and pruning.
Study parameters
Identification of molecular genetic marker for prolificacy
To analyze the influence of molecular genetic markers, the prolificacy, here described by the maximum litter size at birth was considered at two different levels of performance required for a case–control study.
Definition of case and control groups
The maximum litter size was used to assess the prolificacy. The females were divided into two groups (case and control) corresponding to two levels of performance: low and high prolific. Low prolific does are those with one and at most two kids, while high prolific are those with three kids and above in relation to their maximum litter size in the whole reproductive life.
Statistical analysis
GWAS was carried out by a chi-square test using one thread (De et al. Citation2014). The total genotyping rate is 0.990205. The Bonferroni correction of 0.05/k was used to determine the significant threshold (where k is the number of variants used for the test here 1713). The results were then compared to the significant p-value 0.00029 or 3 × 10⁻³ and –log10 (p) = 3.53. The analysis was carried out in PLINK v1.90b6.15 (Purcell et al. Citation2007) R-package, run within R (version 3.6.2) (R Development Core Team Citation2016).
Identification of single nucleotide polymorphisms
The analysis of results from genotyping has enabled the detection of SNPs. Then, the SNP corresponding to the variant that reaches the statistical threshold was selected.
Identification of genes
The top 20 SNPs were searched against the genome browser (http://www.ensembl.org/index.html). The Map Viewer tool of the caprine genome in the same browser was used to determine the location of the significant SNPs on the genome. The most severe consequence, the alleles and the location of the variant as well as those in LD were recorded. For SNPs that were not located within genes, the nearest genes were recorded with the distance between the gene and the SNP. Genes that contain significant SNPs were listed.
Gene annotation
For gene annotation, we used gene databases from the University of California at Santa Cruz (UCSC) Genome Bioinformatics and the National Center for Biotechnology Information (NCBI). The annotation was based on the latest release goat genome (ARS1).
Effect of top SNP or gene of the trait
The gene role was assessed by searching the gene name or ID (for uncharacterised ones) against the available database (http://www.ncbi.nlm.nih.gov; gene card) the Pubmed was used to find the available publications. Specialised database like the Human Gene Database Version 4.14 (www.genecards) and related database Malacards (www.malacards.org); the Human Protein Atlas (www.proteinatlas.org) and the Mouse Genome Informatics-the International database resource for the laboratory mouse (www.informatics.jax.org) were used to find the genes function in human beings and mice, the most studied organisms. The main avenue of pathway analysis in genomics research depends on predetermined knowledge of gene function and gene interaction maps obtainable from online databases like Gene Ontology (http://www.geneontology.org/).
Ethics approval and consent to participate
Sample collection for this work was performed in close collaboration with the Directorate of Veterinary Services of the MINEPIA. During sampling (ear tissue sample), no animal sacrifice was carried out. The bioethical approval procedure for livestock research in Cameroon only includes cases of animal sacrifice, surgery, or medical trials. This is ensured by the Domestic Animal Health Service of the Sub-Directorate of Sanitary Inspection and Veterinary Public Health under the Veterinary Services Directorate of the MINEPIA. Hence, no ethics approval was needed for the sampling in this research. The permission of each goat owner was required before sampling.
Consent for publication
All the authors have read and approved the final manuscript.
Authors’ contributions
JKS contributed to sample collection and laboratory work, analysed the data and wrote the paper; FM contributed to the experimental design and sample collection and supervised the first author; YM supervised the first author; PW contributed to sample collection and laboratory work, CM contributed to laboratory work; GMT managed the samples for genotyping; WN wrote the script and guided the first author in the analysis; RP and AD facilitated access to genotyping data and supervised the work. All authors reviewed the manuscript.
Additional_files_Kouam_et_al
Download Zip (10.6 MB)Acknowledgements
Thanks to the University of Dschang for the academic supervision. Special thanks to flock owners and the Ministry of Livestock, Fisheries and Animal Industries (MINEPIA) and the Ministry of Agriculture and Rural Development offices (MINADER) in Cameroon for support during sampling.
Disclosure statement
No potential conflict of interest was reported by the author(s).
Data availability statement
All data generated or analysed during this study are included in this published article and its supplementary information files. However, data might be commercially sensitive and any further use will require reasonable request with permission from the corresponding author (KOUAM SIMO).
Additional information
Funding
References
- https://www.ebi.ac.uk/QuickGO/term/GO:0042392 Accessed on 30 June 2020.
- http://www.pantherdb.org/about.jsp Accessed on 30 June 2020.
- http://www.ncbi.nlm.nih.gov/ genome/gdv Accessed on 30 June 2020.
- http://www.ensembl.org/index.html 30 June 2020.
- http://www.genecards Accessed on 30 June 2020.
- http://www.malacards.org Accessed on 30 June 2020.
- http://www.proteinatlas.org Accessed on 30 June 2020.
- http://www.informatics.jax.org Accessed on 30 June 2020.
- http://www.geneontology.org Accessed on 30 June 2020.
- Alawieh A, Sabra Z, Nokkari A, El-Assaad A, Mondello S, Zaraket F, Fadlallah B, Kobeissy FH. 2014. Bioinformatics approach to understanding interacting pathways in neuropsychiatric disorders. In: Trent R, editor. Clinical bioinformatics, methods in molecular biology. New York (NY): Springer; p. 157–172. Doi:10.1007/978-1-4939-0847-9_9.
- Alexandre G, Arquet R, Fleury J, Troupé W, Boval M, Archimède H, Mahieu M, Mandonnet N. 2012. Systèmes d’élevage caprins en zone tropicale : analyse des fonctions et des performances. INRA Prod Anim. 25:305. Doi:10.20870/productions-animales.2012.25.3.3218.
- Allen HL, Estrada K, Lettre G, Berndt SI, Weedon MN, Rivadeneira F, Willer CJ, Jackson AU, Vedantam S, Raychaudhuri S, et al. 2010. Hundreds of variants clustered in genomic loci and biological pathways affect human height. Nature. 467:832–838. Doi:10.1038/nature09410.
- Al-Mamun HA, A Clark S, Kwan P, Gondro C. 2015. Genome-wide linkage disequilibrium and genetic diversity in five populations of Australian domestic sheep. Genet Sel Evol. 47:90. Doi:10.1186/s12711-015-0169-6.
- ASEB. 2010. Rapport de l’analyse situationnelle et estimation des besoins dans le domaine de santé et environnement au Cameroun. MINEP, MNSANTE, OMS. 183.
- Barillet F, Mariat D, Amigues Y, Faugeras R, Caillat H, Moazami-Goudarzi K, Rupp R, Babilliot JM, Lacroux C, Lugan S, et al. 2009. Identification of seven haplotypes of the caprine PrP gene at codons 127, 142, 154, 211, 222 and 240 in French Alpine and Saanen breeds and their association with classical scrapie. J Gen Virol. 90(3):769–776. Doi:10.1099/vir.0.006114-0.
- Barrett JH, Taylor JC, Iles MM. 2014. Statistical perspectives for genome-wide association studies (GWAS). In: Trent R, editor. Clinical bioinformatics, methods in molecular biology. New York (NY): Springer; p. 47–61. Doi:10.1007/978-1-4939-0847-9_4.
- Bejarano D, Martínez R, Manrique C, Parra LM, Rocha JF, Gómez Y, Abuabara Y, Gallego J. 2018. Linkage disequilibrium levels and allele frequency distribution in Blanco Orejinegro and Romosinuano Creole cattle using medium density SNP chip data. Genet Mol Biol. 41:426–433. Doi:10.1590/1678-4685-gmb-2016-0310.
- Berihulay H, Islam R, Jiang L, Ma Y. 2019. Genome-wide linkage disequilibrium and the extent of effective population sizes in six Chinese goat populations using a 50 K single nucleotide polymorphism panel. Animals (Basel). 9:350. Doi:10.3390/ani9060350.
- Brodie A, Azaria JR, Ofran Y. 2016. How far from the SNP may the causative genes be? Nucleic Acids Res. 44:6046–6054. Doi:10.1093/nar/gkw500.
- Bush W, Moore J. 2012. Chapter 11: genome-wide association studies. PloS Comput Biol. 8(12):11. Doi:10.1371/journal.pcbi.1002822.
- Chan Y, Salem RM, Hsu Y-HH, McMahon G, Pers TH, Vedantam S, Esko T, Guo MH, Lim ET, Franke L, et al. 2015. Genome-wide analysis of body proportion classifies height-associated variants by mechanism of action and implicates genes important for skeletal development. Am J Hum Genet. 96:695–708. Doi:10.1016/j.ajhg.2015.02.018.
- Costa RB, Camargo GM, Diaz ID, Irano N, Dias MM, Carvalheiro R, Boligon AA, Baldi F, Oliveira HN, Tonhati H, Albuquerque LG. 2015. Genome-wide association study of reproductive traits in Nellore heifers using Bayesian inference. Genet Sel Evol. 47:67. Doi:10.1186/s12711-015-0146-0.
- De R, Bush WS, Moore JH. 2014. Bioinformatics challenges in genome-wide association studies (GWAS). In: Trent R, editor. Clinical bioinformatics, methods in molecular biology. New York (NY): Springer; p. 63–81. Doi:10.1007/978-1-4939-0847-9_5.
- Dhanda JS, Taylor DG, Murray PJ, Pegg RB, Shand PJ. 2003. Goat meat production: present status and future possibilities. Asian-Australas J Anim Sci. 16:1842–1852. Doi:10.5713/ajas.2003.1842.
- Dong Y, Xie M, Jiang Y, Xiao N, Du X, Zhang W, Tosser-Klopp G, Wang J, Yang S, Liang J, et al. 2013. Sequencing and automated whole-genome optical mapping of the genome of a domestic goat (Capra hircus). Nat Biotechnol. 31:135–141. Doi:10.1038/nbt.2478.
- FAO. 2016. Annuaire Statistique de la FAO. FAO, Rome.
- Gibbs RA, Taylor JF, Van Tassell CP, Barendse W, Eversole KA, Gill CA, Green RD, Hamernik DL, Kappes SM, Lien S, et al. 2009. Genome-wide survey of SNP variation uncovers the genetic structure of cattle breeds. Science. 324:528–532. Doi:10.1126/science.1167936.
- Guðmundsdóttir ÓÓ. 2015. Genome-wide association study of muscle traits in Icelandic sheep [MSc]. Agricultural University of Iceland, Hvanneyri. 63.
- Hong EP, Park JW. 2012. Sample size and statistical power calculation in genetic association studies. Genomics Inform. 10:117–122. Doi:10.5808/GI.2012.10.2.117.
- Huson, H.J., Sonstegard, T.S., Silverstein, J., Woodward-Greene, M.J., Masiga, C., Muchadeyi, F., Rees, J., Sayre, B., Elbetagy, A., Rothschild, M., et al. 2014. Genetic and phenotypic characterization of African goat populations to prioritize conservation and production efforts for small-holder farmers in sub-Saharan Africa. American Society of Animal Science. Proceedings, 10th World Congress of Genetics Applied to Livestock Production. 3
- Khaitovich P, Kelso J, Franz H, Visagie J, Giger T, Joerchel S, Petzold E, Green RE, Lachmann M, Pääbo S. 2006. Functionality of intergenic transcription: an evolutionary comparison. PLOS Genet. 2:e171. 1590–1598. Doi:10.1371/journal.pgen.0020171.
- Kouam SJ, Meutchieye F, Kenfack WP, Manjeli Y. 2015. Prolificacy and its relationship with body measurements in Cameroon native goats. Bull Anim Health Prod Afr. 63:235–241. Doi:10.4314/bahpa.v63i4.
- Manjeli Y, Téguia A, Njwe RM, Tchoumboué J, Ayong EE. 1994. Enquête sur l’élevage caprin dans les hauts plateaux de l’ouest Cameroun. Presented at the Small Ruminant Research Network Workshop, Yaoundé, Cameroun. p. 99–103.
- Marees AT, Kluiver Hd, Stringer S, Vorspan F, Curis E, Marie-Claire C, Derks EM. 2018. A tutorial on conducting genome-wide association studies: quality control and statistical analysis. Int J Methods Psychiatr Res. 27:e1608. 10. Doi:10.1002/mpr.1608.
- Meutchieye F, Emma-Ngono PJ, Agaba M, Djikeng A, Manjeli Y. 2014. Genetic diversity of Cameroon indigenous goat populations using microsatellites. Livest Res Rural Dev. 26:7. ISSN 0121-3784.
- Miao X, Luo Q, Zhao H, Qin X. 2016. Genome-wide analysis of miRNAs in the ovaries of Jining Grey and Laiwu Black goats to explore the regulation of fecundity. Sci Rep. 6:9. Doi:10.1038/s41598-016-0002-7.
- Mizugishi K, Li C, Olivera A, Bielawski J, Bielawska A, Deng C-X, Proia RL. 2007. Maternal disturbance in activated sphingolipid metabolism causes pregnancy loss in mice. J Clin Invest. 117:2993–3006. Doi:10.1172/JCI30674.
- Muriuki C, Bush SJ, Salavati M, McCulloch MEB, Lisowski ZM, Agaba M, Djikeng A, Hume DA, Clark EL. 2019. A mini-atlas of gene expression for the domestic goat (Capra hircus) reveals transcriptional differences in immune signatures between sheep and goats. Front Genet. 10:1080. 1–16. Doi:10.3389/fgene.2019.01080.
- Murray C, Huerta-Sanchez E, Casey F, Bradley DG. 2010. Cattle demographic history modelled from autosomal sequence variation. Philos Trans R Soc B Biol Sci. 365:2531–2539. Doi:10.1098/rstb.2010.0103.
- Njiki EW. 2011. Caractéristiques socio-économiques et techniques de l’élevage des petits ruminants dans les Départements de la Valée du Ntem et de la Mvilla (Sud-Cameroun) (Mémoire de fin d’étude). Université de Dschang, Dschang.
- Onzima RB, Upadhyay MR, Doekes HP, Brito LF, Bosse M, Kanis E, Groenen MAM, Crooijmans RPMA. 2018. Genome-wide characterization of selection signatures and runs of homozygosity in Ugandan goat breeds. In: Frontier in Genetics, Sec. Livestock Genomics. Auckland. p. 1–13. Doi:10.3389/fgene.2018.00318.
- Pailhoux E, Vigier B, Chaffaux S, Servel N, Taourit S, Furet J-P, Fellous M, Grosclaude F, Cribiu EP, Cotinot C, Vaiman D. 2001. A 11.7-kb deletion triggers intersexuality and polledness in goats. Nat Genet. 29:453–458. Doi:10.1038/ng769.
- Paim TdP, Faria DA, Hay EH, McManus C, Lanari MR, Esquivel LC, Cascante MI, Alfaro EJ, Mendez A, Faco O, et al. 2019. New world goat populations are a genetically diverse reservoir for future use. Sci Rep. 9. Doi:10.1038/s41598-019-38812-3.
- Pausch H, Flisikowski K, Jung S, Emmerling R, Edel C, Götz K-U, Fries R. 2011. Genome-wide association study identifies two major loci affecting calving ease and growth-related traits in cattle. Genetics. 187:289–297. Doi:10.1534/genetics.110.124057.
- PNGE. 2009. Révision/Opérationnalisation du Plan National de la Gestion de l’Environnement (PNGE) vers un Programme Environnement (PE). Diagnostic de la situation de l’environnement au Cameroun, Diagnostic de la situation de l’environnement au Cameroun. p. 109.
- Purcell S, Neale B, Todd-Brown K, Thomas L, Ferreira MAR, Bender D, Maller J, Sklar P, de Bakker PIW, Daly MJ, Sham PC. 2007. PLINK: a tool set for whole-genome association and population-based linkage analyses. Am J Hum Genet. 81:559–575. Doi:10.1086/519795.
- Quan Q, Zheng Q, Ling Y, Fang F, Chu M, Zhang X, Liu Y, Li W. 2019. Comparative analysis of differentially expressed genes between the ovaries from pregnant and nonpregnant goats using RNA-Seq. J Biol Res-Thessaloniki. 26(3):12. Doi:10.1186/s40709-019-0095-9.
- R Development Core Team. 2016. R: a language and environment for statistical computing, R foundation for statistical computing. Vienna, Austria: R Foundation for Statistical Computing. Doi:10.1007/978-3-540-74686-7.
- Ricordeau G. 1992. Les objectifs et les critères de sélection. Synthèse des estimations de la variabilité génétique et des liaisons entre caractères dans les différentes espèces. Prod Anim. 5:107–116.
- Rupp R, Mucha S, Larroque H, Mcewan J, Coningtont J. 2016. Genomic application in sheep and goat breeding. Anim Front. 6:39. Doi:10.2527/af.2016-0006.
- Spencer CCA, Su Z, Donnelly P, Marchini J. 2009. Designing genome-wide association studies: sample size, power, imputation, and the choice of genotyping chip. PloS Genet. 5(5):13.
- Tarekegn GM, Wouobeng P, Jaures KS, Mrode R, Edea Z, Liu B, Zhang W, Mwai OA, Dessie T, Tesfaye K, et al. 2019. Genome-wide diversity and demographic dynamics of Cameroon goats and their divergence from East African, North African, and Asian conspecifics. PloS ONE. 14(4e):0214843. Doi:10.1371/journal.pone.0214843.
- Tchouamo IR, Tchoumboué J, Thibault L. 2005. Caractéristiques socio-économiques et techniques de l’élevage de petits ruminants dans la province de l’ouest du Cameroun. Tropicultura. 23(4):201–211.
- Tchoumboué J. 1997. Elevage des caprins en zone soudano-guinéenne d’altitude de Cameroun, Visite d’étude sur les systèmes d’élevage dans les zones humides et subhumides d’Afrique., CTA Publications. CTA, Wageningen. p. 148–153.
- Teguia A, Manjeli Y, Tchoumboué J. 1997. L’incidence du calendrier agricole sur l’élevage des petits ruminants dans une zone densement peuplée: cas des Hauts-Plateaux de l’Ouest Cameroun. Tropicultura. 15:56–60.
- Tosser-Klopp G, Bardou P, Bouchez O, Cabau C, Crooijmans R, Dong Y, Donnadieu-Tonon C, Eggen A, Heuven HCM, Jamli S, et al. 2014. Design and characterization of a 52 K SNP chip for goats. PLoS ONE. 9(1):8. E86227. Doi:10.1371/journal.pone.0086227.
- Wang X, Liu J, Zhou G, Guo J, Yan H, Niu Y, Li Y, Yuan C, Geng R, Lan X, et al. 2016. Whole-genome sequencing of eight goat populations for the detection of selection signatures underlying production and adaptive traits. Sci Rep. 6:38932. Doi:10.1038/srep38932.
- White SN, Mousel MR, Herrmann-Hoesing LM, Reynolds JO, Leymaster KA, Neibergs HL, Lewis GS, Knowles DP. 2012. Genome-wide association identifies multiple genomic regions associated with susceptibility to and control of ovine lentivirus. PLoS ONE. 7:10. Doi:10.1371/journal.pone.0047829.
- Wijayanti D, Bai Y, Hanif Q, Chen H, Zhu H, Qu L, Guo Z, Lan X. 2022b. Goat CLSTN2 gene: tissue expression profile, genetic variation, and its associations with litter size. Anim Biotechnol. 18:1–10. Doi:10.1080/10495398.2022.2144342.
- Wijayanti D, Zhang S, Bai Y, Pan C, Chen H, Qu L, Guo Z, Lan X. 2022c. Investigation on mRNA expression and genetic variation within goat SMAD2 gene and its association with litter size. Anim Biotechnol. 34(7):2674–2683. Doi:10.1080/10495398.2022.2077214.
- Wijayanti D, Zhang S, Yang Y, Bai Y, Akhatayeva Z, Pan C, Zhu H, Qu L, Lan X. 2022a. Goat SMAD family member 1 (SMAD1): mRNA expression, genetic variants, and their associations with litter size. Theriogenology. 193:11–19. Doi:10.1016/j.theriogenology.2022.09.001.
- Wouobeng P, Simo JK, Meutchieye F, Yacouba M, Agaba M. 2018. Polymorphism of prolificacy genes (BMP15, BMPR 1B and GDF9), in the Native Goat (Capra hircus) of Cameroon. Proceedings of the World Congress on Genetics Applied to Livestock Production. p. 761.
- Zhang L, Liu J, Zhao F, Ren H, Xu L, Lu J, Zhang S, Zhang X, Wei C, Lu G, et al. 2013. Genome-wide association studies for growth and meat production traits in sheep. PLoS ONE. 8(6):12. E66569. DOI:10.1371/journal.pone.0066569.g002.