Abstract
Flood management is a set of activities that have to be carried out in collaboration with multiple agencies. Advanced flood information with early warning generated using remote sensing satellite technologies can help the agencies to effectively manage the situation on ground. Various environmental parameters and forecasts provided by different agencies can be analyzed and compared with historical flood events for generating probable flood event alerts. The information (environmental parameters) provided by the agencies are heterogeneous and noncompliant to standards and distributed in nature. Synchronization of data from distributed resources and automation of data analysis process for flood management is a primary prerequisite for faster and efficient decision-making. Web 2.0-based web services enable data creation, sharing, communication, and collaboration on web. Spatial data sharing on web 2.0 for making quality of service using open-source software for efficient flood management is a challenge. Available software architectures proposed for risk and environmental crisis management are too generic in nature and needs lot of modification for flood management. An event-driven model coupled with data standardization procedures using service-oriented architecture provides an effective framework for flood management. In this paper, a framework capable of collecting heterogeneous distributed flood-related information for analyzing and alerting probable flood events is proposed. The framework has been implemented to generate automatic flood extent maps, by analyzing the distributed satellite data (as service). The automation of flood delineation process reduces the overall flood product generation time. Open-source web tools have been utilized in development of spatial information system to visualize and analyze the actual situation on ground facilitating overall decision-making process.
1. Introduction
Floods are an unfailing annual event in major river basins all over the world, causing great havoc and extensive damage to agricultural crops and property, in addition to loss of life. India, one of the tropical countries, has the greatest problem of being severely affected by floods (Sharma et al. Citation1996). The flood risk management and emergency response process need an integrated platform for data/information gathering, risk assessment, appraisal of options and making, implementing, and reviewing decisions to reduce, control, accept, or redistribute risks of flooding (Hall et al. Citation2003).The spatial information is now an integral part of flood management (Zlatanova et al. Citation2014). Satellite remote sensing technology provides expeditious and accurate temporal information about flood extent helpful in long-term planning. It supplements conventional time-consuming ground-based surveys for assessing the area affected by floods (Sharma et al. Citation1996). Satellite images provide comprehensive, synoptic, and multi-temporal coverage of very large areas at regular intervals and with quick turnaround time have been very valuable in monitoring and managing flood dynamics (Panda Citation2014).
For flood management and decision-making, information about different parameters such as rainfall and river level, availability of satellite data, emergency resources availability, etc. from different nodal departments is a prerequisite. The information available from these nodal departments is heterogeneous and closed in nature. Integration of this heterogeneous geospatial data of different types and formats, real-time geospatial data streaming and filtering with integration of results of simulations is a challenge for decision-making (Vescoukis, Doulamis, and Karagiorgou Citation2012). The flood management process can be divided into three main stages, namely planning, flood emergency management, and post-flood recovery (Simonovic Citation1999). It requires a database (Table ) as a prerequisite for flood management in red river basin decision support system (DSS). In the planning phase, various alternative structural and unstructured measures are analyzed and compared. In addition to this, feasibility study for implementation is also evaluated during this phase. An efficient plan for a region cannot stop the flood but can minimize its damage. Flood emergency management includes integration of ground situation and the ground operations for managing the floods. The most important component of flood management is event reporting or identification of the potential events such as heavy rainfall, breaches, etc. which could affect the current flood situations.
Table 1. Prerequisite data elements for flood management.
Geospatial technologies play a major role in the flood management. It has the great advantage of data generation, performing spatial analysis, and presentation of results in a more sophisticated way for taking effective decisions by a disaster manager. Development of geospatial database with relevant spatial elements is a critical aspect for any disaster management system. Flood management also involves multiple spatial data elements for studying the flood situation, damage assessment, and generation of damage statistics for decision-making.
2. Technological challenges in flood emergency management
Flood emergency management is one of the important components of flood management. The flood emergency manager needs rapid sharing of flood information from ground to analyze the situation. Advance flood forecasting helps in better planning and reduces losses. Floods usually occur due to heavy rainfall, breaches, or very high tidal waves. The initial information about the rainfall can be collected from local news, crowdsource information, rain gauge stations (RGS), satellite-based information (like TRMM), etc. Extraction of information from heterogeneous data needs syntactical to semantical level conversion. Flood forecasting requires accurate estimates of the spatial and temporal rainfall rates over a catchment (Vieux and Bedient Citation1998). Rainfall information can be collected using ground-based observations as well as using satellite-based rainfall information such as TRMM Multi-satellite Precipitation Analysis (TMPA) (Huffman et al. Citation2010). In India, the emergency management is planned in collaboration of state agencies (State disaster management authority) and central agencies (National disaster management authority). The TMPA data can give the global rainfall estimates, while the interesting question is whether these data are correlated and implemented for the small-scale areas like taluk or district, which means it can be effectively managed on ground. Nowadays, crowdsource data collected by portable smart devices are used as a live input data for situation assessment and planning for relief operations (Muller et al. Citation2015). However, the challenges here are to use the global satellite rainfall data for managing the localized floods, integrating the additional information available in different format (crowdsource) with the rainfall products and integrating these with available databases (Heterogeneous database) for modeling concepts, storage structures, access functionality, etc. (Devogele, Parent, and Spaccapietra Citation1998).
Hudson has conducted the historical analysis and synthesis of the impacts of flood management (Hudson, Middelkoop, and Stouthamer Citation2008). This type of conversation does not facilitate the integration of real-time data for analysis and modeling. Also the collection and transmission of data using physical means is an overhead in the near real-time support for flood emergency management. The developed information system focuses on post-disaster scenarios. The factors affecting the floods like rainfall, river levels, etc. and other factors like current scenario have not been integrated in this framework, hence restricting its visibility. The flood emergency management can be effectively performed by integrating the different factors which affect the current flood situations (Joshi, Simon, and Bhattacharya Citation2011). The factors include cloud cover, rainfall, river flow, disaster news, and ground information (temporal remote sensing images and near real-time ground reporting). The multi-temporal remote sensing satellite images can be used to find the flood damage assessment. Damage assessment can be done by analyzing the pre-disaster remote sensing image and post-disaster remote sensing image of the affected area. For flood mapping, microwave satellite data is of much importance, as it avoids cloud penetration limitation of optical data for flood mapping. Microwave data acquisition needs advance programming (due to limited swath and visibility). The trend of rainfall information (increasing, steady or decreasing) analyzed by satellite rainfall products, ground observation and crowdsourcing data may help the planners select the area to be mapped by remote sensing satellites.
The initial prerequisite shown in Table along with other inputs like media news, crowdsource information, field information, model simulation results, etc. can be integrated to manage the floods efficiently. The important research area is how to gather and integrate the available information. The approaches, which have been discussed to gather the information from different sources for further development of decision support tools, are a complex task because the data are of heterogeneous nature. Instead of transferring the raw data, transferring data as a service could be a better option. Transferring geospatial data can consume more time and bandwidth due to its nature (huge size) as compared to the other data types such as tabular data and noninteroperable. To solve this problem, Open Geospatial Consortium (OSGEO Citation2015) has developed interfaces for publishing spatial data as a service. This spatial service can be served over the web.
In geospatial domain, many researchers had worked on geospatial service chaining and composition. Common object broker architecture demonstration (Papajorgji, Beck, and Braga Citation2004) for generation of distributed components is one of the works which uses remote method invocation/web service technologies enabling different components located apart to communicate. The use of this architecture in geographical distributed application is implemented (Zhu Citation2001). The same approach for addressing natural disasters is difficult to implement, because the information available at different locations are not in same standard, hence cannot be integrated directly as service.
To overcome this, it is proposed to use OGC web mapping specifications in the design and implementation of flood management information system. Other popular models (Dhar and Nandargi Citation2003) have successfully implemented the distributed geospatial services as XML-based web services. These XML-based web services can be integrated by the clients at their end. Although they have employed the OGC specifications to develop the XML-based web services, it still needs lot of rework for integrating the tools provided by different providers and is difficult to integrate directly in any new framework. An open-source framework that enables standard access and processing of data has been proposed for the deployment of new content into geospatial information infrastructure by (Gil et al. Citation2012). The organization of spatial data at one place for managing natural disaster is not possible because different agencies are processing different environmental parameters using various models which have to be integrated as a service and analyzed for managing the disasters.
The main drawback of the above-mentioned frameworks is that they are concentrating on framework to collect distributed geospatial data as a service in non-real-time environment. Applications like flood management need a framework based on principles of service-oriented architecture (SOA). A SOA for handling real-time needs of project has been addressed (IRMOS Citation2015). This project proposes cloud solutions allowing adoption of interactive real-time applications with quality of services (QoS); however, it does not handle geospatial services and components.
The above works based on SOA are mainly concentrating on request response framework and do not fulfill the requirement of real-time disaster management services where response to the event is necessary. The event-driven approach implemented on SOA fulfills this deficiency.
In this paper, we propose an event-driven SOA to manage the flood. It facilitates integration of various distributed, heterogeneous, environmental parameter information as a service which further filters and analyzes with different automatic techniques for generating probable flood events. The archived and future observational data have been collected from different resources as services for the generated flood event which have been analyzed with different spatial models for determining the flood extent. Automated procedure integrated with spatial information system is used to publish, analyze, and make decision for flood management.
The proposed approach will improve the interoperability of data sharing among different agencies and decision support for flood management. The architecture employs the distributed real-time spatial and non-spatial information integrated with rule sets and historical data for identifying the probable events of floods. The probable flood event information can be used to issue alerts in addition of planning the future data acquisition and data gathering as service for flood simulation (using hydrological models), flood mapping (using automated procedures), damage assessment, rescue and relief operations. DSSs coupled with hydrological models’ outputs and advanced GIS tools can be useful for simulating the situation on ground. It can help the planning and decision-making for flood information management.
The objective of this paper is to devise a mechanism with SOA design, driven by events for flood management. In order to achieve this, the following issues have been addressed:
| • | Enabling interoperability of spatial data using open standards to overcome unavailability of spatial data for direct implementation in flood management. Developing an automated procedure for geo-tagging the available non-spatial data. | ||||
| • | Using ontologies for syntactical to semantical interoperability and its application in extracting flood-related information from crowdsource data. Enhancing integration of processing capability of data collected of different parameters for identifying the probable flood events depending on current and historical data. | ||||
| • | SOA driven by active flood events for spatial data gathering and satellite data planning using open-source standards for flood mapping. Automated procedures for flood simulation, delineation, and damage assessment using standard models and advanced GIS tools. | ||||
3. Methodology
Flood management using remote sensing technologies needs integration of different comprehensive techniques for satellite data planning, acquisition, processing, mapping, and decision-making. To enable all these processes in an efficient manner, an architecture is proposed based on SOA basic principles, along with application of event-driven methods to address flood management. It also addresses unavailability of spatial data, available ways to convert non-spatial data into spatial form and interoperability issues for integrating spatial data for flood event identification and management. The SOA provides functionalities like service reusability, but during an actual emergency it is critical to provide the right data, at the right time, displayed logically, to respond and take appropriate action (Johnson Citation2000). Hence, for efficient handling of these informations, the following inputs need to be considered for effective flood management:
| (1) | Capability to generate flood alerts by collecting and analyzing information about different parameters associated directly or indirectly for causing the flood event to the extent possible as real-time service. | ||||
| (2) | Incorporation of event-driven methods on web for faster retrieval, collection and integration of available geospatial data as service associated with the particular flood event using efficient filtering methods. | ||||
| (3) | Development of modular 2D/3D web-based thin clients for visualization and interpretation of collected information. | ||||
| (4) | Automatic planning of temporal geospatial information (satellite imagery) for the flood event to analyze extent, damage, and trend. | ||||
| (5) | Semi-automated models for analyzing the spatial temporal data. | ||||
| (6) | Spatial DSS integrated with advanced GIS tools for decision-making. | ||||
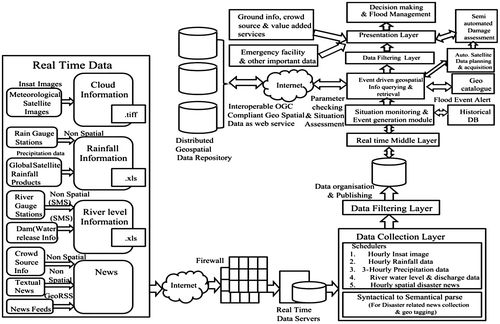
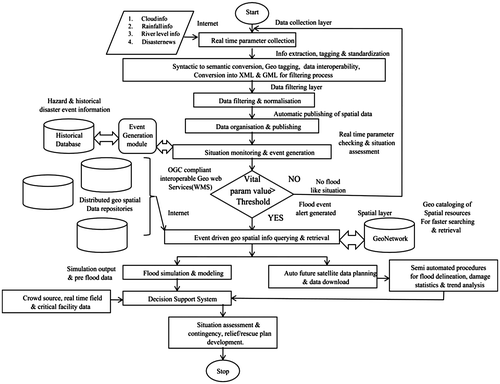
All these requirements specified for efficient flood management have been incorporated by satisfying the core SOA principles (Bean Citation2009) which include loose coupling, interoperability, reusability, discoverability, and governance. Figure shows the architectural components of event-driven SOA for flood management. Detailed methodology adopted in construction of the proposed system is shown in Figure . Here, the main individual components of proposed system are given as the following sections.
3.1. Data collection layer
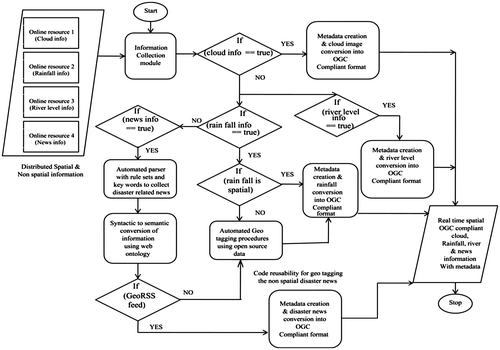
Different environmental parameters monitoring is needed to determine the probability of flood event occurrence. Different nodal agencies are working in different areas to study these parameters. The information generated by them is usually closed and may not be in standard data representation format which can be interoperable and ready to use. Data collection layer is responsible for data collection and interoperability of the collected data. Figure shows the detailed working of data collection layer for collecting spatial/non-spatial distributed information and its conversion into OGC compliant standards for interoperable data creation using reusable code and Web 2.0 technologies implemented on Internet (O’Reilly Citation2005). In India, heavy rains in monsoon season causes flood like situations. INSAT satellite pictures issued hourly by Indian meteorological department (IMD Citation2015c) may be used to analyze the current cloud status. Also the hourly images can be collected together to create simulation for 1-day, 3-day, and weekly cloud movement trend. Automated procedures can be developed to download the INSAT cloud images (.img, or .jpeg) and be archived in folders with the metadata of the image store in XML (for interoperability) to create simulations of cloud movement. The metadata is then can be exported into the postgreSQL open-source database to create user-defined querying and simulations.
Open-source, small, and fast feature rich JavaScript library (JQuery) with html has been used to create simulations showing the cloud movements for 1-day, 3-day, and weekly cloud products (Jquery Citation2015). This thin client has been integrated in the web pages for creating machine independent interoperable cloud products in real time. These cloud products are having twofold benefits for the scientists. First, the property of the clouds may give probable locations receiving high rainfall. Second, once the place is under the flood threat, it will give the scientists a fair visibility to see whether there may be a possibility to get optical satellite data (cloud free) over the area for post-flood event assessment or microwave data (cloud penetration) has to be ordered. Therefore, fastening the satellite data ordering for flood management can be achieved by correlating the cloud products.
Rainfall is another parameter to be analyzed for obtaining the flood event situation. Different agencies can provide global, localized forecasted as well as observed rainfall products using meteorological satellites. Global Ensemble Forecast System provides the global rainfall forecast (Global Ensemble Forecast System Citation2015) and the forecasted data can be correlated with observed rainfall data to obtain accurate results. For correlating, both observed rainfall from satellite products and that from ground products are used. The result section shows the rainfall forecast based on weather research and forecast (WRF) models for 18, 19, and 20 February 2015 (MOSDAC Citation2015). As explained in Section 1, TMPA gives the global rainfall data. This data on degree-by-degree grid basis (.netcdf file format) was downloaded and used for analysis. For making it more reliable, local space-based products were integrated into it. In India, IMD uses space-based product (INSAT images) and ground-based data to provide rainfall information along with standards products, such as temperature, relative humidity, and other weather phenomena (visibility, thunderstorm, etc.). The IMD network of rainfall stations across India is very effective because it covers more than 9361 rainfall stations across the nation (India Meteorological Department Citation2015a). In addition to the rain gauges maintained by the IMD, state governments are maintaining over 3540 RGS whose data are available to the India Meteorological Department in manuscript from Railways, Forest and Agriculture Departments and other organizations maintaining about 5039 RGS. The above-mentioned data are free for viewing and also can be downloaded with authentication (India Meteorological Department Citation2015b). As it is a text data and some of the RGS are not geo-tagged (Open Street Maps Citation2015), it cannot be used directly for spatial visualization and analysis. To geo-tag all the RGS, open-source crowdsource data were used (Open Street Maps Citation2015). The downloaded rainfall information can be converted into spatial interoperable format using Geographic markup language (GML) and published as a spatial web service (WMS, WFS, etc.) for visualization and analysis.
The rain water from different channels joins the main river stream and flows from upstream to downstream. With the sudden high rainfall in upstream, the river receives more accumulated water which may cause flood-like situation downstream. Other than rain water, discharge of water from dams can also create flood like situations. As this is a local phenomenon, local agencies can provide the accurate data. In India, Central Water Commission (CWC) is a government body for surface water resources-related information. CWC has established a network of hydrological observation stations in all the river basins. Hydrometeorological sites of CWC are stations responsible for the collection of hydrological, meteorological, and water quality parameters. National Remote Sensing Centre (Indian Space Research Organisation) in collaboration with CWC has developed India Water Resource Information System (WRIS) project for generation of database and implementation of web-enabled WRIS in India (India Water Resource Information system Citation2015). By automated procedure, the river level water information along with the warnings can be downloaded from WRIS. In addition, some flood prone states like Odisha upload the detailed localized information on web (Odisha State Flood Department Citation2015) in monsoon season (June–October). As this information is non-spatial, it can be downloaded and geo-tagged by crowdsource information (Open Street Maps Citation2015). Then, it is converted into GML for interoperability.
In addition to cloud information, rainfall information, and river water level information, another important parameter is the news. The news related to heavy rains or flood can be extracted from the local media published on Internet. Automatic procedures can extract the flood-related information along with the location. There are various GeoRSS feeds available to be filtered and used as service, but not all can be used in this way. The main challenge is the conversion from syntactic to semantic using web ontology and machine learning. A library of rule sets can be created to make the automatic information extraction related to floods by keeping the past news publishing trend. And the procedures can be a value added to extract the place name from the news and to geo-tag the places as close as possible using open sources and point of interest data with conversion into XML and GML. To get the latest information about the flood event and environmental parameters, dedicated services from different agencies must be setup for the QoS fulfillment.
The data collection layer will gather the information about the four parameters (cloud, rain, river, and news) from the distributed resources in real time. It uses the basic principle of SOA like code reusability, active on demand, information sharing as service for information collection. After gathering this information, it will convert it into machine-independent interoperable format by OGC compliant standards, which are further used for organization into spatial databases.
3.2. Data filtering layer
The main aim of this layer is to filter the data before injecting them into databases. The main issue in automatic real-time data collection is the non-updating or unavailability of information at another side. It may happen that there may be a time lag between data collection and hosting at data provider end. For example, the cloud cover image for 1100 h has not been updated on IMD site till 1300 h, hence the automated program will download the same image four times. It causes the wrong information collection and transmission. To avoid this, an information file about the data has to be provided by the data providers. Using the information file/readme file, metadata about the input has been created with metadata standards (ISO19115/ISO19119/ISO19110 following ISO19139, FGDC, and Dublin Core). To generate metadata of satellite imagery, the open-source GDAL libraries have been customized by C#.net. It will read the input imageries of different sensors and generate metadata for each imagery in ISO 19115 format. The metadata with the geo-referenced satellite image has been catalogued by geo-network cataloguing software. Optimization strategies have to be developed for making a sync between the data already acquired and the present data using metadata information. If the data are same or old, discarding of the same can be done. Efficient procedures coupled with algorithms have been used to avoid data capturing/collection of old unwanted data.
3.3. Data publishing and real time middle layer
Once the data have been filtered, it is ready for organizing into database and for publishing. Different tables are maintained to organize the rainfall, river levels and news data-sets along with the metadata of the cloud images. The point data of rainfall, water level, and news have been organized into open-source relational database (PostgreSQL) for querying and retrieval. The raster data of cloud cover have been organized and catalogued by open-source catalog systems such as geo-network. The organized data have been supplied to spatial models for creating basin-wise and district-wise statistics of rainfall and water level. These hourly detailed statistics have been organized into PostgreSQL. The statistics have been analyzed in coming sections to find the possible flood events. The open-source map servers coupled with automatic scripts have been used to publish the spatial data as WMS (OGC standards) (Open Geo-Spatial Consortium Citation2015) with map projection as Geographic coordinate system and datum WGS 84 (EPSG: 4326).
Once the data have been organized and published, the most important step is the selection of the appropriate data for analysis. The middle layer will take the latest hourly data from the databases and supply it to the upper layer for identifying the flood events. In addition, it integrates the data on basis of 3-h, daily, and weekly data-sets automatically. These temporal products will be input to the modules for comparing the intermediate products with the historical databases.
3.4. Situation monitoring and event generation
The most important module after information collection is the monitoring and event generation module. The historical flood events have been organized into databases with different thresholds for different area and basins. A library of rules and values has been created for rainfall and water level. MOSDAC (Citation2015) has given 1-day, 2-day, and 3-day rainfall forecast using WRF models for complete India. There is a fair chance that the commutative rainfall for 3 days may arise in a flood-like situation, and also there is a need to obtain the detailed information of river basins, districts, or taluks attaining high rainfall, so that the district administrations may get alerted on time.
Automatic procedures will compare the real-time products (hourly, daily, and weekly) with the historical databases and monitor the situation on regular basis. If the real-time parameters are crossing the threshold values for a given basin, a flood event gets generated for that basin/area. Web-based GUI has been designed to standardize and organize the flood event generation process.
For that particular flood event, the program will draw the spatial data/information available at different repositories as a service. Therefore, instead of drawing the complete services, it refines the search criteria and only the data-sets covering the area get consumed as WMS. Along with this, a detailed database of multi satellite raster data-set has been catalogued by geo-network. The data-sets on basis of spatial and temporal extent for the generated flood event have been consumed as a service. These data pulled from different resources act as pre-database for flood management which can be used for simulation (using hydrological models such as GeoRAS, HEC-RAS, etc.), planning, and resource allocation.
Remote sensing imagery is the best option to obtain the post or current flood event information. The event information is encoded by OGC event pattern markup language (EML) specifications. All the possible future satellite coverage (using national or foreign satellites) has been filtered. All the matches over the flood events have been extracted. The user can analyze the cloud patters to discard the optical satellites coverage and plan the microwave data. This event-driven approach can fasten the process of post or during event satellite data planning along with pre-data integration. The pre-event data of the flood event along with the simulations (2D/3D) are ready for the planning and decision-making process.
3.5. Flood mapping and damage assessment
Once the flood event is activated and satellite data are planned by event-driven methods on SOA, the damage can be accessed using the pre- and post-satellite imagery. Automatic procedures have been developed to find out all the possible satellite coverage over the area. The user can select the best coverage for planning the satellite acquisition. Flood extent, inundation area, worst flood affected area, and flood depth have been calculated by semi-automatic procedures. Semi-automated procedures for image correction (including geometric and radiometric), flood area extraction (using filters, threshold/classification, and masking), and flood depth estimation have been developed with open-source softwares. Quantum GIS has been customized for semi-automated flood delineation using optical data and NEST (Next ESA SAR Toolbox). The flood area and depth once calculated have been interlinked with the socioeconomic data giving the statistics of people, house, or village affected and much more needed for planning rescue and relief operations.
3.6. Presentation layer and decision-making
To analyze the data and results, a thin client web-based application is needed. A 2D spatial viewer with GIS tools has been developed for data visualization. The viewer is capable of integrating the different OGC compatible web service, ground data, emergency/critical facility databases, crowdsourced data, model simulation, and flood products. For depth visualization, a 3D viewer has been customized using open-source software Cesium.
The decision-makers can overlay the pre- and post-images along with the emergency facility and can draw plan of action for relief and rescue. Advanced GIS tools like shortest path, facility finding in a vicinity (proximity analysis), resource distribution can be implemented using this. After drawing the plan of action, the decision-makers can take a print online and send soft copy and hard copy to the teams on ground in near real time.
4. Results and discussion
Floods are natural phenomena which are difficult to prevent but can be managed by proper planning and implementation. Distributed information and resources need to be considered for taking decisions. Transferring, organizing, and analyzing the information at the time of flood is an overhead. To minimize this, SOA is implemented for flood management. It has the advantage of utilizing the information as a service, which can be reused without extra efforts. SOA has the functionality of model-driven implementation facilitating development of new functions rapidly. By utilizing this property, an event-driven SOA is proposed and implemented for managing the flood disaster. The software modules developed on event-driven SOA to collect the details about the various environmental factors (cloud cover, rainfall, and river level) effecting flood situation have the advantage of tracking the status continuously. On crossing of parameter values above the thresholds, automatic flood event alerts get generated and auto procedures get activated for satellite data planning, satellite data processing, flood extraction, situation analysis, and decision-making by utilizing the distributed information as a service.
4.1. Factors affecting flood situation
4.1.1. Cloud cover information
One of the important factors generating or affecting the existing flood situation is cloud cover and cloud movement. The scientists can obtain an estimation of the probable places of heavy rains by analyzing the cloud movement. Analysis of cloud patterns will help the scientist to plan the satellite imagery for addressing the reported flood event. For example, the dense cloud erased the possibility of getting the optical data-sets, hence we have to program the microwave data.
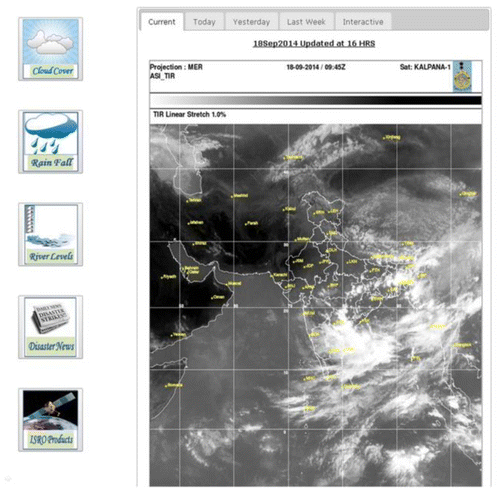
Indian meteorological department provides the hourly KALPANA satellite images, and automatic procedures are developed by C#.net to download the hourly data from IMD website. The metadata of the downloaded images has been created and organized in PostgreSQL and file-based repository for further analysis. PHP scripts with JQuery have been programmed to create the simulation of the downloaded satellite images on basis of current, 1-day, 2-day, 3-day, and weekly cloud cover simulation. Figure shows the web page of the cloud cover simulation. Furthermore, an interactive module has been developed, by which the user can get a cloud simulation by providing a period time or day range.
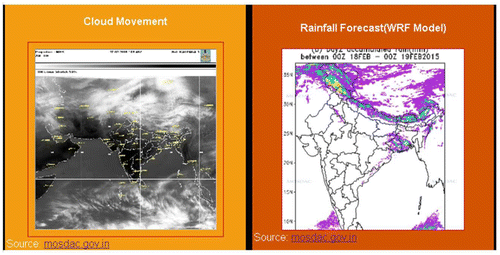
To illustrate the concept of event-driven approach, the high rainfall incidence of 17 February 2015 in Jammu and Kashmir region has been taken. The KALPANA images analyzed over the period of 15/02/2015, 16/02/2015, and 17/02/2015 showed dense clouds over the region. It indicates the possibility of heavy rainfall in this region, which may cause flood event. Figure shows the cloud simulation of 15−17 February 2015 over Jammu and Kashmir region and 3-day forecast using WRF model (source: http://www.mosdac.gov.in).
4.1.2. Rainfall information
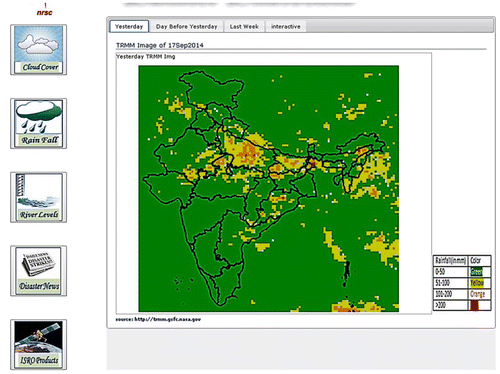
The high rainfall can increase the severity of the flood situation, and it is very important to keep track of the rainfall. Automatic software module has been developed by C#.net to download the observed 3-hour rainfall data from TRMM website. Automatic models have been developed to integrate and tag the tile-based (25 km × 25 km) observed rainfall to basin and taluk level. This rainfall information has been organized into PostgreSQL database. To publish this information as a web map service, open-source UMN map server has been customized. Historical available rainfall database has been organized and basin-wise, taluk-wise threshold libraries for maximum rainfall causing flood has been created. After the observed rainfall being compared with the historical rainfall, the rainfall is visualized depending on the threshold value and alerts are created. PHP scripts with JQuery have been programmed to create the simulation of the downloaded TRMM observed rainfall products on basis of current, 1-day, 2-day, 3-day, and weekly rainfall simulation. Figure shows the TRMM observed rainfall data on spatial viewer. In addition, an interactive module has been developed by which the user can obtain the rainfall simulation for a period by providing a time or day range.
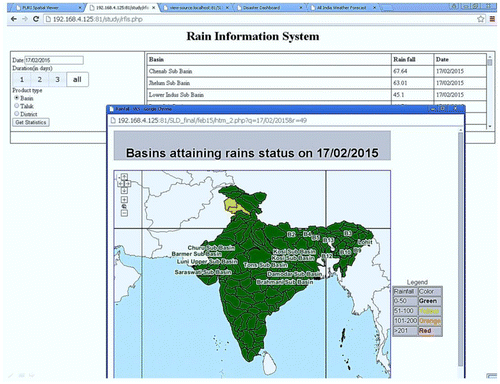
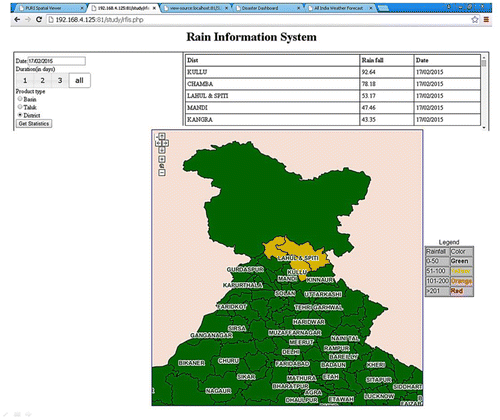
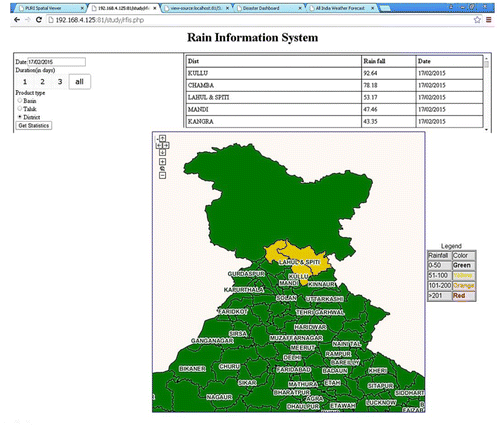
For the probable high rainfall event in Section 4.1.1, the observed rainfall for the particular region has been pulled as a service from TRMM online repository, using event-driven approach. The detailed rainfall products (Basin-wise, District-wise, and Taluk-wise) for 17 February 2015 have been derived automatically using the TRMM observed rainfall as shown in Figures for the affected area. In addition of this, forecasted rainfall (Figure ) for this event has been pulled as a service and integrated for further satellite data planning. By comparing the different information available, a flood event has been generated if it is toward the flood like situation. All the historical and current information for this region have been pulled from different resources as a service to manage it. This shows the event-driven SOA for flood management.
The same procedure has been adopted for the forecasted rainfall products (WRF model) downloaded from the ISRO MOSDAC. By correlating the observed and forecasted value for a taluk district, an automatic flood disaster event has been generated if it is exceeding threshold rainfall value.
4.1.3. River level information
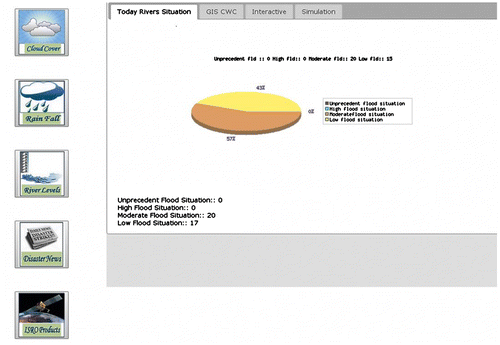
The river levels at different gauge stations have been provided by CWC of India. The software modules have been developed to obtain the water levels at different gauge stations. The information about the stations with precedent, high, moderate flood situations has been organized and visualized. Figure shows the river level information collection. The stations having the flood situation with river level attribute information can be visualized for the spatial viewer.
4.1.4. Disaster news
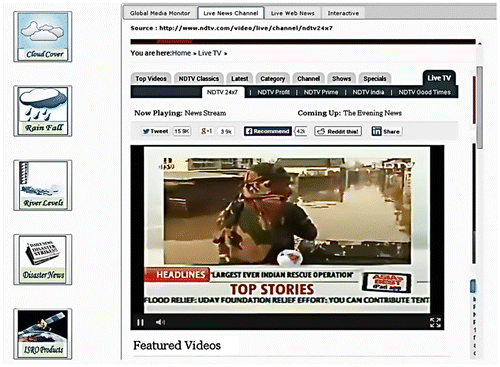
A web-based parser has been developed to fetch the disaster news from internet resources. RSS and GeoRSS feeds from authenticated web sources (National news TV channels and newspapers) about the disaster have been collected and integrated into the viewer. The collected news about the flood event is organized into the database and visualized for the spatial viewer. In addition, the live news feed in audio/video format has been integrated in this. Figure shows the disaster news for generated flood event (Jammu and Kashmir)
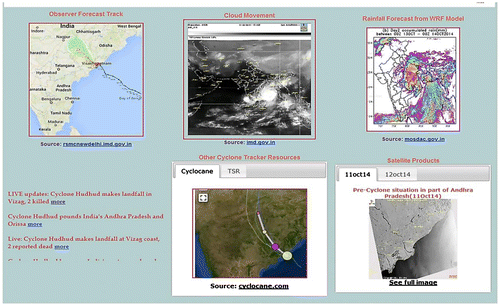
On basis of the above-mentioned modules, the possible disaster event has been generated and the situation can be monitored. The resources can be programmed and mobilized using this. Once the flood disaster event has been generated, all the related information was pulled from different sources as a service. Figure shows the web-based disaster dashboard consuming the distributed heterogeneous information at single point as a service for Cyclone Hudhud. With the help of the above-developed components, the managers can find the probable flood events and also can keep track of the situation of the active flood disaster event.
4.2. Event-based satellite data planning and semi-automatic flood product generation process
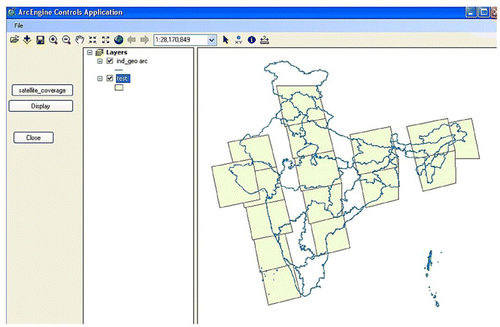
Once the disaster event is generated, it is needed to program the temporal satellite data so that flood inundation can be extracted and rescue relief operations can be planned. Software module for reading the possible satellite coverage for a given event has been developed. All the satellite month-wise coverages have been organized into the database. Depending on the location of the event, the possible coverage will be available and the user can select/confirm a particular scene for acquisition. Figure shows the module for selecting the satellite coverage (Radarsat 2 SCAN SAR wide coverage over India for August 2014).
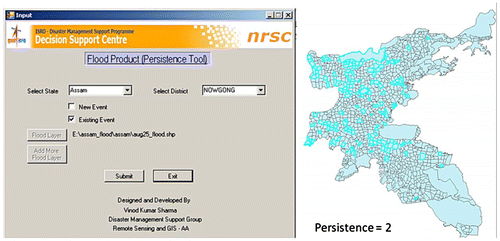
Once the satellite data have been ordered, a semi-automatic flood product generation chain is activated and it downloads the data. Once the satellite data have been downloaded, it becomes registered. Classification method and different filters have been programmed to delineate flood using the pre-master image. Different flood products are generated like persistence map and other spatial products. Figure shows the flood persistence map for Nowgong district of Assam where flood occurred for two times.
4.3. Flood information system
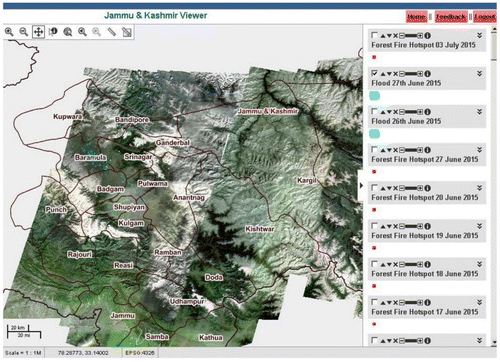
A web-based spatial viewer with advanced GIS tools has been developed using open layers2.0 and JavaScript for integrating the spatial flood products and related spatial layers as a service. The GIS tools facilitate the disaster managers to analyze the information in 2D domain to make the plan of action for managing the floods. Figure shows the web-based spatial viewer for Jammu and Kashmir flood in 2015, consuming distributed web map services, integrated with GIS tools for flood management.
Online analysis tools such as swipe tool for analyzing pre- and post-scenario and results of other models for finding affected and unaffected roads, flood layer, and affected settlements are incorporated into the GIS viewer. In addition, different essential databases like IDRN (Indian Disaster Resource Inventory) containing information about the equipment and resources have been consumed as a service and integrated into the viewer for decision-making. Hence, event-driven SOA is successfully implemented and demonstrated to consume the information from different resources at a central point as a service for managing the flood disaster.
5. Conclusions
The flood management needs multidisciplinary team coordination. For managing floods on ground advance alerts, the real-time inundation products with rapid decision on time are needed. For advance warning and flood product generation, the analysis of different environmental parameters and other data-sets is also needed. These data-sets are distributed and available among different agencies in nonstandardized format. The SOA implemented on web has been utilized as an efficient solution to collect the data as service. The data collected is heterogeneous in nature. Open geospatial standards have been applied to the data collected with automated procedures for standardizing these data-sets. The standardized data-sets of hydrological parameters were regularly compared with historical data-sets using efficient automated procedures coupled with algorithm to determine the flood alerts. The open-source EML has been employed to plan and collect the post/during flood event satellite imagery. Distributed spatial data have been driven and integrated by open-source catalog systems to obtain the spatial data as a service. The data collected as a service are used as input for flood simulation modeling and generation of 2D/3D simulation. 3D open-source viewer has been used to analyzing the model results. Semi-automated procedures were developed for generating the flood products. Spatial DSS coupled with advanced GIS tools is developed for flood products, simulation visualization and decision-making. Hence, a comprehensive framework by integrating multiple resources information, computational modules, algorithms, open-source softwares, and technologies has been proposed and implemented as a solution for flood disaster mapping and management.
Notes on Contributors
Vinod Kumar Sharma is a scientist in Disaster Management Support Division of National Remote Sensing Centre (ISRO), India. He received his Master’s degree in Information Systems from Netaji Subhas Institute of Technology, Delhi University, India. His field of expertise includes Web-based Geoinformatics, Spatial DBMS, DSS/SDSS, Open-source GIS, Mobile application development, automation, spatial analysis, and processing on web.
G Srinivasa Rao is the Head of Disaster Management Support Division of National Remote Sensing Centre (ISRO), India. His current research includes flood management using remote sensing techniques.
E Amminedu, professor, is the Head of Division of Geo Engineering Department of Andhra University, Andhra Pradesh, India. He is mainly engaged in research and education based on remote sensing and GIS.
P V Nagamani, PhD, is a scientist in Oceanography Group of National Remote Sensing Centre (ISRO), India. Her area of expertise includes ocean modeling using remote sensing data.
Abhinav Kumar Shukla is a scientist in Disaster Management Support Division of National Remote Sensing Centre (ISRO), India. His area of expertise includes flood event modeling.
K Ram Mohan Rao, PhD, holds a Doctoral degree in Computer Science from Kumaun University, Nainital, India. He has research expertise in the fields of Spatial Databases. Presently, he is working as manager in National Database for Emergency Management, in Disaster Management Support Group, NRSC (ISRO), India. His interests include open-source technologies in the field of geoinformatics.
V Bhanumurthy is the Group Director of Disaster Management Support Group of National Remote Sensing Centre (ISRO). He is heading ISRO disaster management activities at NRSC, ISRO, India.
Acknowledgments
The authors would like to thank Dr V. K. Dadhwal and Dr P. G. Diwakar for their guidance and support on carrying out this research.
References
- Bean, J. 2009. SOA and Web Services Interface Design: Principles, Techniques, and Standards. Burlington, MA: Morgan Kaufmann.
- Devogele, T., C. Parent, and S. Spaccapietra. 1998. “On spatial database integration.” International Journal of Geographical Information Science 12 (4): 335–352. doi:10.1080/136588198241824.
- Dhar, O. N., and S. Nandargi. 2003. “Hydrometeorological Aspects of Floods in India.” Natural Hazards 28 (1): 1–33. doi:10.1023/A:1021199714487.
- Gil, J., L. Díaz, C. Granell, and J. Huerta. 2012. “Open Source Based Deployment of Environmental Data into Geospatial Information Infrastructures.” International Journal of Applied Geospatial Research 3 (2): 6–23. doi:10.4018/jagr.2012040102.
- Global Ensemble Forecast System. 2015. “GEFS Forecasted Images.” Accessed June 7, 2015. http://www.ncdc.noaa.gov/data-access/model-data/model-datasets/global-ensemble-forecast-system-gefs
- Hall, J. W., I. C. Meadowcroft, P. B. Sayers, and M. E. Bramley 2003. “Integrated Flood Risk Management in England and Wales.” Natural Hazards Review 4 (3): 126–135. doi:10.1061/(ASCE)1527-6988(2003)4:3(126).
- Hudson, P. F., H. Middelkoop, and E. Stouthamer. 2008. “Flood Management Along the Lower Mississippi and Rhine Rivers (The Netherlands) and the Continuum of Geomorphic Adjustment.” Geomorphology 101 (1–2): 209–236. doi:10.1016/j.geomorph.2008.07.001.
- Huffman, G. J., R. F. Adler, D. T. Bolvin, and E. J. Nelkin. 2010. “The TRMM Multi-Satellite Precipitation Analysis (TMPA).” In Satellite Rainfall Applications for Surface Hydrology: Hossain, F., Gebremichael, M. (Eds.), 3−22. New York: Springer. doi:10.1007/978-90-481-2915-7_1.
- India Water Resource Information system. 2015. “India River and Hydro Meteorological Information.” Accessed March 21, 2015. http://india-wris.nrsc.gov.in/wrpinfo/?title=Hydro-meteorological_sites
- India Meteorological Department. 2015a. “IMD Automatic Rain Gauge Stations.” Accessed June 19, 2015. http://www.imdaws.com/ViewArgData.aspx
- India Meteorological Department. 2015b. “IMD DRF Stations.” Accessed June 19, 2015. http://www.imdpune.gov.in/research/ndc/rainfall/DRF_STN.htm
- India Meteorological Department. 2015c. “IMD Satellite Images.” Accessed January 11, 2015. http://www.imd.gov.in/section/satmet/dynamic/insatsector-vis.html.
- IRMOS Project. 2015. “Interactive Realtime Multimedia Applications on Service Oriented Infrastructures Schema.” Accessed February 14, 2015. http://www.irmosproject.eu/
- Johnson, R. 2000. “GIS Technology for Disasters and Emergency Management.” An ESRI white paper. http://www.esri.com/~/media/files/pdfs/library/whitepapers/pdfs/disastermgmt.pdf
- Joshi, P. C., B. Simon, and B. K. Bhattacharya. 2011.“Advanced INSAT Data Utilization for Meteorological Forecasting and Agrometeorological Applications.” In Challenges and Opportunities in Agrometeorology: Attri, S. D., Rathore, L. S., Sivakumar, M. V. K. and Dash, S. K. (Eds.), 273−285. Berlin: Springer. doi:10.1007/978-3-642-19360-6_21.
- Jquery. 2015. “Jquery Open API’s.” Accessed January 16, 2015. http://jquery.com/
- MOSDAC. 2015. “MOSDAC WRF Products.” Accessed March 16, 2015. http://www.mosdac.gov.in/rain.jsp
- Muller, C. L., L. Chapman, S. Johnston, C. Kidd, S. Illingworth, G. Foody, A. Overeem, and R. R. Leigh. 2015. “Crowdsourcing for Climate and Atmospheric Sciences: Current Status and Future Potential.” International Journal of Climatology 35: 3185–3203. doi:10.1002/joc.4210.
- Odisha State Flood Department. 2015. “Odisha Department of Daily Flood Bulletin Page.” Accessed July 20, 2015. http://dowrorissa.gov.in/Flood/DailyFloodBulletin.htm
- Open Street Maps. 2015. “OSM India Maps.” Accessed July 21, 2015. https://www.openstreetmap.org
- Open Geo-Spatial Consortium. 2015. “OSGEO Products.” Accessed March 1, 2015. http://www.openspatial.org
- O’Reilly, T. 2005. “Web 2.0: Compact Definition.” Accessed March 1, 2015. Message posted to http://radar.oreilly.com/archives/2005/10/web_20_compact_definition.Html
- Panda, P. K. 2014. “Vulnerability of Flood in India: A Remote Sensing and GIS Approach for Warning, Mitigation and Management.” Asian Journal of Science and Technology. 5 (12): 843–846.
- Papajorgji, P., H. W. Beck, and J. L. Braga. 2004. “An Architecture for Developing Service-Oriented and Component-based Environmental Models.” Ecological Modelling 179 (1): 61–76. doi:10.1016/j.ecolmodel.2004.05.013.
- Sharma, P. K., R. Chopra, V. K. Verma, and A. Thomas. 1996. “Technical Note Flood Management using Remote Sensing Technology: The Punjab (India) Experience.” International Journal of Remote Sensing 17 (17): 3511–3521. doi:10.1080/01431169608949166.
- Simonovic, S. P. 1999. “Decision Support System for Flood Management in the Red River Basin.” Canadian Water Resources Journal 24 (3): 203–223. doi:10.4296/cwrj2403203.
- Vescoukis, V., N. Doulamis, and S. Karagiorgou. 2012. “A Service Oriented Architecture for Decision Support Systems in Environmental Crisis Management.” Future Generation Computer Systems 28 (3): 593–604. doi:10.1016/j.future.2011.03.010.
- Vieux, B. E., and P. B. Bedient. 1998. “Estimation of Rainfall for Flood Prediction from WSR-88D Reflectivity: A Case Study, 17–18 October 1994.” Weather and Forecasting 13 (2): 407–415.
- Zhu, X. 2001. “Developing Web-based Mapping Applications Through Distributed Object Technology.” Cartography and Geographic Information Science 28 (4): 249–258. doi:10.1559/152304001782152973.
- Zlatanova, S., T. Ghawana, A. Kaur, and J.M.M. Neuvel. 2014. “Integrated Flood Disaster Management and Spatial Information: Case Studies of Netherlands and India.” In ISPRS Technical Commission VIII Symposium, Hyderabad, India, 9−12 December 2014, ISPRS Archives Volume XL-8, 2014. International Society for Photogrammetry and Remote Sensing (ISPRS). doi:10.5194/isprsarchives-XL-8-147-2014

