
Abstract
This article introduces a novel low rank approximation (LRA)-based model to detect the functional regions with the data from about 15 million social media check-in records during a year-long period in Shanghai, China. We identified a series of latent structures, named latent spatio-temporal activity structures. While interpreting these structures, we can obtain a series of underlying associations between the spatial and temporal activity patterns. Moreover, we can not only reproduce the observed data with a lower dimensional representative, but also project spatio-temporal activity patterns in the same coordinate system. With the K-means clustering algorithm, five significant types of clusters that are directly annotated with a combination of temporal activities can be obtained, providing a clear picture of the correlation between the groups of regions and different activities at different times during a day. Besides the commercial and transportation dominant areas, we also detected two kinds of residential areas, the developed residential areas and the developing residential areas. We further interpret the spatial distribution of these clusters using urban form analytics. The results are highly consistent with the government planning in the same periods, indicating that our model is applicable to infer the functional regions from social media check-in data and can benefit a wide range of fields, such as urban planning, public services, and location-based recommender systems.
1. Introduction
Understanding the distribution of different functional regions (e.g. residential, business, and transportation areas, etc.) in a city is an important theme in urban studies (Antikainen Citation2005; Cranshaw et al. Citation2012; Yuan, Zheng, and Xie Citation2012). For many years, the exploration of the functional regions in urban areas has mainly relied on socio-demographics data and aggregate areas with high economic interaction (Karlsson and Olsson Citation2006). However, the process of updating such data is laborious and time-consuming (Wu et al. Citation2009), so the results are often stagnant and cannot reflect the dynamic property of local urban areas.
With the advent of the era of big data, two kinds of geospatial big data, movement-based data and activity-based survey data, have been widely used to understand our socioeconomic environments (Liu et al. Citation2015). To uncover the association between the spatio-temporal patterns of human movements and the functional regions, a branch of research attempted to utilize the movement-based data, including mobile phone data (Reades, Calabrese, and Ratti Citation2009; Toole et al. Citation2012), taxicab data (Qi et al. Citation2011; Liu et al. Citation2012), smart card data (Liu et al. Citation2009; Pelletier, Trépanier, and Morency Citation2011), and Wi-Fi data (Calabrese, Reades, and Ratti Citation2010). Unlike the movement-based data, the activity-based survey data are adopted to explore spatio-temporal activity patterns and then illustrate the functional regions of a city (Steiner Citation1994; Kockelman Citation1997). Both of the two kinds of data have their own limitations. The activity-based survey data require long-term observation, high time cost, and high financial cost (Wu et al. Citation2009; Toole et al. Citation2012). Moreover, the outcomes usually do not scale and only uncover a partial depiction of characteristics of functional regions (Cranshaw et al. Citation2012). For the movement-based data, they do not contain the travel demand information and cannot be used to depict the detailed characteristics of regions (e.g. the temporal variation of travel demands). Therefore, the cluster type is inferred by the empirical analysis and it is hard to distinguish the non-home/work activities (Jiang, Ferreira, and Gonzalez Citation2012). To overcome the limitations mentioned above, Yuan, Zheng, and Xie (Citation2012) considered both point of interests (POIs) data of a region and human mobility data to identify functional regions and inferred users’ travel demands by linking the movement with POI data. However, this method may fail because it is difficult to precisely match human movements with POIs. For instance, one individual goes to a shopping mall and then to a campus. If the shopping mall is not included in the POI data-set, his/her movement will be linked to the education purpose instead of shopping.
Fortunately, with the proliferation of social media, such as FaceBook, Twitter, Foursquare, and Flickr, millions of registered members are recording their surroundings and sharing their movement routes with friends via check-in (Noulas et al. Citation2011). Unlike cell phone and car trajectories data derived from GPS trackers, check-in data not only contain location information, but also record users’ travel demands. Although false check-in exists (e.g. one user who is not actually at airport pretends to create his/her check-in location at airport), Cheng et al. (Citation2011) have announced a series of rules to filter out the false check-in records. Wu et al. (Citation2014) also proposed five criteria to eliminate the fake check-ins and trips. As a consequence, check-in data have advantages to depict the intra-urban functional regions than the previous three kinds of data. Cranshaw et al. (Citation2012) discovered the suburban areas, named Livehoods, from check-in data. Silva et al. (Citation2012) utilized check-in data to measure the dynamics of eight cities in a large scale. However, they did not systematically examine the interdependence between the functional regions and human activity via check-in data.
In this article, we proposed a novel model via a low rank approximation (LRA) method to infer intra-urban functional regions from a data-set containing about 15 million check-in records during a year-long period in Shanghai, China. We found that a series of latent structures, entitled Latent Spatial-Temporal Activity Structure (LSTAS), can well represent the underlying associations between the functional regions and human activities. Additionally, we showed that the LSTAS had clear geographical meanings, such that LSTAS could serve as a feature indicator to urban activity structures. With the indicator function, LSTAS was then used to identify the territory of functional regions without any predefined functional region classification. The results show that our model well infers the functional regions of a city.
2. Materials and methods
2.1. Data and study area
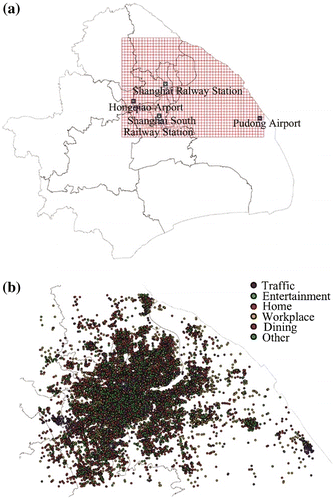
In this study, we investigated about 15 million social media check-in records during a year-long period from September 2011 to September 2012 in Shanghai, the city with the largest population in China (Chan Citation2007). These records have been applied to model the intra-urban human mobility patterns (Wu et al. Citation2014) and are also used as a partial set to investigate inter-urban trips and spatial interactions (Liu et al. Citation2014). Considering both the computational efficiency and heterogeneous distribution of check-in data points, we chose the central part of the city (50 km × 35 km) as the study area and divided it into square grids (1 km × 1 km). As shown in Figure (a), the red lattices represent the study area with two airports (Pudong Airport and Hongqiao Airport) and two railway stations (Shanghai Railway Station and Shanghai South Railway Station). Moreover, we grouped the travel demands into six types: Home (H), Transportation (Tr), Work (W), Dining (D), Entertainment (E), and Others (O), since some check-in demand-tags signified the similar demand. As shown in Figure (b), one check-in record is geo-referenced as one point according to its location, where different colors of the points denote different activities.
Figure 1. Study area (Shanghai, China) (a), and spatial distribution of check-in data by activities (b).
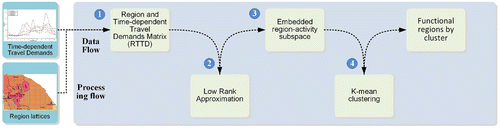
2.2. Model framework
In this article, the proposed model was constructed mainly according to the following four steps (Figure ).
| (1) | Construct a region and temporally dependent travel demands matrix. | ||||
| (2) | Adopt a LRA method to find the best estimation of the original matrix. | ||||
| (3) | Extract the LSTAS from the LRA matrix. | ||||
| (4) | Adopt the K-means clustering algorithm to aggregate regions into several significant types according to several top LSTAS. | ||||
Figure 2. Flow chart of the proposed method.
2.3. Matrix of region and temporally dependent travel demands
This article focuses on the underlying relationship between functional regions and human activity. We have three basic variables.
| (1) |
| ||||
| (2) |
| ||||
| (3) |
| ||||
The human activity demands are temporally relevant in nature. For instance, lunch and dinner are not the same demand from the view of semantics and will also cause different impacts on corresponding travel activities. Therefore, we used the Cartesian product of travel demands and time interval set to denote the temporally dependent travel demands (TTD) which can be expressed as:(1)
The subregion of G over TTD forms a region and TTD relation matrix is denoted by R-TTD or M for short.(2)
where ug,td is the intensity of the TTD in the subregion, the occurrence frequency of the travel demand d at time t conditioned within the subregion g.
2.4. Exploring the low-dimensional representation via LRA
In order to explore the lower dimensional representation, analyze the eigen-structures, and interpret the interdependence between functional regions and human activities, we adopted a LRA method. Because this method can explore the latent structure between two associated factors in the high-dimensional matrix, LRA has been widely applied in the fields of information retrieval (Deerwester et al. Citation1990), face recognition (Ma et al. Citation2012), and salient object detection (Peng et al. Citation2013). The principal component analysis (PCA) could also be applied to explore the eigen-structure. For example, Eagle et al. suggested that human movement patterns could be represented as a repeating structure, termed eigen-behaviors (Eagle and Pentland Citation2009). Researchers have connected eigen-behaviors with functional regions and used the term, eigen-place, to identify the recurring patterns of urban dynamics (Reades, Calabrese, and Ratti Citation2009; Calabrese, Reades, and Ratti Citation2010). However, PCA has some limitations. With the covariance matrix, the PCA method has to analyze the spatial and the temporal characteristics as two separate sets of features. By contrast, the LRA method could project the spatial or the temporal characteristics simultaneously into the same subspace directly which could show the connections between the functional regions and human activities. The details of the LRA method are introduced as follows.
| (1) | Any matrix can be decomposed into two parts as (Candès et al. Citation2011): | ||||
(3)
where is a LRA matrix of M and N is a perturbation matrix which indicates noise. The best rank-k estimate of
can be denoted as:
(4)
| (2) | The matrix | ||||
(5)
where is a m × m unitary matrix (i.e.
);
is a n × n unitary matrix (i.e.
);
is a diagonal matrix constraining the singular values σi of
. The
can be rewritten as the sum of rank-1 matrices:
(6)
where is larger than
,
; r equals to the number of non-zero singular values (it also equals to the rank of
).
To construct , the value of r should be determined. It is suggested to use the Frobenius norm to evaluate the similarity between the
and the original matrix M as:
(7)
where .
2.5. Uncovering the latent urban spatio-temporal activity structure
Based on Equations (Equation6(5) ) and (Equation7
(6) ), the LRA method could be viewed as a transformation process for projecting a high-dimension matrix to a series of low-dimensional subspaces. These subspaces can be regarded as multiple intrinsic feature space embedded in the original high-dimension data space. Hence, we treated this kind of subspaces as the LSTAS. One LSTAS is viewed as the combination of the columns in the matrix
and the columns in the matrix
, correspondingly. For example, the combination of
’s first column and
’s first column can be viewed as the first LSTAS. Considering that each column in matrix
is orthogonal to the other, one column in
denotes one unique feature among regions, called LSTAS for the spatial characteristics (LSTAS-SC). Similarly, each column in matrix
is also orthogonal to the other and one column in
can be viewed as one unique feature among TTD, called LSTAS for TTD characteristics (LSTAS-TTDC). As a result, one LSTAS can express the corresponding relationship between the spatial distribution pattern and TTD.
2.6. Identifying the territory of functional regions
This step aggregates similar formal regions in terms of LSTAS by performing the K-means clustering. In particular, each row of indicates the characteristics distribution of original subregion in LSTAS and each row of
denotes the characteristics distribution of original TTD in LSTAS. As a consequence, this result allows us to simultaneously project the subregions and TTD into the same subspace for identifying the territory of functional regions, indicating that the i, j cell of the
can be obtained by the dot product of the i and j row of matrix
as:
(8)
where is the new coordinate for the original subregions and
is the new coordinate for the original TTD.
Then we used the K-means clustering algorithm to aggregate similar subregions and TTD. Therefore, one cluster indicates one functional region which has two kinds of characteristics: the spatial distribution and the function characteristics (the set of TTD in a cluster). K-means clustering algorithm is widely used and has a number of derived methods (Jain Citation2010), such as K-medoids, K-SVD (Aharon, Elad, and Bruckstein Citation2006). However, the K-means algorithm has two problems: the determination of the distance and the selection of the optimal number of clusters.
The study is based on trait representation by vectors in the feature space. Therefore, we used the cosine distance to measure the dissimilarity of those relationships which is a common method to measure the similarity between two vectors. Moreover, we should estimate the optimal number of clusters for the K-means algorithm. That is to say, it is necessary to find the optimal number of clusters for the inherent partition of the data. The most common approaches used to validate the clustering results include the following three aspects. First, in the method of external criteria, previous knowledge about the data was used as external reference. Second, the method of internal criteria is based on the quantity and intrinsic features of the data and no prior knowledge about the data is introduced. Third, in the method of relative criteria, the best clustering scheme is selected according to a pre-specified criterion without any statistical test (Brun et al. Citation2007). Therefore, we used three typical internal validation criteria: Dunn’s index (Dunn Citation1974), Silhouette index (Rousseeuw Citation1987), and Davies–Bouldin index (DBI) (Davies and Bouldin Citation1979) to determine the optimal number of clusters. Higher Dunn’s index or Silhouette index indicates a better clustering number, while the opposite holds for DBI.
3. Results and analysis
In this work, we set the number of demand types as and the number of time intervals as
since 1-h intervals were adopted as the temporal unit for analysis. The study area was divided into square grids (1 km × 1 km). The total number of grids is
after filtering out water areas.
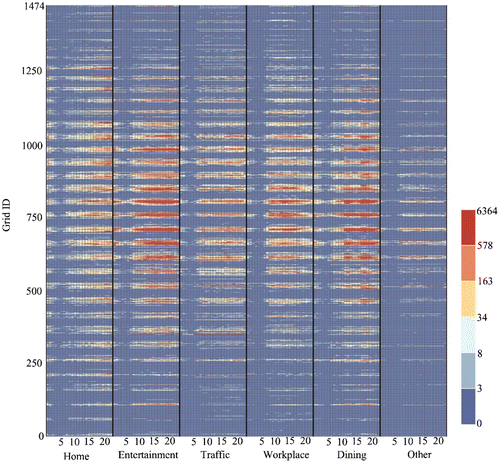
3.1. Visualization of the region-TTD matrix
In order to give a concrete description of the data-set, we visualized the region-travel demand matrix M. As shown in Figure , the horizontal axis represents the six demands in 24 h and the vertical axis represents the ID sequence of sample grids. This figure illustrates the compound functions of each grid. Some grids mainly expose one kind of demand and the frequencies of other demands are relatively low, while some grids have high frequency among all the demands. The value of the cell, for example, (E15, 760) equals to 493. That is to say, the occurrence frequency of the travel demand E in the 15th time interval (from 14:00 to 15:00) within region 760 is 493. Some grids show the high significance in multiple TTD (i.e. nearby grid 750) in spatial distribution. On the contrary, some grids are characterized by single TTD (i.e. nearby grid 1250 or grid 250), or have no obvious features (i.e. nearby grid 0 or grid 1474). With regard to the temporal characteristics, some TTDs are highly correlated with others. For example, the frequencies for two demand types of Home and Entertainment are very high after 19:00, while the frequencies for Traffic and workplace are relatively high in the daytime. Such characteristics indicate that the matrix M contains redundant structures and a lower dimensional representation exists.
Figure 3. Region-TTD matrix.
3.2. Lower dimensional representation of region-TTD matrix
To explore a lower dimensional representation and compare it with original matrix M, according to Equation (Equation7
(6) ), it is required to determine an optimal r. We determined the value of r considering the following three aspects: the distribution of singular values, the reconstruction accuracy compared with M, and the reconstruction accuracy compared with the actual temporal variation of travel demands.
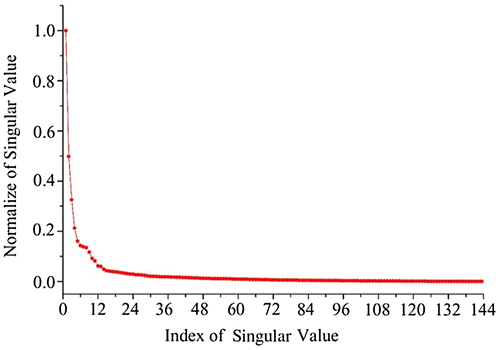
3.2.1. Distribution of singular values
We set normalized singular values (ratio to the maximum) as the vertical axis and index of singular with order from high value to low one (Figure ). In Equation (Equation6(5) ), the
can be written as the sum of r rank-1 matrices. From the view of significance, most features can be represented by the first few principal structures. Less required singular values generally indicate more notable features. As shown in Figure , the first 30 singular values account for about 90% of energy in M. Such a distribution also tells us that the original matrix M includes a large number of redundant information, which covers the most valuable and important information about the relationship between the functional region and human activity in the urban area.
Figure 4. Distribution of singular values.
3.2.2. Reconstruction accuracy compared with M
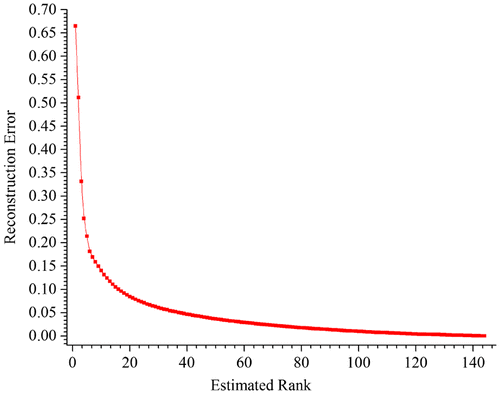
Using Equation (Equation7(6) ), we can calculate the dissimilarity between the reconstruct matrix
and original matrix M with different values of r, as shown in Figure . The horizontal axis represents the number of r and the vertical axis represents the reconstruction error. When r equals to 30, the reconstruction error is only 0.06.
Figure 5. Reconstruction accuracy compared with the observed matrix.
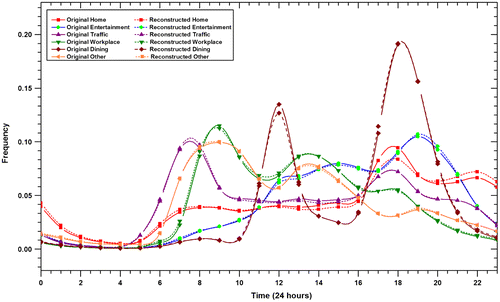
3.2.3. Reconstruction accuracy compared with the real temporal variation of travel demands
The above two methods indicate that it is appropriate to set r to be 30. Figure plots the difference between the reconstruct TTD and original TTD when r = 30. The horizontal axis represents the time intervals in one day, and the vertical axis represents the frequency of travel demands. We used different colors to distinguish the travel demands and adopted different lines to discriminate the reconstructed temporal variation of demands from the original ones (dash line for the reconstructed demand and solid line for the original demand). Figure illustrates that the original distribution of TTD can be well approximated when r = 30.
Figure 6. Reconstruction accuracy compared to original temporal variation of travel demands.
3.3. Interpreting the embedded region-activity subspace
In this research, we set r = 30, and there are 30 LSTAS to represent the relationship between the functional region and human activity. Each LSTAS consists of two kinds of structures: the spatial structure (one of the columns in ) and the TTD structure (one of the columns of
). To have a better understanding of LSTAS, we take the top six LSTAS as examples. Figure illustrates the TTD characteristics of the top six LSTAS. Correspondingly, Figure shows the spatial characteristics of the top six LSTAS.
Figure 7. TTD characteristics of the top six LSTAS.
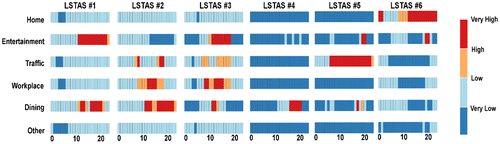
Figure 8. Spatial distributions of the top six LSTAS.
In Figure , the vertical axis represents the travel demand and the horizontal axis implies the time from 0:00 to 23:00 during a day. The first three LSTAS present the significant compound temporal activity patterns, while the latter three LSTAS mainly show some specific single activity patterns. As shown in Figure , the green points are the 10 municipal commercial circles from a Collection of Policies for Development in Shanghai Commercial Sector 2010 (http://images.mofcom.gov.cn//accessory/201006/1277190604257.pdf). The green circles indicate the 10 municipal commercial circles. The first four LSTAS are mainly accumulated in the central part while the latter two LSTAS are in the discrete space out of the central part involving the transportations stations and the resident areas.
Represented by the first column in Figure , the first LSTAS-TTDC denotes the pattern of remarkable compound characteristics of two activities, including the activity for entertainment from noon to 22:00 and the activity for dining at noon and in the evening. Meanwhile, from the Figure (a), we can get spatial distribution insights that the first LSTAS-SC is mainly accumulated in the most of municipal commercial circles, especially in the Nanjing East Road and Huaihai Middle Road that are well known for the pedestrianized tourist street. Compared to the first LSTAS, the second one has the lower correlation to the entertainment and the higher correlation to three kinds of temporal activities: the activity for traffic in the morning and evening rush hours, the work in the daytime, and the activity for dining from noon to 22:00. Although the spatial distribution of the second LSTAS is also near to the commercial circles (as shown in Figure (b)), it mainly represents workspaces of the commercial circles rather than the entertainment parts. The latter three LSTAS just shows the feature with single activity. For example, the fifth LSTAS significantly correlated to the transportation stations in Shanghai, including two airports (Hongqiao Airport and Pudong Airport) and two railway stations (Shanghai Railway Station and Shanghai South Railway Station) as shown in Figure (e). The sixth LSTAS is mainly related to the activity for Home corresponding to the resident areas in Shanghai as shown in Figure (f).
3.4. Inferring the functional regions
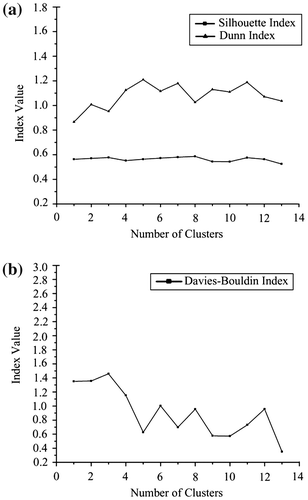
In order to demonstrate the importance of LSTAS, we applied the LSTAS to infer the functional regions. With the top 30 LSTAS as the reference, we simultaneously projected both the spatial and TTD structures in the same coordinate system. According to Equation (Equation7(6) ), we used the K-means clustering algorithm to aggregate similar subregions and TTD. Without any prior knowledge or pre-specified clustering numbers, we used three typical internal validation criteria: Dunn’s index, Silhouette index as shown in Figure (a), and DBI as shown in Figure (b), to determine the optimal number of clusters. By analyzing the results of the three indexes, we suggest the optimal number of clusters is 5 in this study.
Figure 9. Cluster validity indices of the K-means algorithm via (a) Dunn’s and Silhouette index, and (b) Davies-Bouldin index.
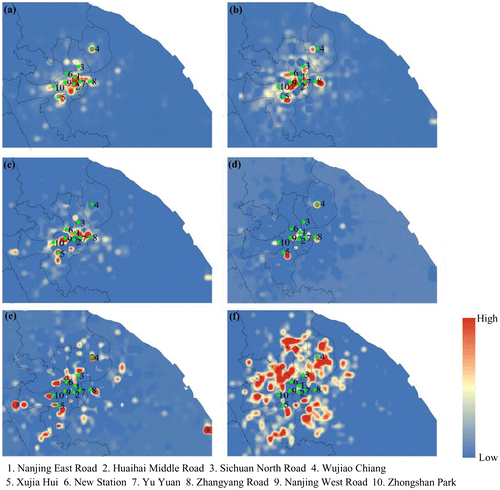
As a consequence, we find that five types of clusters have significant spatio-temporal characteristics in travel demands, as shown in Figures and (a). Figure shows the similarities between each TTD and the center of each cluster and Figure (a) shows the result of region aggregation. Cluster #1 presents a high degree of the entertainment and dining activities at noon and in the evening (Figure (a)), and covers all municipal commercial circles. The spatial distribution of Cluster #1 is shown in red in Figure (a). As a result, we suggest that Cluster #1 is commercial-dominant (CD). Unlike the CD, Cluster #2 is also highly correlated to the demand for transportation activities (Figure (b)), and contains some important transportation stations including airports and railway stations in Shanghai. Cluster #2, the blue area in Figure (a), is therefore viewed as the transportation-dominant (TD). Both Cluster #3 and Cluster # 4 have a strong association with the demand for home activities. However, they are dissimilar in the features for other demands and the spatial distribution. As shown in Figures (c) and (d), all values of other demands in Cluster #3 are positive, indicating that the activities for the other demands in Cluster #3 are also active. By contrast, the values of other demands in Cluster #4 are negative, indicating that other demands are not associated with Cluster #4. From the view of spatial distribution, Cluster #3 is closer to the CD than Cluster #4, as shown in Figure (a). Therefore, we suggest that Cluster #3 is the developed residential-dominant (developed-RD) and that Cluster #4 is the developing residential-dominant (developing-RD). Since Cluster #5 shows a low degree of all the demands, as shown in Figure (e), we suggest that Cluster #5 is other-dominant (OD).
Figure 10. Similarities among each TTD and centers of the 5 Clusters. (a) Cluster #1; (b) Cluster #2; (c) Cluster #3; (d) Cluster #4. (e) Cluster #5.
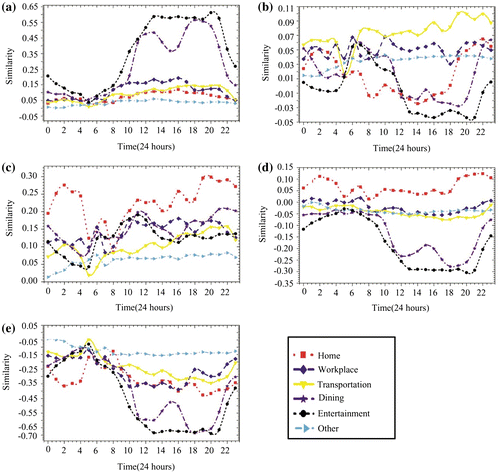
Figure 11. Result of region aggregation and concentric urban form revealed by 5 Clusters. (a) six circles with the radii from 1 to17 km; (b) proportions of various clusters in zones.
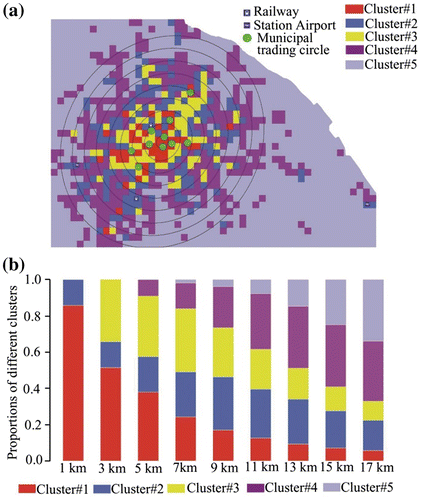
To verify the results, we first adopted the standard deviational ellipse method to determine the directional extent of the check-in data-set following the study by Liu et al. (Citation2012). It is obvious that the urban development of Shanghai is confined by the coastal line as well as the Yangtze River. We then draw nine ellipses with the same center and the major axis increases from 1 to 17 km by an increment of 2 km, as shown in Figure (a). In each zone, the proportion of every cluster area is computed. Figure (b) shows the distribution of various clusters within each zone. From inner zone to outer zone, the ratio of CD area and developed-RD area dramatically decreases while the developing-RD and OD significantly increase with the increase in the radius. Unlike the other three areas, the TD areas first increase and then decrease after the radius is longer than 9 km. It indicates a gradually declining activity intensity distribution from center to outer zones, and the corresponding change in region types from mostly CD and developed-RD areas to TD area, then outwards more developing-RD and OD areas, suggesting a concentric form of Shanghai.
The result is not only consistent with the official design, a Collection of Policies for Development in Shanghai Commercial Sector 2010, but also conforms to the findings of previous results obtained with the census and survey data (Li, Wu, and Gao Citation2007) or the taxi data (Liu et al. Citation2012). Moreover, this result proves that the LSTAS can be utilized to infer the functional regions without any predefined knowledge and provide a clear picture of the correlation between the groups of regions and different travel demands at different time of a day in the city.
4. Conclusions
Due to the lack of explicit large-scale activity data, most previous studies focused on the exterior temporal rhythm of human movement rather than the latent interdependence between the functional regions and human activities to understand the distribution of the functional regions. In this article, we proposed a novel LRA-based model to detect the functional regions from about 15 million check-in records during a year-long period in Shanghai, China. We made the following three key contributions. First, the model is applicable to find a series of latent structures, called LSTAS, which could represent the latent associations between the functional regions and human activities. While interpreting these latent structures, we cannot only reproduce the observed data with a lower dimensional representative, but also simultaneously project both the regions and activities in the same coordinate system. Second, the LSTAS can be utilized to identify the territory of functional regions without any predefined functional region classification. Thus, we provide a clear picture of the correlation between groups of regions and different travel demands at different time of a day in the city. Finally, we further verify the spatial distribution of the clusters of regions based on urban form analysis. The verification results are highly consistent with the latest government planning, indicating that our model is applicable to infer the functional regions with social media check-in data and will benefit a wide range of fields, such as urban planning, public services, and location-based recommender systems. In the future, we will investigate more cities and further improve the applicability of the proposed model.
Funding
This work was supported by the Open Research Fund Program of Shenzhen Key Laboratory of Spatial Smart Sensing and Services (Shenzhen University), and sponsored by the Scientific Research Foundation for the Returned Overseas Chinese Scholars, State Education Ministry [grant number 50-20150618]; National Natural Science Foundation of China [grant numbers 41001220, 51378512, 41571397, and 41501442]. This work was also supported by the Special Program for Applied Research on Super Computation of the NSFC-Guangdong Joint Fund (The Second Phase).
Notes on contributors
Ye Zhi is an assistant researcher of Road Traffic Safety Research Center of the Ministry of Public Security. His research interests include trajectory data mining, urban computing and geographic information engineering and applications.
Haifeng Li is currently an associate professor with the School of Geosciences and Info-Physics, Central South University. His current research interests include geo big data analysis, remote sensing, geographic information services, sparse representation, and machine learning.
Dashan Wang is an associate fellow and deputy director of the informatization of traffic management office at Road Traffic Safety Research Center of the Ministry of Public Security. His research interests include urban planning, Intelligent Transportation System (ITS) and traffic engineering and applications.
Min Deng is currently a professor with the School of Geosciences and Info-Physics, Central South University. His current research interests include geo big data analysis, temporal–spatial data mining.
Shaowen Wang is Professor of Geography and Geographic Information Science (Primary), Computer Science, Library and Information Science, and Urban and Regional Planning at the University of Illinois at Urbana-Champaign (UIUC), where he is named a Centennial Scholar. He is also Associate Director of the National Center for Supercomputing Applications (NCSA) for CyberGIS and Lead of NCSA’s Earth and Environment Theme, and Founding Director of the CyberGIS Center for Advanced Digital and Spatial Studies and the CyberInfrastructure and Geospatial Information Laboratory at UIUC. His current research interests include advanced cyberinfrastructure and cyberGIS, high-performance parallel and distributed computing, and spatial analysis and modeling.
Jing Gao was a postdoctoral researcher at the CyberGIS Center for Advance Digital and Spatial Studies, University of Illinois at Urbana-Champaign. Her current research interests include big geo-data analysis and machine learning.
Zhengyu Duan is currently an associate professor with the Key Laboratory of Road and Traffic Engineering of the Ministry of Education, Tongji University. His current research interests include intelligent transportation system, big data transportation.
Yu Liu is a professor at the Institute of Remote Sensing and Geographical Information Systems, Peking University. His research interests include GIScience and big geo-data mining.
References
- Aharon, M., M. Elad, and A. Bruckstein. 2006. “K-SVD: An Algorithm for Designing Overcomplete Dictionaries for Sparse Representation.” IEEE Transactions on Signal Processing 54 (11): 4311–4322.10.1109/TSP.2006.881199
- Antikainen, J. 2005. “The Concept of Functional Urban Area.” Informationen Zur Raumentwicklung 7: 447–456.
- Brun, M., C. Sima, J. Hua, J. Lowey, B. Carroll, E. Suh, and E. R. Dougherty. 2007. “Model-based Evaluation of Clustering Validation Measures.” Pattern Recognition 40 (3): 807–824.10.1016/j.patcog.2006.06.026
- Calabrese, F., J. Reades, and C. Ratti. 2010. “Eigenplaces: Segmenting Space through Digital Signatures.” IEEE Pervasive Computing 9 (1): 78–84.10.1109/MPRV.2009.62
- Candès, E. J., X. Li, Y. Ma, and J. Wright. 2011. “Robust Principal Component Analysis?” Journal of the ACM 58 (3): 1–37.10.1145/1970392
- Chan, K. W. 2007. “Misconceptions and Complexities in the Study of China’s Cities: Definitions, Statistics, and Implications.” Eurasian Geography and Economics 48 (4): 383–412.10.2747/1538-7216.48.4.383
- Cheng, Z., J. Caverlee, K. Lee, and D. Z. Sui. 2011. “Exploring Millions of Footprints in Location Sharing Services.” Proceedings of the 5th International Conference on Weblogs and Social Media (ICWSM), Barcelona, Catalonia, Spain, 81–88.
- Cranshaw, J., R. Schwartz, J. I. Hong, and N. M. Sadeh. 2012. “The Livehoods Project: Utilizing Social Media to Understand the Dynamics of a City.” Proceedings of International AAAI Conference on Weblogs and Social Media (ICWSM), Dublin, Ireland, 58–65.
- Davies, D. L., and D. W. Bouldin. 1979. “A Cluster Separation Measure.” IEEE Transactions on Pattern Analysis and Machine Intelligence 1 (2): 224–227.10.1109/TPAMI.1979.4766909
- Deerwester, S., S. T. Dumais, G. W. Furnas, T. K. Landauer, and R. A. Harshman. 1990. “Indexing by Latent Semantic Analysis.” Journal of the American Society for Information Science 41 (6): 391–407.10.1002/(ISSN)1097-4571
- Dunn, J. C. 1974. “Well-separated Clusters and Optimal Fuzzy Partitions.” Journal of Cybernetics 4 (1): 95–104.10.1080/01969727408546059
- Eagle, N., and A. S. Pentland. 2009. “Eigenbehaviors: Identifying Structure in Routine.” Behavioral Ecology and Sociobiology 63 (7): 1057–1066.10.1007/s00265-009-0739-0
- Jain, A. K. 2010. “Data Clustering: 50 Years beyond K-Means.” Pattern Recognition Letters 31 (8): 651–666.10.1016/j.patrec.2009.09.011
- Jiang, S., J. Ferreira, Jr., and M. C. Gonzalez. 2012. “Discovering Urban Spatial-temporal Structure from Human Activity Patterns.” Proceedings of the ACM SIGKDD International Workshop on Urban Computing, China, Beijing, 95–102.
- Karlsson, C., and M. Olsson. 2006. “The Identification of Functional Regions: Theory, Methods, and Applications.” The Annals of Regional Science 40 (1): 1–18.10.1007/s00168-005-0019-5
- Kockelman, K. M. 1997. “Travel Behavior as Function of Accessibility, Land Use Mixing, and Land Use Balance: Evidence from San Francisco Bay Area.” Transportation Research Record: Journal of the Transportation Research Board 1607 (1): 116–125.10.3141/1607-16
- Li, Z., F. Wu, and X. Gao. 2007. “Polarization of the Global City and Sociospatial Differentiation in Shanghai.” Scientia Geographica Sinica 27 (3): 304–311.
- Liu, L., A. Hou, A. Biderman, C. Ratti, and J. Chen. 2009. “Understanding Individual and Collective Mobility Patterns from Smart Card Records: A Case Study in Shenzhen.” Proceedings of the 12th International IEEE Conference on Intelligent Transportation Systems, St. Louis Missouri, United States, 1–6.
- Liu, Y., X. Liu, S. Gao, L. Gong, C. Kang, Y. Zhi, G. Chi, and L. Shi. 2015. “Social Sensing: A New Approach to Understanding Our Socio-economic Environments.” Annals of the Association of American Geographers 105 (3): 1–19.
- Liu, Y., Z. Sui, C. Kang, and Y. Gao. 2014. “Uncovering Patterns of Inter-urban Trip and Spatial Interaction from Social Media Check-in Data.” PLoS ONE 9 (1): e86026.10.1371/journal.pone.0086026
- Liu, Y., F. Wang, Y. Xiao, and S. Gao. 2012. “Urban Land Uses and Traffic ‘Source-sink Areas’: Evidence from GPS-enabled Taxi Data in Shanghai.” Landscape and Urban Planning 106 (1): 73–87.10.1016/j.landurbplan.2012.02.012
- Ma, X., H. Quang Luong, W. Philips, H. Song, and H. Cui. 2012. “Sparse Representation and Position Prior Based Face Hallucination upon Classified Over-complete Dictionaries.” Signal Processing 92 (9): 2066–2074 10.1016/j.sigpro.2012.01.018.
- Noulas, A., S. Scellato, C. Mascolo, and M. Pontil. 2011. “An Empirical Study of Geographic User Activity Patterns in Foursquare.” Proceedings of the 5th International Conference on Weblogs and Social Media (ICWSM), Barcelona, Catalonia, Spain, 11: 570–573.
- Pelletier, M., M. Trépanier, and C. Morency. 2011. “Smart Card Data Use in Public Transit: A Literature Review.” Transportation Research Part C: Emerging Technologies 19 (4): 557–568.10.1016/j.trc.2010.12.003
- Peng, H. W., B. Li, R. Ji, and W. Hu. 2013. “Salient Object Detection via Low-rank and Structured Sparse Matrix Decomposition.” Proceedings of Twenty-Seventh AAAI Conference on Artificial Intelligence, Washington, USA, pp 796–802.
- Qi, G., X. Li, S. Li, G. Pan, Z. Wang, and D. Zhang. 2011. “Measuring Social Functions of City Regions from Large-scale Taxi Behaviors.” Proceedings of the 9th Annual IEEE International Conference on Pervasive Computing and Communications Workshops, Seattle, WA, 384–388.
- Reades, J., F. Calabrese, and C. Ratti. 2009. “Eigenplaces: Analysing Cities Using the Space – Time Structure of the Mobile Phone Network.” Environment and Planning B: Planning and Design 36 (5): 824–836.10.1068/b34133t
- Rousseeuw, P. J. 1987. “Silhouettes: A Graphical Aid to the Interpretation and Validation of Cluster Analysis.” Journal of Computational and Applied Mathematics 20: 53–65.10.1016/0377-0427(87)90125-7
- Silva, T. H., P. O. Melo, J. M. Almeida, J. Salles, and A. A. Loureiro. 2012. “Visualizing the Invisible Image of Cities.” Proceedings of IEEE International Conference on Green Computing and Communications, Besancon, France, 382–389.
- Steiner, R. L. 1994. “Residential Density and Travel Patterns: Review of the Literature.” Transportation Research Record 1466: 37–43.
- Toole, J. L., M. Ulm, M. C. González, and D. Bauer. 2012. “Inferring Land Use from Mobile Phone Activity.” Proceedings of the ACM SIGKDD International Workshop on Urban Computing, Beijing, China, 1–8.
- Wu, L., Y. Zhi, Z. Sui, and Y. Liu. 2014. “Intra-urban Human Mobility and Activity Transition: Evidence from Social Media Check-in Data.” PLoS ONE 9 (5): e97010.10.1371/journal.pone.0097010
- Wu, S., X. Qiu, E. L. Usery, and L. Wang. 2009. “Using Geometrical, Textural, and Contextual Information of Land Parcels for Classification of Detailed Urban Land Use.” Annals of the Association of American Geographers 99 (1): 76–98.10.1080/00045600802459028
- Yuan, J., Y. Zheng, and X. Xie. 2012. “Discovering Regions of Different Functions in a City Using Human Mobility and POIs.” Proceedings of the 18th ACM SIGKDD International Conference on Knowledge Discovery and Data Mining, Beijing, China, 186–194.