
ABSTRACT
User-Generated Content (UGC) provides a potential data source which can help us to better describe and understand how places are conceptualized, and in turn better represent the places in Geographic Information Science (GIScience). In this article, we aim at aggregating the shared meanings associated with places and linking these to a conceptual model of place. Our focus is on the metadata of Flickr images, in the form of locations and tags. We use topic modeling to identify regions associated with shared meanings. We choose a grid approach and generate topics associated with one or more cells using Latent Dirichlet Allocation. We analyze the sensitivity of our results to both grid resolution and the chosen number of topics using a range of measures including corpus distance and the coherence value. Using a resolution of 500 m and with 40 topics, we are able to generate meaningful topics which characterize places in London based on 954 unique tags associated with around 300,000 images and more than 7000 individuals.
1. Introduction and motivation
How can we develop methods which better capture the diversity of ways of experiencing and understanding places, and yet which also allow representation and reasoning in information systems? One possible approach, which has recently gained much attention, is through the use of Volunteered Geographic Information (VGI), or more generally User-Generated Content (UGC), to derive place-relevant information that reflects notion of place as lived and experienced space (Capineri Citation2016; Hauthal and Burghardt Citation2016; Jenkins et al. Citation2016; Lansley and Longley Citation2016; Shelton, Poorthuis, and Zook Citation2015). An obvious strength of such data is the potentially large number of contributors, and corresponding potential multiplicity of ways of describing the same location. However, this strength is also a challenge – given such large volumes of data, we need methods which can allow us to identify coherent themes, or topics, if we wish to be able to characterize and compare places in a useful way (Adams and McKenzie Citation2013).
This need for coherent summaries of place-related data is underlined by the growth in location-based services and associated web-mapping products. Here, we observe a rapid increase in the development of services capable of adapting to individual users and use contexts, for instance by identifying preferences for a particular activity through previous actions or discriminating between tourist and local interests (Huang Citation2016; Nivala and Sarjakoski Citation2003). Such approaches, implicitly or explicitly, recognize that we think about and perceive the world in terms of places, rather than as geometric coordinates detached from meaning. Thus, in developing approaches which can adapt content according to shared notions of place, there is a need for data which represent these concepts.
Increasing calls have been made for the need to model and reason using place-based concepts in Geographic Information Science (GIScience). This is reflected by work, first, considering spatial vagueness as an important property of cognitive models of place, and second, a realization that natural language can provide us with access to a multiplicity of ways in which place is conceptualized (Montello et al. Citation2003). Much of this research is, at least in passing, inspired by ideas developed in human geography. Key to the work described in this article is the notion of place as being a socially produced concept (De Certeau Citation1984; Dourish Citation2006) associated with not only locals (Harrison and Tatar Citation2008) but also having an identity from people connected with places at a global level (Massey Citation1993). In GIScience, Agnew’s model (Agnew Citation2011), which conceptualizes three dimensions of place related to location, locale, and sense of place, has proved popular. These dimensions are often interpreted as relating to named places (locations), their properties or affordances (locale), and the meanings and emotions that people associate with these places (sense of place) (Capineri Citation2016; Hollenstein and Purves Citation2010; MacEachren Citation2017). It is also clear that such notions of place are dynamic, since place can also be considered to emerge as a semantic tangle of people related to activities and events at a locus (Harrison and Tatar Citation2008).
Natural language data, in the form of texts describing locations, are one way of attempting to build place descriptions. One, often-discussed source of such data is the Flickr photo-sharing platform. There are a number of reasons for this popularity. First, a large number of Flickr images are georeferenced, and their metadata are easily accessible through an application programming interface (Smith et al. Citation2012). Second, an image is the immediate and straightforward way of capturing our interactions with place, and early research demonstrated that coherent information related to both places and events could be extracted from Flickr tags (Rattenbury, Good, and Naaman Citation2007). Third, Flickr, has been shown to be used by different sorts of users, allowing for example access to contrasting conceptualizations related to both locals and tourists (Straumann, Çöltekin, and Andrienko Citation2014). Fourth, tags, given their lack of syntax are relatively simple to process, allowing the rapid implementation of arguably naïve, annotation and co-occurrence studies (Hollenstein and Purves Citation2010; Purves, Edwardes, and Wood Citation2011). More generally, increasing access to UGC has led to many claims with respect to the possibilities of characterizing place in a wide variety of ways from essentially bottom-up sources (Dunkel Citation2015; Shelton, Poorthuis, and Zook Citation2015). As well as simple studies, focusing on frequency and co-occurrence of tags, other methods include a variety of approaches from natural language processing to, for example, cluster and aggregate content semantically and spatially, and extract and characterize sentiment (Davies Citation2013; Hauthal and Burghardt Citation2016; Jenkins et al. Citation2016; Vasardani et al. Citation2013).
One very commonly applied family of methods in natural language processing, used to meaningfully group documents in a large corpus, is topic modeling (Blei and Lafferty Citation2006). The basic idea is relatively simple – given a set of documents, made up of individual words, it should be possible to group these using co-occurrence (i.e. documents in which similar words co-occur are more likely to be related). Perhaps the most common approach to topic modeling is Latent Dirichlet Allocation (LDA) (Blei, Ng, and Jordan Citation2003). LDA is a probabilistic approach which outputs a user-defined number of topics, each represented as a multinomial distribution over words. This implies, since documents consist of words, that documents can be represented as a mixture of topics. If topics can be assigned to meaningful labels, and if documents belong more to some topics than others, then a collection of documents can be summarized in terms of the topics, the words associated with each topic, and their labels. From this brief explanation, and the plethora of literature associated with LDA, two things should become clear. First, topic modeling appears to offer a beguiling simple way of summarizing large sets of documents. Second, the number of topics and labels attached to topics are chosen, and interpreted, by people. Topic modeling simply returns the number of topics defined as an input parameter and, presumably, if a corpus consists of a set of very similar documents, these topics should in turn be very similar (and thus not capture nonexistent semantic differences). However, the interpreting probabilities is generally known to be hard for humans, and issues such as semantic coherence, topic significance and ranking and the use of topic modeling in exploring data have all been the subject of attention (AlSumait et al. Citation2009; Chang et al. Citation2009; Mimno et al. Citation2011).
Topic models have obvious potential applications to understanding place and have been used in this context (Jenkins et al. Citation2016). On the one hand, we might expect documents describing the same place, but looking at different aspects of it to be captured in topics related to the place name (or its location). On the other hand, different places, affording similar environments, might be captured in topics focusing on locale. And finally, places which evoke similar emotions, we might imagine, could be captured in topics related to sense of place. Adams and McKenzie (Citation2013) analyzed georeferenced travel blogs using LDA, and indeed observed that four categories of topics emerged: what they called localities (specific geographic locations), activities and features (things to see and do), and miscellaneous. They demonstrated that LDA could generate meaningful, place-related topics but focused on understanding individual topics and similarities of locations to these.
In this article we focus on the use of image descriptions as a source of place information, or more specifically the tags associated with Flickr images. Since topic models treat documents as bags of words, documents based around tags (which can be considered to be simple sets of terms) are particularly well-suited to topic modeling since no underlying syntax is discarded in the analysis. Similar to the approach of Adams and McKenzie (Citation2013), in this article we explicitly generate topic models in space, but our starting point are not individually authored documents, but rather all of the tags associated with a grid cell. Since previous work has shown that parameter choices and interpretation of topics models are not trivial, we explicitly set out to explore the extent to which our approach allows us to capture different aspects of place and the sensitivity of our results. By aggregating textual information associated with a cell, we aim to explore the shared meaning and descriptions of places from/for people who either live in or visit these locations. Finally, we link these descriptions to a model of place to explore different ways in which London is described through Flickr tags. Our contribution is thus threefold:
We use LDA to generate spatially explicit topics in London. Our model is spatially continuous, and thus every location is associated with a set of topics.
Since parameter choice has been shown to be important in LDA, we explore the sensitivity of our results to both the number of topics and grid resolution. Furthermore, we use topic measures to explore the extent to which semantically coherent topics are distinctive.
We interpret and classify individual topics, relating these to place properties derived from the literature.
2. Data
Data were gathered using queries to Flickr’s Application Programming Interface (API) for georeferenced images within a given bounding box and taken before July 2013. Metadata included user ids, tags, image coordinates, two timestamps referring to the times a photo was taken and uploaded, and accuracy information provided by Flickr with respect to coordinates. Note that metadata reporting on accuracy in Flickr actually better reflect precision, and are often used to filter imprecisely georeferenced data (Hollenstein and Purves Citation2010). Our case study region is centered around the River Thames in inner London () and includes very commonly photographed places such as Buckingham Palace, Hyde Park, and Tower Bridge (Crandall et al. Citation2009) and has a total area of 170 km2.
Figure 1. Study area within inner London.
2.1. Data filtering and cleaning
Our focus was on modeling place by capturing shared notions ascribed to georeferenced images through tagging. Before carrying out topic modeling, we first carried out a range of filtering steps. We first removed images with accuracy values lower than 15 (i.e. georeferences reported as being less precise than street level). Second, bulk uploads, images with identical tags, either a textual tag or geotag from a single user, and tags which were not meaningful (e.g. camera generated titles “DIC 0001”) were removed using regular expressions. Furthermore, since tagging is known to be influenced by behavior, we removed users with the following characteristics:
Very inactive users who had a single image in our dataset or less than ten images in total associated with their profiles over a 24-h period (i.e. users experimenting with the system) (Hollenstein and Purves Citation2010);
Users who had deleted their profiles since our data collection;
Prolific users may introduce large biases in UGC, and in particular can clearly mask more general shared meanings (Nielsen Citation2006; Hollenstein and Purves Citation2010). We removed the 1% most prolific users who generated 20% of the whole dataset.
Moreover, the following images were removed:
Images with no tags;
Images with only Flickr machine generated tags which thus do not represent shared notions of place created by an individual user.
The final dataset thus consisted of 7753 unique users who had shared 371,752 images. shows the effect of each filtering task over the number of images and users, with a reduction in the original number of images collected, of approximately 90%.
Table 1. Remaining numbers of Flickr images and users after applying each task of the data filtering.
Finally, the remaining 186,632 unique tags associated with the 371,752 images reported in were normalized by being converted to lower case. Special characters (such as, @ in “@park”), numbers (e.g. the 2 in “park2”), and stop-words (such as, a, an, the) were removed. In addition, we eliminated all tags consisting only of numbers. We did not control for typographical errors (e.g. match londin to london) or remove duplicate tags associated with a single image.
Even after filtering, it is still possible that an individual user can bias usage of individual tags. We therefore generated tag profiles (Hollenstein and Purves Citation2010) which for each tag reflect tag usage over the population as a whole. We then used the coefficient of variation of standardized tags contribution to measure whether a tag was used equally among users with different contribution patterns. Tags with high coefficients of variation are only used by a few people and are therefore subject to contribution bias. We eliminated tags with a high coefficient of variation (> 200) (Hollenstein and Purves Citation2010) from our set of unique tags. The final tag list thus contained 954 unique commonly used tags, which formed the basis for the topic modeling described next.
2.2. Spatial distribution of Flickr images and corresponding metadata
The density of contributors to our dataset after filtering and cleaning our data is shown in . The map shows that the concentration of Flickr users, in Central London, particularly to the west, is higher. We assume this is because of tourist and leisure attractions in this area, since some of the most photographed places in the world are located in the western part of London (Crandall et al. Citation2009).
Figure 2. Number of users taking photographs in each grid cell.
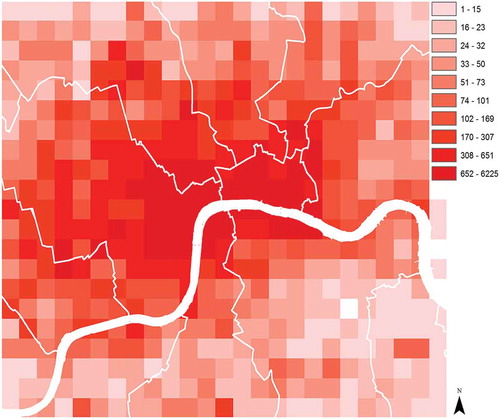
The correlation between the number of users and corresponding contributed images, using a linear regression, is very high (r2 = 0.95). Since we expect users at a given location to be spatially autocorrelated (Tobler Citation1970; Miller Citation2004), we tested for the influence of spatial autocorrelation using a spatial autoregressive regression (SAR) model including the coordinates of grid cells in the model. The correlation value (r2 = 0.96) is very similar, suggesting that the influence of spatial autocorrelation on our model is limited, and that the number of images in a grid cell is indeed strongly linked to the number of photographers. The high correlation between the number of users and images demonstrates that individual users do not influence the spatial distribution of images, and that the contribution bias, both in space and semantically, as a result of filtering for tags with low coefficient of variation, is no longer a major influence on our data.
3. Methods
Our focus in this article was on using semantics to group locations which are associated with shared meanings. We chose to do so by overlaying our study area with a grid and treating grid cells as the basic spatial units for analysis. We therefore treated each cell as a textual document, where all tags from all images located within a cell constitute the content of a single document. We then used topic modeling to explore the characteristics of, and in particular to group, similar grid cells. In a first stage we tested the sensitivity of our approach to the spatial resolution of our grid and the parameters used in our topic modeling. Having identified an optimum resolution and set of parameters we then labeled individual topics and finally annotated these labels according to the conceptual models of place introduced by Agnew (Citation2011) and Harrison and Tatar (Citation2008).
3.1. Topic modeling
In the introduction we described the basic principles of topic modeling. We used the Machine Learning for Language Toolkit (MALLET) to carry out LDA (McCallum Citation2002). Here, we explain how we generated topics for our data.
Documents for input to LDA were grid cells, each associated with a vector of all occurrences of each of the 954 unique tags identified after filtering;
These documents were input to the MALLET LDA toolkit and optimized hyper parameters for a given number n of topics (Cao et al. Citation2009) calculated;
The following outputs were produced:
For each of n topics, a list of all tokens (tags) and their probabilities of belonging to that topic;
For each grid cell (document), a vector of n topics and the probability of the grid cell belonging to each topic;
For each topic, a set of measures describing topic quality, which we introduce later.
We then assigned the most probable topic to each grid cell. Tags associated with low probabilities are not useful in characterizing an individual topic (Aletras et al. Citation2017) and we therefore chose representative tags by sorting tags associated with a topic according to probability, and then exploring the resulting cumulative probability curves.
Since our approach is based on a grid, the result is a spatially continuous model characterizing locations in terms of the tags which best describe each cell. An obvious limitation of this approach is the Modifiable Areal Unit Problem (MAUP) (Openshaw Citation1983). In addressing MAUP, we focused on the scale effect – the influence of the size of the units over which data are aggregated. We explored the influence of MAUP by testing our results for four different resolutions: 50 m, 250 m, 500 m, and 1000 m resolution cells.
MALLET also outputs a range of measures which aim to characterize the quality or meaningfulness of the output topics. We selected three of these corpus distance, number of tokens, and coherence value to investigate first the sensitivity of the model to resolution and number of topics (using corpus distance and number of tokens) and second, the semantic qualities of our topics (using coherence value).
Corpus distance characterizes how similar a topic is to the corpus as a whole. Small corpus distances imply that topics are similar to the corpus, and thus have limited power to distinguish documents from the corpus, or in our case, to differentiate between places with different characters (AlSumait et al. Citation2009). Number of tokens gives some indication of the number of words associated with each topic. As the number of topics increases (or the resolution decreases), the number of tokens associated with topics might be expected to decrease (since the need to generalize over locations and topics is less). An optimum number of tokens is therefore both sufficient to characterize individual topics, but small enough to allow topics to be distinguished from one another (c.f. corpus distance) (Mimno et al. Citation2011). These two measures were thus used in our sensitivity study to optimize grid resolution and number of topics.
The coherence value is based on the probability of words in a topic co-occurring in the grid cells belonging to that topic. It is calculated by taking the log of the sum of the probabilities of co-occurrence as a function of higher ranked words belong to a topic:
where β is a parameter to prevent log zero errors, is the number of co-occurrences of two terms in a document, and
is the number of occurrences of the more probable terms.
Very negative (since the value is a log) coherence values indicate that the tokens in a topic rarely co-occur in grid cells, while values of coherence close to zero suggest semantically coherent topics and associated tokens (Stevens et al. Citation2012).
3.2. Topic labeling and annotation
The final step in our methods moved away from computational methods to identify coherent topics using LDA and focused on the interpretation of these topics. Our aim here was twofold: first, we wished to assign a label to each topic, and second, to characterize topics according to notions of place introduced earlier. Our underlying hypothesis was that by using UGC, in the form of Flickr tags, we could extract semantics characterizing locations relating to similar places that might otherwise go unnoticed (Goodchild Citation2007). Having a list of most probable words based on the topic modeling, we set out to interpret these topics. Crucially, the local knowledge was central to interpreting topics, since individual tokens are often ambiguous and need to be interpreted in terms of London’s geography and the other tokens with which they co-occur. Thus, for example, the tokens Kings Cross, railway and Paddington would suggest a railway-related cluster (since these are the names of two nearby London railway stations). Since labeling topics varied in its difficulty, we only labeled those where we were reasonably confident of our interpretation. We hypothesized that these topics would also have higher coherence values, since the previous works have suggested that the quality of topics can also be expressed in terms of their interpretability by humans (Mei, Shen, and Zhai Citation2007; Newman et al. Citation2010).
In the final step, we annotated our labels with respect to place descriptions based around conceptual models of place focusing on first, the nature of place itself (Agnew Citation2011) and second the importance of the actors in a given place (Harrison and Tatar Citation2008). We used the following categories and combinations thereof: location (labels related to named places), locale (labels describing affordances of a place, either in terms of explicit activities or the objects characterizing a place), sense of place (labels associated with emotions and feelings), and finally, people (labels describing characteristics of the individuals or groups associated with a place).
4. Results and interpretation
4.1. Sensitivity tests
The first set of results we present concern sensitivity tests used to identify optimum grid resolutions and numbers of topics for further analysis. summarizes key statistics for the measures we introduced earlier for four grid resolutions and five different values for the number of topics. Median number of tokens showed no correlation with resolution, and we therefore report only on corpus distance.
Table 2. Median corpus distance and number of cells per topic as a function of the number of topics for different grid resolutions.
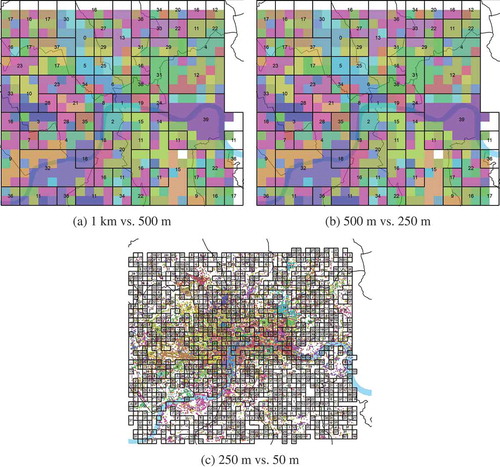
Mean median corpus distance is strongly correlated with resolution (Pearson correlation: r2 = 0.95) suggesting that the most distinctive topics would be obtained by simply having high resolutions. However, as resolution becomes finer, so too does the number of grid cells not allocated to any topic, because increasingly large numbers of grid cells are not associated with tags. This effect is illustrated in for clusters of 40 topics for four different grid resolutions. The colors reflect the clusters of higher resolution and the black wireframes delineate the low-resolution clusters. The white grid cells could not be allocated to a topic at the higher resolution, because no tags were present in these cells. To balance between very coarse resolutions (where meaningful places are not delineated) and fine resolutions (where for many cells we have insufficient data to describe places), 500 m was identified as an optimum grid resolution − the colored patches in ) and the black outlines in ).
Figure 3. Comparison between clusters of 40 topics with respect to the grid resolution. (a) 1 km vs. 500 m; (b) 500 m vs. 250 m; (c) 250 m vs. 50 m.
Having identified a suitable resolution, we then explored the sensitivity of our results to the number of topics. shows an inflection point in corpus distance, irrespective of resolution, at 40 topics, suggesting that the biggest change in the distinctiveness of our topics is likely to occur if we increase the number of topics from 20 to 40. As with resolution, simply increasing the number of topics results in higher corpus distances and thus more distinct topics. However, we also explored the sensitivity of the number of topics to two further parameters, both of which are important to our overall aim of delineating meaningful places.
Figure 4. Change in median corpus distance for different number of topics with respect to grid resolution.
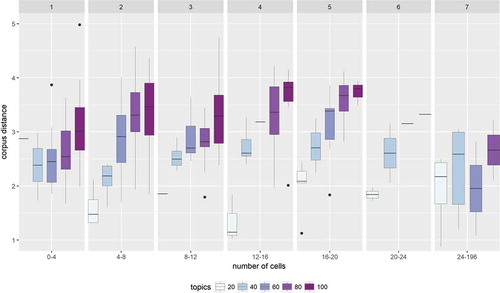
First, in we plot corpus distance as a function of the number of cells associated with each topic. Here we observe that corpus distance not only varies as a function of the number of topics, but also the number of cells, or area, associated with a topic. A desirable property of our results is that the distinctiveness of our topics does not strongly vary as a function of area – in other words that topics associated with single cells are not much more distinctive than those associated with large areas or vice versa. We observe that 40 topics seems to have the most stable corpus distance as a function of the number of cells associated with a topic.
Figure 5. Corpus distance for topics associated with different numbers of cells at a resolution of 500m.
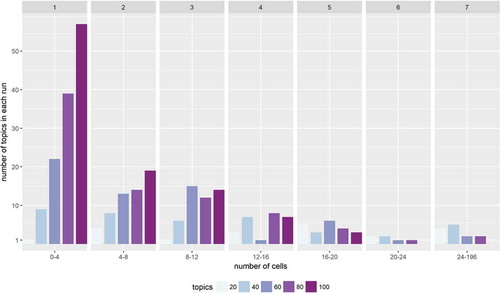
Second, we explored the relationship between the number of cells assigned to each topic and the number of topics (as shown in ). Once again, we observe that the most stable behavior appears to be for 40 topics – in other words, we have a roughly equal distribution of topics with the areas in range of 0.25–1 km2, 1–2 km2, and 2–3 km2.
Figure 6. Number of topics associated with the 500m cells for each implementation of the model.
In summary, based on our detailed sensitivity tests we found a resolution of 500 m best suited to capturing the whole area of interest, while maximizing corpus distance. Selecting 40 topics allowed us generate topics with a roughly constant corpus distance as a function of area. This in turn means that our results are not biased to either topics covering only very large or small areas.
4.2. Labeling and exploring topics
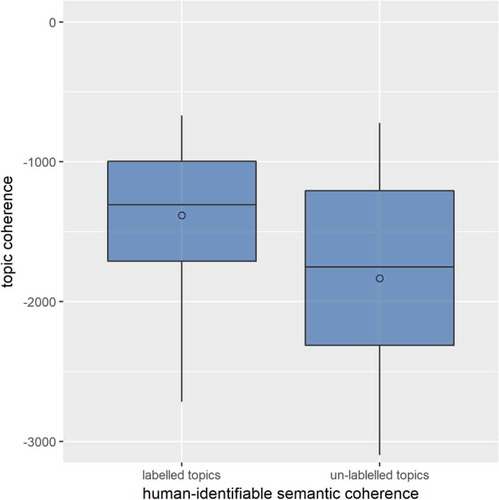
Having identified an optimum resolution and number of topics, we then set about analyzing the meaning of the topics created. Based on cumulative probabilities with respect to tags associated with individual topics, we selected lists of representative tags for each topic. These lists typically contained 15−25 tags. We then attempted to label topics based on these tags and our local knowledge of London. However, it is important to note that we could label only 30 out of 40 topics. We had previously hypothesized that, based on literature, topics which we could label were more likely to have low coherence values. In , we plot coherence values for the 30 labeled topics and 10 unlabeled topics and observe that coherence value does indeed appear to be a good potential indicator of the likelihood of topics being interpretable by humans.
Figure 7. Topic coherence value for labeled and unlabeled topics.
allows us to explore the different ways in which the semantics and properties of place are captured by our topic modeling. Note that we removed the two most probable tags from topics 19 (zoo) and 34 (natural) to increase clarity. The first topic, Topic 1 (views) is distributed over a range of locations ()), and mostly includes terms describing general features of scenes (e.g. sunset, clouds, skyline in )) which are photographed, thus indicating generic views of London. Interestingly, this topic is scattered around the edge of our study area, indicating locations from which London is seen. These places are thus characterized not only by what is found in these locations, but also by what can be seen from them.
Figure 8. Labeled topics (numbered cells) and example topics, labels, and tags (size as a function of probability).
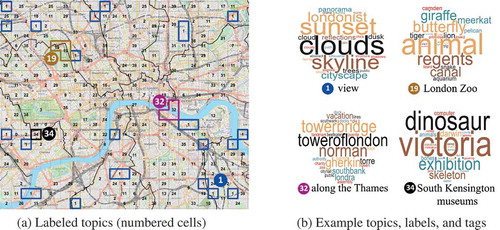
The other three examples all capture specific locations, either as a single cell (Topic 34: South Kensington Museums) or a cluster of cells (Topic 19: London Zoo and Topic 32: Along the Thames) ()). Examining the tag clouds, we observe a mixture of mostly proper nouns in the form of toponyms and building names (e.g. southbank, londra, gherkin), nouns (e.g. butterfly, cloud, skyline, family), and more abstract terms (e.g. assembly, authority) ()).
To better understand the nature of terms used in each topic, we associated our labels with a simple taxonomy based on previous work on place. In , we show both the 30 labeled topics and a classification of these labels in terms of the five dimensions of place we introduced earlier (location, locale and activity, sense of place and people). The map illustrates well the contrast between, for instance, topics based around locations (e.g. Barbican, Piccadilly), locales (e.g. canals, trains, and stations), and combinations of locations and locales (e.g. Hyde Park, which contains both location and locale information). We found no topics which were clearly related to sense of place, which we interpreted as emotions and feelings, but otherwise a mix of the types proposed.
Figure 9. Map of London describing users’ perception of the space as places.
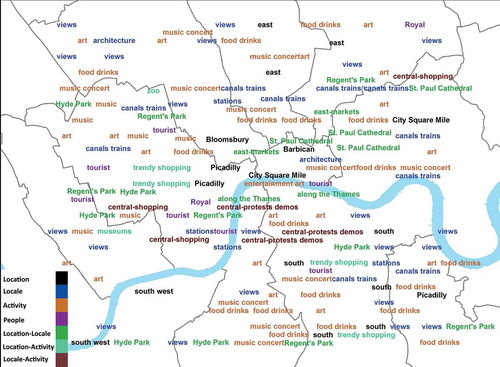
As has been shown in previous research (Sigurbjörnsson and Van Zwol Citation2008), toponyms are an important way of describing images, and thus can be effectively used as labels for topics. However, the map also allows us to see that such topics can extend beyond the actual location associated with a toponym (e.g. as occurs for Piccadilly), thus suggesting that such topics actually describe both the place Piccadilly and other similar 2We suggest that some of the classes also seem likely to reflect different sorts of users: views, canals, trains, and stations are distributed across London and seem likely to be indicative of locals interested in certain sorts of views and narratives about the city, rather than visitors characterizing tourist attractions (e.g. London Zoo or the museums in South Kensington). However, this visualization also illustrates some of the challenges of extracting semantics from tags, where we can only assign labels by interpreting and making assumptions about associations between tags. In general, we also note that most of the activities are leisure activities, suggesting that Flickr is typically used to document a mixture of tourist and leisure activities, and also hinting at what might be missing in such characterizations (e.g. more mundane activities and those with less positive associations).
5. Concluding discussion
We are not the first authors to use LDA as approach to describe space, or indeed, to link these notions to place (Adams and McKenzie Citation2013; Jenkins et al. Citation2016). Rather, our most important contribution is carrying out a detailed sensitivity study with respect to both resolution and number of topics, and assessing the utility of a range of out of the box measures in describing the quality of our results. Based on our experiences, we make the following suggestions:
Assuming that a spatially continuous model is the aim of a study, then the optimum grid resolution is that which allows most (or all) grid cells to be allocated to topics;
Increasing the number of topics will on average lead to more distinct topics. However, these topics will become increasingly associated with single grid cells, and thus fail to identify similar (not necessarily contiguous) regions. An optimal number of topics is, we would argue, one which allows for a range of topic areas (i.e. numbers of grid cells) and where corpus distance is not strongly influenced by the area associated with a topic;
Topic coherence value is a good predictor of the likelihood of humans being able to interpret and label topics.
Our labeled topics and their classification demonstrate both some strengths, and key limitations of our method. Firstly, after filtering (an important step which is often only cursorily described), we are still left with sufficient semantic variation to generate meaningful semantic topics which both describe specific locations (instances of places) and generic locations (types of places, or groups of similar places). However, since we labeled clusters only according to their semantics and not the locations of grid cells belonging to each cluster, label names alone are not indicative of membership in one of these groups. Thus, our Hyde Park cluster appears to actually encompass not only Hyde Park (an instance of a place) but also Hyde Park-like places. Using tags describing Flickr images obviously biases us toward the visual, and this is particularly well illustrated in our views cluster, where many generic salient, aesthetically pleasing, features of a cityscape are prominent (Dunkel Citation2015). On the other hand, as has been shown by other authors, we find little direct evidence for terms relating to sense of place (Hauthal and Burghardt Citation2016) in the sense of emotions and feelings. Indeed, our approach, though it captures shared meanings which relate to coherent places, is data-driven, and since Flickr images are dominated by more positive experiences (Cox, Clough, and Marlow Citation2008), does not reflect more negative aspects of place. Identifying and integrating data containing such notions would be an important extension to this work, but this is nontrivial, since many other sources also have a less direct relation to the space being described (Hahmann, Purves, and Burghardt Citation2014). Although we address the MAUP by exploring the sensitivity of our results to scale, we assume that our results are relatively insensitive to the shape and origin of our grid. One possible way of exploring this issue further would be to use an adaptive grid, and also to explore sensitivity to the grid’s origin. In future work we will therefore concentrate on methods to effectively integrate data from multiple sources, across a range of scales, and link these data to places either in the form of bona fide objects (e.g. Tower Bridge) or fiat locations (such as, the east end of London).
Acknowledgments
The authors would like to thank Olga Chesnokova for many useful comments and suggestions.
Additional information
Funding
Notes on contributors
Azam R. Bahrehdar
Azam R. Bahrehdar is a PhD. student in the Geocomputation Unit at the Department of Geography at the University of Zurich. Currently she is working on understanding spatial and platial context of User-Generated Content (UGC) through text.
Ross S. Purves
Ross Purves heads the Geocomputation Unit at the Department of Geography at the University of Zurich. His research interests include Geographic Information Retrieval, uncertainty modeling and characterizing place and landscapes using unstructured text and social media.
References
- Adams, B., and G. McKenzie. 2013. “Inferring Thematic Places from Spatially Referenced Natural Language Descriptions.” In Crowdsourcing Geographic Knowledge, edited by D. Sui, S. Elwood, and M. Goodchild, 201–221. Dordrecht, Netherlands: Springer.
- Agnew, J. A. 2011. “Space and Place.” In The SAGE Handbook of Geographical Knowledge, edited by J. Agnew and D. Livingstone, 316–330. London, United Kingdom: SAGE Publications .
- Aletras, N., T. Baldwin, J. H. Lau, and M. Stevenson. 2017. “Evaluating Topic Representations for Exploring Document Collections.” Journal of the Association for Information Science and Technology 68 (1): 154–167. doi:10.1002/asi.23574.
- AlSumait, L., D. Barbará, J. Gentle, and C. Domeniconi. 2009. “Topic Significance Ranking of LDA Generative Models.” In Machine Learning and Knowledge Discovery in Databases, edited by W. Buntine, M. Grobelnik, D. Mladenić, and J. Shawe-Taylor, ECML PKDD 2009. Lecture Notes in Computer Science. Vol. 5781. 67–82. Berlin, Heidelberg: Springer-Verlag.
- Blei, D. M., A. Y. Ng, and M. I. Jordan. 2003. “Latent Dirichlet Allocation.” Journal of Machine Learning Research 3: 993–1022.
- Blei, D. M., and J. D. Lafferty. 2006. “Dynamic Topic Models.” Proceedings of the 23rd International Conference on Machine Learning − ICML ’06, 113–120. Pennsylvania, USA, June 25–29.
- Cao, J., T. Xia, J. T. Li, Y. D. Zhang, and S. Tang. 2009. “A Density-Based Method for Adaptive LDA Model Selection.” Neurocomputing 72 (7–9): 1775–1781. doi:10.1016/j.neucom.2008.06.011.
- Capineri, C. 2016. “Kilburn High Road Revisited.” Urban Planning 1 (2): 128–140. doi:10.17645/up.v1i2.614.
- Chang, J., S. Gerrish, C. Wang, and D. M. Blei. 2009. “Reading Tea Leaves: How Humans Interpret Topic Models.” Journal of Physics A: Mathematical and Theoretical 44 (8): 085201.
- Cox, A., P. Clough, and J. Marlow. 2008. “Flickr: A First Look at User-Behavior in the Context of Photography as Serious Behavior.” Information Research 13 (1): 1–20.
- Crandall, D. J., L. Backstrom, D. Huttenlocher, and J. Kleinberg. 2009. “Mapping the World’s Photos.” Proceedings of the 18th International Conference on World Wide Web − WWW ’09, 761–770. Madrid, Spain, April 20–24.
- Davies, C. 2013. “Reading Geography between the Lines: Extracting Local Place Knowledge from Text.” In Lecture Notes in Computer Science (Including Subseries Lecture Notes in Artificial Intelligence and Lecture Notes in Bioinformatics), edited by T. Tenbrink, J. Stell, A. Galton, and Z. Wood, 320–337. Vol. 8116.Berlin, Heidelberg: Springer.
- De Certeau, M. 1984. The Practice of Everyday Life. Berkeley, USA: University of California Press.
- Dourish, P. 2006. “Re-Space-Ing Place.” Proceedings of the 2006 20th Anniversary Conference on Computer Supported Cooperative Work − CSCW ’06, 299. Alberta, Canada, November 4–8.
- Dunkel, A. 2015. “Visualizing the Perceived Environment Using Crowdsourced Photo Geodata.” Landscape and Urban Planning 142: 173–186. doi:10.1016/j.landurbplan.2015.02.022.
- Goodchild, M. F. 2007. “Citizens as Sensors: The World of Volunteered Geography.” GeoJournal 69 (4): 211–221. doi:10.1007/s10708-007-9111-y.
- Hahmann, S., R. Purves, and D. Burghardt. 2014. “Twitter Location (Sometimes) Matters: Exploring the Relationship between Georeferenced Tweet Content and Nearby Feature Classes.” Journal of Spatial Information Science 9 (9): 1–36.
- Harrison, S., and D. Tatar. 2008. “Places: People, Events, Loci – The Relation of Semantic Frames in the Construction of Place.” Computer Supported Cooperative Work 17 (2–3): 97–133. doi:10.1007/s10606-007-9073-0.
- Hauthal, E., and D. Burghardt. 2016. “Mapping Space-Related Emotions Out of User-Generated Photo Metadata considering Grammatical Issues.” The Cartographic Journal 53 (1): 78–90. doi:10.1179/1743277414Y.0000000094.
- Hollenstein, L., and R. Purves. 2010. “Exploring Place through User-Generated Content: Using Flickr to Describe City Cores.” Journal of Spatial Information Science 1 (1): 21–48.
- Huang, H. S. 2016. “Context-Aware Location Recommendation Using Geotagged Photos in Social Media.” ISPRS International Journal of Geo-Information 5 (11): 195. doi:10.3390/ijgi5110195.
- Jenkins, A., A. Croitoru, A. T. Crooks, and A. Stefanidis. 2016. “Crowdsourcing a Collective Sense of Place.” PLOS ONE 11 (4): 1−20. doi:10.1371/journal.pone.0152932.
- Lansley, G., and P. A. Longley. 2016. “The Geography of Twitter Topics in London.” Computers, Environment and Urban Systems 58: 85–96. doi:10.1016/j.compenvurbsys.2016.04.002.
- MacEachren, A. M. 2017. “Leveraging Big (Geo) Data with (Geo) Visual Analytics: Place as the Next Frontier.” In Advances in Geographic Information Science, edited by C. Zhou, F. Su, F. Harvey, and J. Xu, 139–155. Berlin, Heidelberg: Springer-Verlag.
- Massey, D. 1993. “Power-Geometry and a Progressive Sense of Place.” In Mapping the Futures, edited by J. Bird, B. Curtis, T. Putnam, and L. Tickner. Vol. 11. London, UK: Routledge.
- McCallum, A. K. 2002. MALLET: A Machine Learning for Language Toolkit. http://mallet.cs.umass.edu. [ last accessed on June 14, 2018].
- Mei, Q., X. Shen, and C. X. Zhai. 2007. “Automatic Labeling Of Multinomial Topic Models. ”Proceedings of the 13th ACM SIGKDD International Conference on Knowledge Discovery and Data Mining, 490–499. San Jose, CA: Agues 12–15.
- Miller, H. J. 2004. “Tobler’s First Law and Spatial Analysis.” Annals of the Association of American Geographers 94 (2): 284–289. doi:10.1111/j.1467-8306.2004.09402005.x.
- Mimno, D., H. M. Wallach, E. Talley, M. Leenders, and A. McCallum. 2011. “Optimizing Semantic Coherence in Topic Models.” Proceedings of the 2011 Conference on Empirical Methods in Natural Language Processing, 262–272. Edinburgh, United Kingdom, July 27–31.
- Montello, D. R., M. F. Goodchild, J. Gottsegen, and P. Fohl. 2003. “Where’s Downtown?: Behavioral Methods for Determining Referents of Vague Spatial Queries.” Spatial Cognition & Computation 3 (2–3): 185–204.
- Newman, D., J. Lau, K. Grieser, and T. Baldwin. 2010. “Automatic Evaluation of Topic Coherence.” In HLT’10 Human Language Technologies: The 2010 Annual Conference of the North American Chapter of the Association for Computational Linguistics, 100–108. Los Angeles, California, June 2–4.
- Nielsen, J. 2006. “The 90-9-1 Rule for Participation Inequality in Social Media and Online Communities.” https://www.nngroup.com/articles/participation-inequality/[ last accessed on June 14, 2018].
- Nivala, A., and L. T. Sarjakoski. 2003. “Need for Context-Aware Topographic Maps in Mobile Devices.” Proceedings of the 9th Scandinavian Research Conference on Geographical Information Science (ScanGIS), 15–29. Espoo, Finland, June 4–6.
- Openshaw, S. 1983. “The Modifiable Area Unit Problem.” Concepts and Techniques in Modern Geography 38: 1–41.
- Purves, R., A. Edwardes, and J. Wood. 2011. “Describing Place through User Generated Content.” First Monday 16 (9): 1–17. doi:10.5210/fm.v16i9.3710.
- Rattenbury, T., N. Good, and M. Naaman. 2007. “Towards Automatic Extraction of Event and Place Semantics from Flickr Tags.” Proceedings of the 30th Annual International ACM SIGIR Conference on Research and Development in Information Retrieval - SIGIR’07, 103–110. Amsterdam, Netherlands, July 23–27.
- Shelton, T., A. Poorthuis, and M. Zook. 2015. “Social Media and the City: Rethinking Urban Socio-Spatial Inequality Using User-Generated Geographic Information.” Landscape and Urban Planning 142: 198–211. doi:10.1016/j.landurbplan.2015.02.020.
- Sigurbjörnsson, B., and R. Van Zwol. 2008. “Flickr Tag Recommendation Based on Collective Knowledge.” Proceeding of the 17th International Conference on World Wide Web −WWW’08, 327–336. Beijing, China, April 21–25.
- Smith, M., C. Szongott, B. Henne, and G. Von Voigt. 2012. “Big Data Privacy Issues in Public Social Media.” The 2012 6th IEEE International Conference on Digital Ecosystems and Technologies (DEST), 1–6. Campione d’Italia, Italy, June 18–20.
- Stevens, K., P. Kegelmeyer, D. Andrzejewski, and D. Buttler. 2012. “Exploring Topic Coherence over Many Models and Many Topics.” Proceedings of the 2012 Joint Conference on Empirical Methods in Natural Language Processing and Computational Natural Language Learning, 952–961. Jeju Island, Korea, July 12–14.
- Straumann, R. K., A. Çöltekin, and G. Andrienko. 2014. “Towards (Re)Constructing Narratives from Georeferenced Photographs through Visual Analytics.” The Cartographic Journal 51 (2): 152–165. doi:10.1179/1743277414Y.0000000079.
- Tobler, W. R. 1970. “A Computer Movie Simulating Urban Growth in the Detroit Region.” Economic Geography 46 (Sup1): 234−240. doi:10.2307/143141.
- Vasardani, M., S. Timpf, S. Winter, and M. Tomko. 2013. “From Descriptions to Depictions: A Conceptual Framework.” In Lecture Notes in Computer Science (Including Subseries Lecture Notes in Artificial Intelligence and Lecture Notes in Bioinformatics), edited by T. Tenbrink, J. Stell, A. Galton, and Z. Wood, 8116 LNCS. 299–319. Berlin, Heidelberg: Springer-Verlag.