
ABSTRACT
Nowadays, several research projects show interest in employing volunteered geographic information (VGI) to improve their systems through using up-to-date and detailed data. The European project CAP4Access is one of the successful examples of such international-wide research projects that aims to improve the accessibility of people with restricted mobility using crowdsourced data. In this project, OpenStreetMap (OSM) is used to extend OpenRouteService, a well-known routing platform. However, a basic challenge that this project tackled was the incompleteness of OSM data with regards to certain information that is required for wheelchair accessibility (e.g. sidewalk information, kerb data, etc.). In this article, we present the results of initial assessment of sidewalk data in OSM at the beginning of the project as well as our approach in awareness raising and using tools for tagging accessibility data into OSM database for enriching the sidewalk data completeness. Several experiments have been carried out in different European cities, and discussion on the results of the experiments as well as the lessons learned are provided. The lessons learned provide recommendations that help in organizing better mapping party events in the future. We conclude by reporting on how and to what extent the OSM sidewalk data completeness in these study areas have benefited from the mapping parties by the end of the project.
1. Introduction
The collective awareness platforms for improving accessibility (CAP4Access) in European cities and regions, was a European project (runtime: January 2014–January 2017) (Institute of Geography, Heidelberg University Citation2017) aiming to develop and pilot-test methods and tools for collectively gathering and sharing spatial information for improving accessibility (Zipf et al. Citation2016). The aim of the project was to exploit the power of online maps and mobile devices for fostering awareness of barriers for individuals with limited mobility and in turn aid in the removal of such barriers.
CAP4Access aimed at integrating people with limited mobility into society (social sustainability), saving public resources (e.g. by helping municipalities to focus expenditures) (economic sustainability) and also saving natural resources (e.g. by facilitating public transport use) (ecological sustainability). Data sources used in the project included humans as sensors, sensors in smartphones, and public sector information such as data held by local administrations which are of relevance to accessibility (e.g. road surface and width, traffic volumes and speed, elevation, etc.). Target groups included people requiring enhanced accessibility; grassroots initiatives supporting people with disabilities; policy-makers, planners, and service providers with responsibility for the built environment; and the general public. Rather than setting up a new platform, the tools to be developed were pilot-tested on established platforms including Wheelmap (Mobasheri, Deister, and Dieterich Citation2017), OpenRouteService (The Heidelberg Institute for Geoinformation Technology Citation2018), and OpenStreetMap (OSM). Employing tools targeting local initiatives for supporting awareness raising and collective action was necessary. The aim of this task was to enable local activities for creating awareness and initiating concrete measures for eliminating barriers for people with limited mobility.
Supporting awareness raising and collective action is not primarily a technical task. This article will detail various aspects of awareness raising with respect to the consequences they have on technical design requirements. A crucial aspect of awareness raising involves making people conscious of certain realities they have not yet thought about or have not been taught to consider.
It is important to note that awareness raising does not stand alone but is a topic that intersects with the other research topics. A technical design solely for awareness raising is neither suitable nor applicable as the other functions of the tools and software being developed will largely determine what the required architecture should be. Nonetheless, there are certain aspects of awareness raising to consider with regard to the technical design of the tools under development.
In Article 8 of the UN convention on the rights of persons with disabilities (Department of Economic and Social Affairs, Division for Inclusive Social Development, UN Citation2017), the awareness raising is described as follows:
States Parties undertake to adopt immediate, effective, and appropriate measures:
To raise awareness throughout society, including at the family level, regarding persons with disabilities, and to foster respect for the rights and dignity of persons with disabilities;
To combat stereotypes, prejudices and harmful practices relating to persons with disabilities, including those based on sex and age, in all areas of life; and
To promote awareness of the capabilities and contributions of persons with disabilities.
Measures to this end include:
(a) Initiating and maintaining effective public awareness campaigns designed:
To nurture receptiveness to the rights of persons with disabilities;
To promote positive perceptions and greater social awareness toward persons with disabilities;
To promote recognition of the skills, merits, and abilities of persons with disabilities, and of their contributions to the workplace and the labor market;
(b) Fostering at all levels of the education system, including in all children from an early age, an attitude of respect for the rights of persons with disabilities;
(c) Encouraging all organs of the media to portray persons with disabilities in a manner consistent with the purpose of the present Convention; and
(d) Promoting awareness-training programs regarding persons with disabilities and the rights of persons with disabilities.
For this project, OSM—a volunteered geographic information (VGI) database is used for collection of data (through Wheelmap) as well as input data for OpenRouteService—an open source routing engine. Several research studies have employed VGI data for various application domains (Mooney and Minghini Citation2017) including urban studies (Bakillah et al. Citation2014a; Crooks et al. Citation2015; Gil Citation2015; Sun and Du Citation2017), routing and navigation (Luxen and Vetter Citation2011; Bakillah et al. Citation2013; Neis and Zielstra Citation2014; Rousell et al. Citation2015) as well as studies of touristic activities (Vohnout et al. Citation2014; Teslya Citation2014). Within the CAP4Access project, we employed the possibility and suitability of OSM data for a routing service dedicated to people with limited mobility. The target users of such routing service are mainly Wheelchair users, but elderly people, and people using pushchairs or baby carriers could also benefit from such a service.
OSM data, like any other form of VGI, are generated by volunteers who may or may not have enough expertise for mapping data collection. This leads to potential skepticism about the reliability of such datasets (Goodchild and Li Citation2012). Therefore, as an initial step in the project development, research study needed to be carried out in order to evaluate and assess the quality and suitability of OSM data for being used within the CAP4Access project as well as how the quality could be enriched in order to be better prepared for the Wheelchair routing service. This article aims to address this concern, and show the result of quality assessment of sidewalk and other accessibility-related information in OSM data, and further present an awareness raising and public engagement approach that has been taken in order to enhance the quality of OSM data.
The rest of the article is structured as follows. Section 2 provides information about the initial assessment of OSM data quality with respect to required geographic information. In Section 3, we present the details of our method for engaging volunteers to map sidewalk and accessibility related geographic data. While the results of several experiments carried out in two pilot cities are discussed in Section 4. Finally, the article concludes by pointing out the advantages and disadvantages of our method as well as the lessons learnt throughout the experiments. The article ends with an evaluation of how helpful the proposed method was in enriching the quality of OSM data.
2. OSM data quality assessment
Quality and reliability of OSM data has been previously studied in various projects and countries (Senaratne et al. Citation2017). The authors noted that the methods for data quality assessment and enrichment depended on the application domain as well as the aims of the project. Within the CAP4Access project, the importance of OSM data quality is reflected in two user stories.
First, as a user of wheelchair routing service, people want to know how many objects (e.g. hotels) are most likely to turn out to be accessible once he/she gets there. The issue is that people could have the choice of three hotels; all are presented on the map (e.g. Wheelmap) as being accessible. He/she would like to choose the hotel for which the grading data is most up-to-date and has been confirmed by as many other users as possible. A quality assessment tool could potentially connect to Wheelmap and Booking.com through their APIs, and collect necessary rating information from them (e.g. from Wheelmap the information regarding how many users have viewed and confirmed the grading of the hotel(s) could be retrieved, and from Booking.com they could ask queries such as whether the hotel is wheelchair accessible based on their database). Based on such information the quality assessment tool can aggregate the results and provide a suggestion, based on rankings.
Second, as a user who wants to know if the data that he/she is relying on has been validated by a knowledgeable source. The question is that can he/she trust the information on accessibility which is being provided? Concerning the possible solutions, people could think of various options: the data themselves could display a quality tag of some kind. Accessibility tags, for example, could be rated by a number of confirmations (provided that the accessibility tagging would be extended by such a mode); or a whole data set (all data, a certain city’s data, etc.) could obtain an approval or certification of its overall quality.
Since the people who use the final developed tools would need to rely on the input data, the accuracy of such data is of critical importance. Hence, this section presents the results of an initial assessment of OSM data quality for being used in OpenRouteService (Neis and Zipf Citation2008). In this study we define data quality as fitness for purpose. We argue that as long as a dataset meets the requirements of the project, it is of acceptable quality. Having this in mind, we understand that three data quality elements based on ISO standard for geographic information are important for a dataset such as OSM to be used by a routing service. These three elements are positional accuracy, completeness, and logical consistency. Among them, completeness is of most importance, because in cases where there is lack of data, there is no need to check the other characteristics of it (position, consistency, etc.). Hence, the main assessment of OSM data quality for CAP4Access project was devoted to checking the completeness of it.
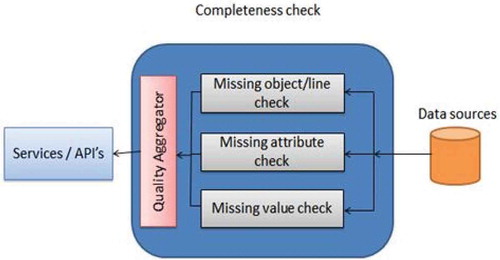
Completeness is defined as a measure of the lack/excess of data (Oort Citation2006). It could be divided into three types/levels: (a) object; (b) attribute; and (c) value. As depicted in , there are three different checks that could be performed for evaluating the completeness of OSM data. In the first check, missing objects (e.g. sidewalks) should be identified. Depending on the selected quality assessment method (extrinsic or intrinsic analysis), a reference dataset may be required. Since OSM data does not have sidewalk geometries and sidewalk information are tagged to ways (i.e. highways), we skipped this check. In the second type of check, the missing attributes (or availability of attributes) could be checked. In this study, we applied an intrinsic analysis of completeness check, by checking the OSM dataset for selected list of tags relevant and required for accessibility ().
Table 1. Relevant information (tag values) in OSM data for routing and navigation of people with limited mobility, adapted from Neis and Zielstra (Citation2014).
Figure 1. The proposed system architecture for data completeness checking.
As an initial attempt, in order to explore OSM data and to understand the current status of OSM data completeness with regard to sidewalk information, we performed a query of OSM data, visualizing the road objects that have a tag which shows whether a sidewalk exists on the route or not (note that every object mapped in OSM data is annotated with extra information in forms of tags attached to the object feature). This analysis was performed in order to show the importance of data completeness as well as helping project partners to select the best regions within the city for their pilot tests. presents the results of this analysis for each pilot city.
Table 2. Results of number of sidewalk objects and attributes in OSM for four pilot cities (Query date: October 2014).
Results of this analysis as well as a more complete extrinsic and intrinsic analysis of sidewalk information (Mobasheri et al. Citation2017a) demonstrated the problem of sidewalk data incompleteness in OSM. Hence, one of the next steps in the research project is to develop and apply approaches for enriching the sidewalk information in OSM. There have been other studies on the same topic that use rule-based reasoning (Mobasheri Citation2017) and data mining techniques (Mobasheri et al. Citation2018) for OSM Sidewalk information enrichment. While this article presents another approach which is very different in the nature of the methodology. More specifically, the methodology presented in this article deals with increasing the awareness and engaging the crowd for enriching sidewalk information in OSM.
3. Methodology
Since OSM is a crowdsourced database, and public volunteers edit the data, a basic and sustainable approach is to increase the awareness of the need for sidewalk information for target users such as Wheelchair and/or pedestrian users. This would lead to enrichment of the completeness of sidewalk data for certain regions where the engagement plans have taken place, as well become a sustainable approach for the enrichment of sidewalks into OSM, since the people would become aware of the importance and need of it. In this article, we specifically reported the awareness raising and public engagement taken place in two cities, London and Heidelberg in the form of mapping workshop events, and we presented the various active collection tools used for this means.
Within CAP4Access we created online and offline public awareness campaigns. Building on the history and success of Wheelmap, we designed our awareness raising activities based on the following three criteria, which have proven to be vital for an effective campaign outcome:
Scalability;
Sustainability; and
Social impact.
Scalability in terms of mapping and crowd sourcing means allowing for a product or service to be experienced in different ways by many different users—that is, concurrently, in one or in multiple groups, in different regions and very importantly, independent of the owners of the product or service. That being said, the technical design needs to be able to adapt to a user’s needs, for example by providing the implementation of additional languages.
In order for a product to be scalable, it is important to prevent the formation of bottlenecks. A bottleneck is a phenomenon where the performance or capacity of an entire system is limited by a single or limited number of components or resources. The technical design of the products and features should therefore avoid any limiting processes that inhibit the user’s activity, such as required editorial or authorization procedures. Users want to retrieve information or see their input immediately. This means that whenever there is another entity involved, which needs to authorize a user’s activity, this leads to delays and potential frustration on the part of the user, ultimately resulting in a decrease in participation.
As far as possible, users should be able to customize any tools on their own, according to their individual needs. This requires a frontend that can provide the user with a variety of customizable options, such as adaptable figures, numbers, or regions and access to the tool’s activity history. Sustainability is therefore a much-needed requirement when it comes to securing the engagement of stakeholders whom we need in order to increase the impact of our project.
Technically, from a design point of view, sustainability means that you must make sure that any data is always accessible to everyone in machine-readable formats. It is also crucial to design database and software in open source formats (Bakillah and Liang Citation2016), and make them independent of specific licenses or server infrastructures of CAP4Access consortium partners. There always needs to be a way to migrate already developed software tools (e.g. via GitHub pull requests) or retrieved data and to be able to continue carrying out these actions even after our project itself is officially finished.
Considering the criterion’s social impact, it is important to point out that the awareness raising is a key aspect of social impact, and one which is difficult to measure. Awareness raising and social impact require each other. The experience of the project Wheelmap is that the obvious social impact of the project helps to engage people and to motivate them to become active. Another insight that has been gained is the need for clearly defined and actionable tasks with which to engage the community. Questions to be answered or data to be gathered by the community must be clearly defined and self-explanatory.
There are several relevant application cases and user stories involved. For example, as a city planner, people want to know where in the city action needs to be taken so that accessibility will be improved; as an activist, people hope that the local authority can know about accessibility in their city in order to sensitize them and make them more active; as a wheelchair user, people wish to be able to report an accessibility problem to their public transportation provider so that the provider can make the necessary changes to improve the service; as a policy maker, people want to know about the experiences of other municipalities in other countries with regard to improving accessibility so that their city can learn from them; as a mapper, people want to let people know about their desire to get engaged and to have the opportunity to invite more people to a mapping event, so he/she can map within a group rather than being alone.
The awareness raising and collective action tools we used during the first two years of the project which are discussed in more details below are:
MyAccessible.EU website: A tool to reach a wider community by using a tone and providing content that is appealing to people outside of the project. With easy-to-understand blog posts about the activities in the pilot sites, the development of the new tools, the activities around Wheelmap and about other relevant external projects the website seeks to convey the participatory aspect of the project to a mainstream audience. It reaches a different kind of audience comparing to the CAP4Access website, which provides more official and technical documentation of the project’s progress.
MapMyDay: A campaign format for large scale mapping events using Wheelmap.org. It consists of a website in seven languages, a wide variety of informative materials in several languages, a social wall that shows every tweet or post using the #MapMyDay hashtag, a counter to show the newly marked places on Wheelmap in real time, a localized, embedded segment of Wheelmap which can be used directly, a Facebook community page and a Twitter account.
Twitter: The MyAccessible.EU account is a tool to make people in the disability and mapping communities aware of CAP4Access and its activities. The account is well suited for making contact with and learning from other projects.
In addition, Wheelmap was used extensively as the focus for awareness raising activities such as mapping events. The mapping events were held in four different cities (and countries) within Europe on various occasions throughout the year. In the next section we present details about the implemented mapping events in two case studies: London and Heidelberg, and discuss the results of such activities including the lessons learnt as well as to what extent such activities were able to enrich the completeness of sidewalk data in OSM of those regions.
4. Results and discussion
Throughout the project period, several activities in all four pilot cities were carried out. In this article, in order to avoid duplicate examples, we selected examples of the activities in London and Heidelberg. Activities in London and Heidelberg have primarily focused on awareness raising which have sought to encourage the public to engage in actions independently. Activities have combined both virtual and in-person interactions.
4.1. Awareness raising and public engagement in London
4.1.1. Practices
(1) Access the National Trails (ANT)
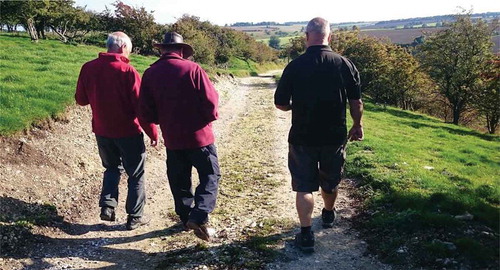
After liaising with various walking organizations, the social enterprise Walk Unlimited voiced their enthusiasm to participate and put us in contact with several National Trail officers. ANT was devised in order to collect accessibility information and raise awareness about accessibility in the context of walking. The National Trails comprise of over 2000 miles of footpath and bridleway across England and Wales (Walk Unlimited Citation2018). The paths themselves are in various states of accessibility, but there is currently no official source of information regarding their suitability for wheelchair users and others with limited mobility. The volunteers mapped footpaths using the MyAccessibleEU Obstacle Mapper collecting images and detailed information about particular obstacles ().
Figure 2. Mapping along the national trails.
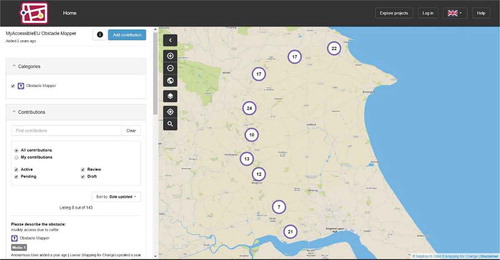
The data was added to the contributions already available online and it offered information about the specific barriers that affect the accessibility of paths, enabling wheelchair users and others with limited mobility to assess which routes to take (). The collected information, and the fact that the Yorkshire Wolds Way is now completely stile-free, make the trail an attractive destination for all who want to enjoy the outdoors. The volunteers spent a considerable amount of time testing the application, providing feedback and helping to refine the workflow from data collection to visualization, which has resulted in a seamless integrated process. Overall, a good amount of data was collected during the workshops. Over 27,000 m of trail imagery were captured using Mapillary, and more images were added by participants afterwards. 80 obstacles such as gates, rivers and uneven surfaces have been marked.
Figure 3. Screenshot of a map illustrating sample data collected during the event.
Mapping for Change (MfC) company in UK continues to promote the use of Obstacle Mapper to collect information about particular obstacles in areas with no mobile network, Mapillary, which uses GPS to geolocate images, to develop imagery along the trails, and Wheelmap to mark the accessibility of venues along or near to the trails.
(2) Ramp it Up Campaign (RIU)
The RIU Campaign was designed to spark community interest, raise awareness for accessibility issues across the United Kingdom, and guide businesses toward opening up their services to people with disabilities. This combined with the free app “Wheelmap” was viewed as making some headway to improving the accessibility of our towns and cities. Specific regions were targeted with the aim to get coverage and nominations from across England, Ireland, Scotland, and Wales, to provide an opportunity to make places accessible identified by the public as currently inaccessible and to encourage businesses and building owners to provide wheelchair accesses to their premises.
The campaign commenced at the beginning of November, 2016 and ran for the period of a month. Members of the public were asked to nominate and vote for places that they would like to go to but were currently inaccessible due to a lack of having a step-free access. The announcement of winners was scheduled to coincide with the UN International Day for people with Disabilities on 3rd December.
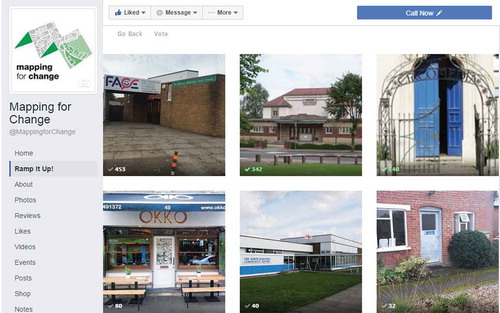
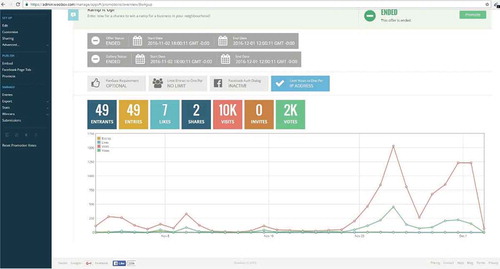
This event was predominantly designed as a social media campaign. A designated Facebook page was created as well as a voting platform integrated with Facebook to manage the process (). A tab from the MfC Facebook page enabled people to access the contest details and offered guidance on the steps required to submit a nomination. In addition to using social media, MfC also visited locations in London, Bristol, and Halifax to circulate flyers about the campaign, whilst simultaneously using the opportunity to distribute material on the Wheelmap Ambassador programme and Cap4Access tools.
Figure 4. Illustration of the RIU Campaign on Facebook.
During the campaign, 49 entrants were received. Each submission had to be reviewed for their eligibilities and assessed as to whether the nominated business or organization was willing to accept the nomination and whether the ramp specifications were appropriate to overcome the steps. This process resulted in 25 nominations being validated for inclusion—others were excluded from the campaign because they either had too many steps, or other physical barriers to overcome.
Over the course of the month RIU, there were over 10,000 visits to the site and over two thousand votes were cast (). The sites that were nominated spread from Scotland in the north to Bristol in the southwest. A number of locations were nominated after the RIU ended, and each were given details on where and how to go about purchasing a portable ramp.
Figure 5. Illustration of statistics collected during the RIU Campaign.
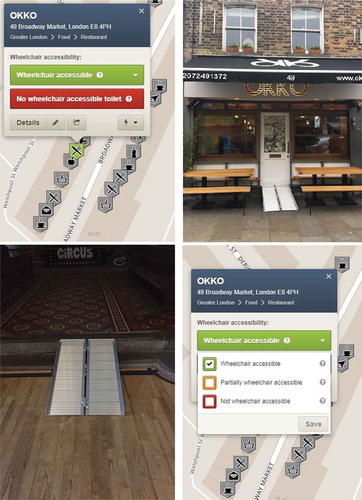
Nominees were notified of the outcome of the campaign and the top 10 secured a portable ramp. The winners were given window stickers for use on the premises to inform the public of the portable ramp and were asked to take a photo of the mounted ramp. They were also asked to mark themselves as accessible on Wheelmap ().
Figure 6. Illustrations of portable ramp mapped on Wheelmap.
4.1.2. Lessons learned
The target group for obstacle data were volunteers with an interest in walking on the National Trails. Since the project had a focus on raising awareness as well as data collection targeting a specific “community of interest” and provided an opportunity to address both of these aims.
The mapping events were very similar in format to the Wheelmap mapping parties and recruitment was again done through specific networks and organizations linked to the National Trails and walking enthusiasts. In the case of the National Trails, mapping activities involved introducing the applications: Wheelmap, Obstacle Tagger and Mapillary. Tool guides were provided with directions on which tools to use for which purposes: Obstacle Tagger to map obstacles; Mapillary to capture trail imagery, and Wheelmap to tag points of interest. Participants were divided into groups with each member assigned a specific application. Mobile phones were provided with each of the applications pre-loaded. The workshops and mapping activities provided a great opportunity to raise awareness about barriers to accessibility and the various tools designed to help address these.
The demographic make-up of participants was less diverse to other mapping events and comprised a much older group of volunteers. As such, explaining how each of the applications worked took considerably longer, which reduced the amount of time available for data collection. However, the initiative has helped to address the need for adequate accessibility data in the context of hiking, but also involved technical components which are of potential interest to OSM. Further, the involvement of staff responsible for the maintenance of the trails has seen sustained use of the technology. The longer term benefits of using the applications to provide and maintain data about the trails’ accessibility is clearly a motivator and they continue to use the app to collect data up to today.
In general, the mapping activities provided a great platform to disseminate the broader project objectives and tools under development. The inclusion of paper-based activities and wheelchair walks was positively received and served as a good approach to include all attendees. Sessions that included a mix of wheelchair and non-wheelchair users began with a series of insightful discussions from what should be classed as accessible and perspectives on daily issues with accessibility—from people misusing accessible toilets, to trouble boarding buses. Students were asked to reflect on these accounts—many confessed to having used accessible toilets in the past. However, hearing the daily experiences of wheelchair users gave students a real insight into how their behavior can compound people’s problems with accessibility. Many commented that the speakers had “opened their eyes,” and that hearing first-hand accounts had given them a much clearer perspective. Feedback from students was generally positive. The active, outdoor nature of this activity led many participants to comment that it had forced them to look at barriers to accessibility in new light illuminating things they previously had not seen—as getting out and experiencing accessibility first hand is much more persuasive.
4.2. Awareness raising and public engagement in Heidelberg
4.2.1. Practices
On the occasion of the European protest day for equal rights of people with disabilities, the Heidelberg advisory board of people with disabilities organized an event at Heidelberg castle. Every year on these specific days, particular organizations plan relevant activities in order to raise awareness of the needs of disabled people including those with limited mobility. This year, the CAP4access team from GIScience group of Heidelberg University contributed by leading a mapping event at Heidelberg Castle garden.
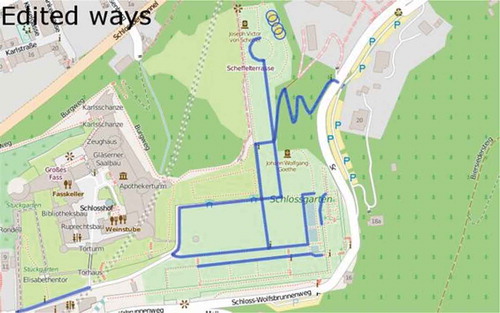
For the mapping event, a total number of 10 participants performed mapping of accessibility related information for certain objects such as footways, stairs and their conditions, including surface, smoothness, and incline. For this purpose, the participants were taught how to use data collection applications such as Mapillary and Vespucci (OSM editor for Android devices). The participants were divided into four groups in the different time slots. Overall, a total length of ways of 1600 m has been covered with images for Mapillary and a number of 15 ways got new tags for incline, smoothness and surface on OSM ().
Figure 7. Map of the area where the mapping event took place, and the edited objects (in blue).
Please note that this is only one example of such mapping events and several similar mapping events have been organized in Heidelberg throughout the 3 years’ project, and lessons learnt based on all events are concluded.
4.2.2. Lessons learned
Mapping Parties provided an enjoyable and convivial method of engaging participants in CAP4Access, and issues of accessibility more broadly—both on a European scale, and in relation to the local areas where parties were held and did not require the technical know-how needed for OSM data editing and enrichment. Engagement techniques reflected this diverse range of participants, and sought to motivate groups accordingly through appealing to a wide range of interests
The target group for OSM Mapping Parties were volunteers with an interest in OSM data acquisition. Since the project had a focus on routing applications for mobility restricted people, we have tried to collect more data on sidewalks, since as reported by Mobasheri et al. (Citation2017b), these kinds of data have low coverage in OSM.
The mapping parties can be run within a PC lab and on-site. Both formats have different advantages and disadvantages. The training material in both formats needs to be prepared. In this way, the participants will be able to learn about mapping sidewalk data.
The main advantage for a lab-based approach is that many people are taught how to map in parallel, a standard OSM editing software as well as good internet connection can be made readily available. Furthermore, weather conditions do not affect the success of the event. For the case of on-site mapping, the advantages are that the acquired data can be checked in-situ, simple digital devices such as smartphones/tablets are enough and not PC-lab equipment is needed. This may attract people passing by to learn about what is being done which in turn helps with the awareness-raising objective.
In terms of the main limitations, for the case of lab-based approach, there are no street-level images available for OSM mapping in most areas. Users need to use areal images, and in such tasks identifying sidewalks attributes such as surface conditions, and incline are difficult and impractical. The main limitation of onsite mapping is the unavailability of proper internet connection which produces costs and cannot be ensured on every location.
A common limitation for both approaches is the complex OSM tagging scheme for sidewalks, which makes it difficult to learn for inexperienced mappers. The reason behind this is that the tags require knowledge about specific notation labels and rules, and that has not yet been supported by guiding templates.
Furthermore, in terms of limitations, motivating people to engage in mapping actions proved difficult where there was not already an existing connection either direct or indirect. Even with events publicized through various media attendees were predominantly made up of people who we had been in contact with through different organizations or education providers. In order to achieve a larger turnout, a lot more time and efforts would be required to publicize activities and get supports from some key personalities. There were also some technical issues with users of Wheelmap, mainly log-in difficulties and closure due to “technical faults.” There were also some concerns about what the appropriate classification should be for some locations which were either not clear or were open to a level of subjectivity. For example, in one theater, a side entrance provided wheelchair access, the auditorium was accessible but the bar and social space were inaccessible to wheelchair users. In such cases, a detailed description is needed to supplement the simple traffic light system, which is inconvenient when working on the go to map a number of places in a short period of time.
Besides the statistics of number of volunteers and their mapping tasks, it is important to note that several participants were not aware of the needs of geospatial data as well as what options they could use in order to assist in mapping their cities. Therefore, raising the awareness is a key point that has been done during such events.
4.3. Evaluation
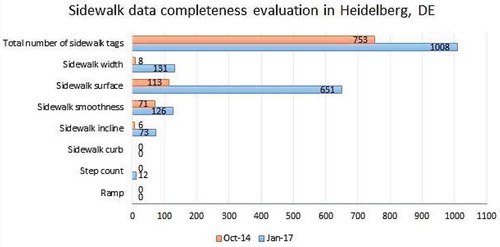
Since the aim of our tasks was to enrich the sidewalk data quality (data completeness) in OSM, we have evaluated our practices by assessing how much the completeness of sidewalk information in the pilot cities have changed by the end of the project. shows the statistics of different sidewalk information in the four pilot cities at the beginning of January 2017.
Table 3. Results of number of sidewalk objects and attributes in OSM for four pilot cities (Query date: January 2017).
The results show that almost all attributes of sidewalks is enriched compared to 2014. Among all attributes, the total number of sidewalk information has greatly increased in all four cities. In case of London, a total number of nearly 5500 new sidewalk information has been tagged by volunteers (). While in the case of smaller city, Elche, this number equals to 122. In case of Heidelberg (), the awareness raising and mapping events have resulted in about 16% increase of total number of sidewalk information compared to the starting time of CAP4Access project. This shows that the practices have been received differently by the community in selected cities. While not all the enriched information relates to the mapping parties organized within the CAP4Access project, it is understood that most of the edits are the result of increasing the awareness of people which have used their spare time for further mapping their neighborhoods.
Figure 8. Sidewalk data completeness assessment in London, UK (start and end of CAP4Access project).
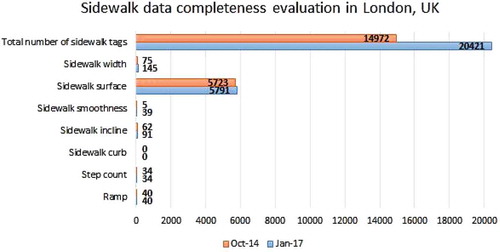
Figure 9. Sidewalk data completeness assessment in Heidelberg, Germany (start and end of CAP4Access project).
5. Conclusions
Promoting the active participation of final users in the collection and validation of data will provide the general public and local administrations with an overview of the current accessibility situation of the municipality/region and will, in particular, increase public awareness about the most serious cases of lack of accessibility of the built environment. At the same time, active participation of users helps to make sure that data are continuously updated, thereby contributing to the sustainability of the tools and platforms hosting these data (Brovelli, Minghini, and Zamboni Citation2013). Europe is now focused on providing innovative responses to current societal challenges, moving from closed innovation models to open and collaborative innovations that trigger the power of social production and collective intelligence (Bria, Gascó, and Kresin Citation2015; Brovelli et al. Citation2017). Engagement activities designed for specific outcomes (in this case of accessibility) may well achieve those goals (Davies and Simon Citation2012). For that, the tools used for citizens’ engagement should take into account the different profiles of citizens and their digital literacy to guarantee that all citizens can participate in the engagement activities (Mooney, Minghini, and Stanley-Jones Citation2015). Wilson and Musick (Citation2008) have shown that people who take part in civic or associational life tend to be those with higher socio-economic status, well educated, employed and affluent. To be effective, participatory activities should aim to represent and include the interests of the whole society. Our recommendation is addressed to foster citizens’ engagement in gathering and sharing data about accessibility as a way to collect accessible data, assess the accessibility of cities and buildings, and sustain the tools and platforms hosting these data.
Our study proves that the awareness raising and public engagement have a direct effect on the enrichment of data completeness especially for those kinds of information that target special needs (e.g. sidewalk information). This means that the volunteers are not aware of the importance of sidewalk information and hence do not care to map them in the first place. Properly informing them leads to more attention from volunteers to include sidewalk information in their daily/monthly mapping activities. It is worth noting that within the CAP4Access project, in addition to the tools presented in this article, other approaches for data collection (Bakillah et al. Citation2014b; Rousell, Hahmann, and Mobasheri Citation2016) were tested in some pilot studies which had more or less similar results with the ones presented here.
Furthermore, another important issue for future work is to integrate publicly available open data on sidewalk and kerb data into OSM. For this issue, local, regional, and national authorities should share the geographic data they hold and which are related to accessibility in open access. Existing platforms on regional, national or even European level should preferably be used for this purpose. This allows citizens to consult these datasets and businesses to exploit those therefore providing benefits for the city and broader community and mapping communities to use them for accessibility mapping (e.g. on Wheelmap, OSM). The EC’s 2011 Communication on Open Data calls for all public data including geographic data. The Directive on the re-use of public sector information provides a common legal framework for a European market of public sector information. It focuses on the economic aspects of reuse of information rather than on the access of citizens to information. In this sense, more focuses should be given to this scope in order to encourage local, regional, and national authorities to share the geographic data they have to facilitate citizens’ information, in this case, to improve their mobility.
Acknowledgments
The authors would like to thank all the other project partners who have directly/indirectly provided discussions and efforts that have led to the preparation of this article, especially those people and students who have helped in organization of mapping events. Particularly, we are thankful to Stefan Hahmann who, among others, has put great efforts in organizing the mapping events in Heidelberg, Germany.
Additional information
Funding
Notes on contributors
Amin Mobasheri
Amin Mobasheri is a PhD candidate in GIScience research group of Heidelberg University, Germany. His research interests include open geo-data, open geo-services & software, crowd sensing and Volunteered Geographic Information as well as geospatial data quality.
Alexander Zipf
Alexander Zipf is a professor at Heidelberg University. He is mainly engaged in the analysis of VGI with a strong focus on data quality, as well as in crowd sourcing and citizens as sensors.
Louise Francis
Louise Francis studied environmental science (BSc, 2003), followed by studies in phylogenetic and biodiversity (MSc, DIC, 2006) at Imperial College London, in association with the Natural History Museum. She has a number of years’ experience working with a diverse range of grass-roots and civil society organizations in the UK and throughout the Caribbean. Louise is the Co-founder and CEO of the social enterprise, Mapping for Change. She is interested in the role of participatory mapping, VGI, and citizen science in generating positive environmental and social change.
References
- Bakillah, M., and S. Liang. 2016. “Open Geospatial Data, Software and Standards.” Open Geospatial Data, Software and Standards 1: 1. https://doi.org/10.1186/s40965-016-0004-1
- Bakillah, M., S. Liang, A. Mobasheri, J. Jokar Arsanjani, and A. Zipf. 2014a. “Fine-resolution Population Mapping Using OpenStreetMap Points-of-Interest.” International Journal of Geographical Information Science 28 (9): 1940–1963. doi:10.1080/13658816.2014.909045.
- Bakillah, M., A. Mobasheri, S. H. Liang, and A. Zipf. 2013. “Towards an Efficient Routing Web Processing Service through Capturing Real-Time Road Conditions from Big Data.” The 5th Computer Science and Electronic Engineering Conference (CEEC), Colchester, UK, September 17 –18.
- Bakillah, M., A. Mobasheri, A. Rousell, S. Hahmann, J. Jokar, and S. H. Liang. 2014b. “Toward a Collective Tagging Android Application for Gathering Accessibility-Related Geospatial Data in European Cities.” The 18th AGILE International Conference on Geographic Information Science, Lisbon, Portugal, June 9 –12.
- Bria, F., M. Gascó, and F. Kresin. 2015. “Growing a Digital Social Innovation Ecosystem for Europe.” European Technical Report. doi: 10.2759/448169.
- Brovelli, M. A., M. Minghini, R. Moreno-Sanchez, and R. Oliveira. 2017. “Free and Open Source Software for Geospatial Applications (FOSS4G) to Support Future Earth.” International Journal of Digital Earth 10 (4): 386–404. doi:10.1080/17538947.2016.1196505.
- Brovelli, M. A., M. Minghini, and G. Zamboni. 2013. “Web-Based Participatory GIS with Data Collection on the Field - A Prototype Architecture.” The Free and Open Source Software for Geospatial (FOSS4G) Conference, Nottingham, UK, September 17 –21.
- Crooks, A., D. Pfoser, A. Jenkins, A. Croitoru, A. Stefanidis, D. Smith, A. Karagiorgou, A. Efentakis, and G. Lamprianidis. 2015. “Crowdsourcing Urban Form and Function.” International Journal of Geographical Information Science 29 (5): 720–741. doi:10.1080/13658816.2014.977905.
- Davies, A., and J. Simon. 2012. “The Value and Role of Citizen Engagement in Social Innovation.” TEPSIE, European Commission – 7th Framework Programme, Brussels: European Commission, DG Research. https://youngfoundation.org/wp-content/uploads/2013/11/value-and-role-of-citizen-engagement.pdf
- Department of Economic and Social Affairs, Division for Inclusive Social Development, UN. 2017. “Article 8 – Awareness-Raising.” https://www.un.org/development/desa/disabilities/convention-on-the-rights-of-persons-with-disabilities/article-8-awareness-raising.html
- Gil, J. 2015. OpenStreetMap in GIScience: Building a Multimodal Urban Network Model Using OpenStreetMap Data for the Analysis of Sustainable Accessibility. Basel, Switzerland: Springer International Publishing.
- Goodchild, M. F., and L. Li. 2012. “Assuring the Quality of Volunteered Geographic Information.” Spatial Statistics 1: 110–120. doi:10.1016/j.spasta.2012.03.002.
- The Heidelberg Institute for Geoinformation Technology. 2018. “OpenRouteService.” https://openrouteservice.org/
- Institute of Geography, Heidelberg University. 2017. “CAP4Access: Collective Awareness Platforms for Improving Accessibility in European Cities & Regions.” https://www.geog.uni-heidelberg.de/gis/cap4access_en.html
- Luxen, D., and C. Vetter. 2011. “Real-Time Routing with OpenStreetMap Data.” The 19th ACM SIGSPATIAL International Conference on Advances in Geographic Information Systems, Chicago, IL, USA, November 1–4.
- Mobasheri, A. 2017. “A Rule-Based Spatial Reasoning Approach for OpenStreetMap Data Quality Enrichment; Case Study of Routing and Navigation.” Sensors 17 (11): E2498. doi:10.3390/s17112498.
- Mobasheri, A., J. Deister, and H. Dieterich. 2017. “Wheelmap: The Wheelchair Accessibility Crowdsourcing Platform.” Open Geospatial Data, Software and Standards. doi:10.1186/s40965-017-0040-5.
- Mobasheri, A., H. Huang, L. C. Degrossi, and A. Zipf. 2018. “Enrichment of OpenStreetMap Data Completeness with Sidewalk Geometries Using Data Mining Techniques.” Sensors 18 (2): E509. doi:10.3390/s18020509.
- Mobasheri, A., Y. Sun, L. Loos, and A. L. Ali. 2017. “Are Crowdsourced Datasets Suitable for Specialized Routing Services? Case Study of OpenStreetMap for Routing of People with Limited Mobility.” Sustainability 9 (6): 997. doi:10.3390/su9060997.
- Mooney, P., and M. Minghini. 2017. Mapping and the Citizen Sensor, Chapter 3 − A Review of OpenStreetMap Data. London: Ubiquity Press.
- Mooney, P., M. Minghini, and F. Stanley-Jones. 2015. “Observations on an OpenStreetMap Mapping Party Organised as a Social Event during an Open Source GIS Conference.” International Journal of Spatial Data Infrastructures Research 10: 138–150.
- Neis, P., and D. Zielstra. 2014. “Generation of a Tailored Routing Network for Disabled People Based on Collaboratively Collected Geodata.” Applied Geography 47: 70–77. doi:10.1016/j.apgeog.2013.12.004.
- Neis, P., and A. Zipf. 2008. “Openrouteservice.Org Is Three Times ‘Open’: Combining OpenSource, OpenLS and OpenStreetMaps.” The GIS Research UK, the 16th Annual Conference GISRUK, Manchester, UK, April 1.
- Oort, P. A. J. V. 2006. Spatial Data Quality: From Description to Application. Nederland: Wageningen Universiteit. https://edepot.wur.nl/38987
- Rousell, A., S. Hahmann, M. Bakillah, and A. Mobasheri. 2015. “Extraction of Landmarks from OpenStreetMap for Use in Navigational Instructions.” The 18th AGILE Conference on Geographic Information Science, Lisbon, Portugal, June 9 –12.
- Rousell, A., S. Hahmann, and A. Mobasheri. 2016. “A Two-Tiered Approach to OSM Data Collection for Novice Users.” The 19th AGILE International Conference on Geographic Information Science, Helsinki, Finland, June 14 –17.
- Senaratne, H., A. Mobasheri, A. L. Ali, C. Capineri, and M. Haklay. 2017. “A Review of Volunteered Geographic Information Quality Assessment Methods.” International Journal of Geographical Information Science 31 (1): 139–167. doi:10.1080/13658816.2016.1189556.
- Sun, Y., and Y. Du. 2017. “Big Data and Sustainable Cities: Applications of New and Emerging Forms of Geospatial Data in Urban Studies.” Open Geospatial Data, Software and Standards 2: 24. https://doi.org/10.1186/s40965-017-0037-0
- Teslya, N. 2014. “Web Mapping Service for Mobile Tourist Guide.” The 15th Conference of Open Innovations Association FRUCT, St. Petersburg, Russia, April 21 –25.
- Vohnout, P., O. Cerba, S. Kafka, J. Fryml, Z. Krivanek, and S. Holy. 2014. “SmartTouristData Approach for Connecting Local and Global Tourist Information Systems.” IST-Africa Conference, Le Meridien Ile Maurice, Mauritius, May 7 –9.
- Walk Unlimited. 2018. “The National Trails.” https://www.nationaltrail.co.uk/
- Wilson, J., and M. Musick. 2008. Volunteers: A Social Profile. Bloomington: Indiana University Press.
- Zipf, A., A. Mobasheri, A. Rousell, and S. Hahmann. 2016. European Handbook of Crowdsourced Geographic Information: Crowdsourcing for Individual Needs – The Case of Routing and Navigation for Mobility-Impaired Persons. London: Ubiquity Press.