
ABSTRACT
Cartographic visualizations have been known for thousands of years and have brought forth a wealth of different map projections and cartographic products. Yet, cartography as an independent science has been established only about 100 years ago and sometimes its position among the spatial disciplines is challenged by the scientific community. In this respect it is a young science based on a very long tradition of map making, globe production, and the development of map projections. Maps and map related visualizations play an important and indispensable role in many other spatial disciplines such as geography and geodesy. Cartography has many overlaps with these traditional disciplines as well as with the more recent ones of photogrammetry and remote sensing. This paper reviews fundamental aspects of the conception of space and time throughout human history, the historic development of cartography from a technique of map making to a spatial science, highlighting major milestones in the history of the discipline. As a young science and confronted with major technological developments in the late 20th century cartography underwent several crises as to what exactly is cartography and how it relates to other spatial sciences, in particular to geographic information systems. Major pitfalls and misconceptions are discussed and the three major scientific pillars of cartography are identified. The relationships of cartography with neighboring disciplines are discussed and the position of cartography vis a vis the others is delineated. Finally, desirable future developments of scientific cartography are discussed.
1. Introduction
Everything that happens, happens at a certain location and at a certain point in time. Humans as spatio-temporal beings living in 3D space have been contemplating the character of space and time since the early development of higher civilizations. Their philosophical thoughts about space and time can be traced back thousands of years and are found in philosophical and religious writings – mostly creation stories – in every highly developed civilization around the globe. The general tone of these tales is that out of chaos or nothing a higher being created the gods, the earth and the sky (i.e. the natural world), followed by placing humans into this world.
Ancient examples of these creation myths are the Babylonian Creation Myth also known as Enuma Elish after the first words of the text in Akkadian language (Mark Citation2018), the Chinese creation story of Nuwa who crated human beings from the mud of the Yellow River (Mark Citation2016), the Book Genesis of the Christian Bible, or the Metamorphoses of the Roman poet Ovid where he describes how a god ended chaos by splitting off the earth from the sky and the sea from the land (Metamorphoses, book I, 5–24).
In the same way as humans contemplated their own creation and the creation of heaven and earth, they also philosophized about the nature of things, and in particular the nature of space and time. The classical approaches by the ancient Greek philosophers Heraclitus and Parmenides who – despite contrary opinions about the nature of being – are considered to be the fathers of ontology, the atomistic world view of Democritus, and the theory of forms developed by Plato are well known.
The nature of time is nicely examined in the Confessions of Augustine of Hippo where in book 11, chapter 14 he admits his dilemma: “What, then, is time? If nobody asks me, I know it. If I wish to explain it to the one who asks, I do not know.Footnote1” One of the most complete and sophisticated approaches to the philosophy of space and time is given by the German philosopher Immanuel Kant in his book Critique of Pure Reason published in 1781.
2. Highlights of cartography and its identity crises
Cartographic representations have been produced for thousands of years from early rock paintings and carvings to the development of sophisticated map projections and the underlying mathematical principles. It took, however, until the early 20th century that cartography was established as an independent science in its own right and that a scientific body of rules and theories for map design, map graphics, and communication were developed.
2.1. Historic development of cartography
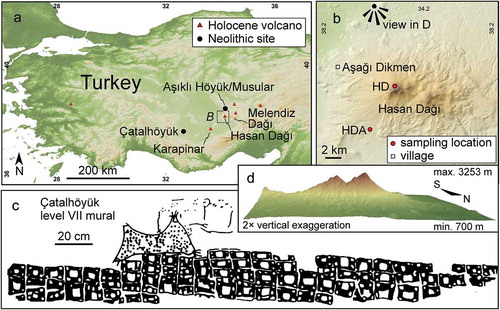
The first depictions of the night sky found in caves date back more than 15 000 years. A carving on a mammoth tusk found near Pavlov in the Czech Republic is considered to be perhaps the oldest map dating back to 25 000 BCE. shows a Neolithic mural from Çatalhöyük in Anatolia, Turkey. It is dated to approximately 6600 BCE and supposedly shows a settlement and the eruption of a nearby volcano (Schmitt et al. Citation2014).
Figure 1. Overview map with inset showing map of pumice sampling locations (a). Hasan Dağı volcano and sampling location of pumice (b). Black-and-white rendering of Çatalhöyük wall painting interpreted to show the erupting Hasan Dağı and buildings (c). 3D rendering of Hasan Dağı (d). (Schmitt et al. Citation2014).
In ancient Mesopotamia Sumerians, Akkadians and Babylonians established a highly developed system of land measurement. Prominent examples of ancient Near Eastern cartography are the Gasur map and the city map of Nippur () on clay tablets dated to 2300 BCE and 1500 BCE, respectively. A map of an ancient Egyptian gold mine drawn on papyrus, dated to about 1150 BCE, can be found in the Egyptian Museum of Turin, Italy. From ancient China we know maps drawn on silk: one famous example is the Mawangdui maps dating to the 2nd century BCE and even older maps from the 4th century BCE drawn on wood (Hsu Citation1993).
Figure 2. City map of Nippur.
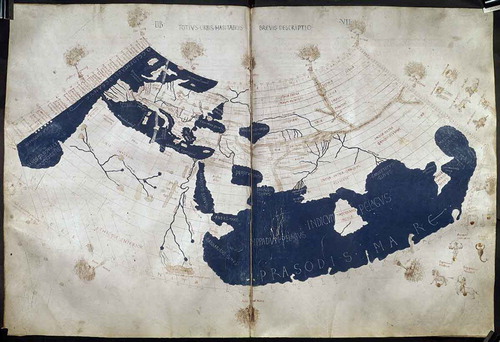
In ancient Europe the works of the Greek geographers and mathematicians provided the foundation of modern cartography by introducing meridians and parallels and one of the first calculations of the size of the Earth by Eratosthenes (276–194 BCE). Ptolemy (c. 100 – c. 170) is known for his works on mapping and map projections. shows a 15th century manuscript copy of Ptolemy’s world map.
Figure 3. Ptolemy world map (British Library Citation2019).
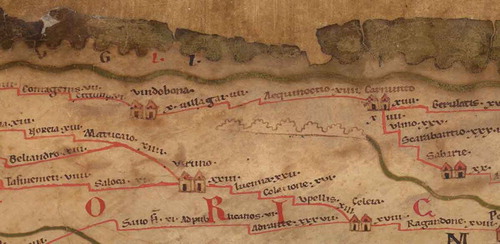
A 13th century parchment copy of a road map of the Roman Empire known as Tabula Peutingeriana is kept by the Austrian National Library (Celtis, Peutinger, and von Savoyen-Carignan Citation1200). shows a part of the map displaying Vindobona which today is the city of Vienna, Austria. In the year 1154 Al-Idrisi, an Arab cartographer who worked at the court of the Norman king Roger II of Sicily, published a book and a world map known as Tabula Rogeriana.
Figure 4. Part of the Tabula Peutingeriana showing Vindobona (Vienna) Austrian National Library http://data.onb.ac.at/rep/10002029.
The age of discoveries in the 15th and 16th centuries brought a need for navigation maps and for maps covering the newly discovered parts of the world. In 1507 Martin Waldseemüller published a book, a globe and a map of the world including the findings of Columbus and Amerigo Vespucci who conducted four expeditions to South America. The map became famous, because it is the first map that shows the name “America” on a world map. Waldseemüller justifies the name to honor Amerigo Vespucci by “ … it is the land discovered by Columbus … and Amerigo Vespucci …Footnote2”. Just a few years later, in 1513 the Ottoman admiral and cartographer Piri Reis published a world map that is only partially preserved and held in the Topkapi Palace Museum in Istanbul, Turkey.
A milestone in modern cartography is the map published by Gerhard Mercator in 1569. He proposed a world map using a conformal projection that was – as he clearly states in the title of the map – meant for navigation purposes. As a consequence of the conformal projection in normal aspect all areas toward the poles are heavily distorted whereas rhumb lines (or loxodromes) are straight lines on the map. The frequent use of the Mercator projection for maps that do not serve navigation purposes has caused a lot of unjust criticism of the Mercator map. In the following two centuries new mathematical discoveries related to calculus and differential geometry brought an explosion of new map projections. Prominent examples of leading scientists in this respect are Johann Heinrich Lambert (1728–1777) who developed many new projections (conformal conic, transverse Mercator, azimuthal equal area, and others) and Carl Friedrich Gauss (1777–1855). The French mathematician Nicolas Auguste Tissot developed the analysis of distortion, known as Tissot’s indicatrix, in the second half of the 19th century.
Until the beginning of the 20th century cartography was mainly either theoretical work on map projections and their characteristics or topographical mapping as a task of surveyors. Thematic mapping was less developed. Cartography as a science was not established until the German geographer Max Eckert (1868–1938) published his two volumes on “map science” that marked the birth of cartography as an independent discipline and science (Eckert Citation1921, Citation1925).
In the 20th century several cartographers worldwide shaped the theory and practice of the discipline. The Swiss Eduard Imhof (1895–1986) strongly influenced the style of the Swiss topographic maps and published important works on the cartographic depiction of terrain. Konstantin Alekseyevich Salishchev (1905–1988) was a Russian geographer and cartographer who made important contributions to the theory of cartography. The American cartographer Arthur H. Robinson (1915–2004) is not only known for his textbook on cartography but also for a map projection named after him. Chen Shupeng (1920–2008) is known as the founder of remote sensing and geographic information systems studies in China. He was leading in publishing national atlases of China. Erik Arnberger (1917–1987) was a leading Austrian cartographer who devoted much work to cartography as a formal science and was one of the first to clarify the relationship between cartography, geography and geodesy (Arnberger Citation1970).
2.2. Crises in cartography in the late 20th and early 21st century
The rapid development of Geographic Information Systems (GIS) and imaging technologies in the late 20th century led to an identity crisis of cartography. The classic task of map making seemed to become obsolete by the emerging digital technologies and their more and more sophisticated functions for analysis and visualization of spatial data. Earlier, as children of their time, cartographic text books made critical statements about the future of cartography and the role of maps.
In his classic textbook on thematic cartography, Witt (Citation1967) wrote: “Even more difficult, perhaps impossible, will be the task to develop the hitherto mainly static cartography into a dynamic cartography.Footnote3” In 1972, the great Swiss cartographer Imhof wrote: “Even more strange is the absurd prediction that the map as a geographic information tool will give way […] to other representations. Definitely new things will come, but maps will not disappear. On the contrary, they will gain importance as a carrier of information and display means.Footnote4” (Imhof Citation1972). In hindsight, we may conclude that Witt was wrong and Imhof was right that maps are here to stay. However, they will stay as a communication tool and not as storage media for spatial information. Databases have now taken over this role.
The somewhat cautious predictions and the predominant role of GIS for spatial data handling led to misconceptions, wrong assumptions and unnecessary fears. Every science undergoes changes and developments often triggered by outside influences. In the case of cartography these influences were closely related to developments in computer technology in general, and in hardware and software for spatial data handling in particular. What had previously been mainly a manual drawing activity, gradually became an application of computer technology with more and more sophisticated input, output, storage and processing devices. Skepticism toward emerging technologies as well as initiatives taken by perceived outsiders led to confusion and an identity crisis of cartography. Early computer-generated maps were of extremely poor quality and GIS developers payed more attention to data storage and spatial analysis functions than to the quality of GIS maps. Yet, GIS was a technological hype and many feared that cartography will become obsolete and be replaced by GIS. The separation of the data (in a database) from the map visualization (now on a digital display device) was a paradigm shift in cartography where cartographers and map users for a very long time had been used to having a database and a visualization together on a paper map. On the positive side, these developments also led to new views on the potential for dynamic and multiple representations and an extension of the cartographic theory (dynamic variables and model generalization).
In the following sections we will examine some of these misconceptions and pitfalls stemming from the consequences that the mentioned technological developments had on the understanding of what cartography is or might become.
2.2.1. Misconception of modeling
In the 1970s, fundamental research was conducted on the nature of digital maps and how to represent maps in a computer. The major misconception of that time was the assumption that maps should be stored in digital form and not the primary data from which map representations can be derived. This understanding led to terms like “map data structures” and “map data model”. Even Corbett in his groundbreaking work on the application of mathematical topology in cartography assumes a map as underlying model (Corbett Citation1979).
2.2.2. Changing the name
To keep up with the technological developments, cartographers thought that changing the name would draw more attention and strengthen the discipline. A logical move was to acknowledge the use of computers and digital technologies. “Digital cartography” and “computer cartography” were new names for the discipline in the hope this will silence voices claiming that cartography becomes irrelevant. Even a new paradigm called “cybercartography” was introduced by Taylor and Lauriault (Citation2005). All this seems unnecessary when we accept that every discipline has to adapt to new developments and evolves naturally. It is still cartography!
2.2.3. Introducing confusing new terms
Another attempt to save cartography from marginalization was to focus on the cartographic aspects of spatial information systems. New terms like “cartographic information system” and “atlas information system” were introduced (Kelnhofer Citation1996; Lechthaler Citation2010). It can be argued that these “new” concepts are nothing else than digital cartographic products and digital atlases. Consequently, they were short-lived and only of local interest in central Europe and in particular the German speaking regions.
2.2.4. Death of cartography
A side effect of the steep rise of GIS and remote sensing was a decline of surveying engineering and cartography. Many university programs saw dramatic developments with shrinking student numbers and consequently with discontinued programs and canceling of faculty positions. Some universities countered this development by re-naming their programs to geomatics engineering or GIS. We even saw the end of cartography (Wood Citation2003) and a rebuttal to this claim (Carter Citation2004).
3. What, then, is cartography?
Every textbook on cartography provides definitions of cartography and map. Over the years and depending on the predominant streams in the discipline we find variations of these definitions. The authoritative body of the cartographic discipline is the International Cartographic Association (ICA). On the web pages of ICA, we find two definitions of cartography and map from the years 1995 and 2003, respectively (ICA Citation2019).
The definition for cartography from 1995 reads as: “Cartography is the discipline dealing with the conception, production, dissemination and study of maps.” The recent definition from 2003 is “Cartography … The art, science and technology of making and using maps” (ICA Citation2019). Whereas both definitions deal with making and using maps, the latter includes the art of making and using maps thereby emphasizing a recent trend to consider the artistic aspect in maps and map making. One could also argue that whenever art is concerned we deal with very subjective judgments that evade a purely scientific approach. However, we can interpret art as skills and craftsmanship.
In 1995, ICA defined map as “A map is a symbolised image of geographical reality, representing selected features or characteristics, resulting from creative effort of its author’s execution of choices, and designed for use when spatial relationships are of primary relevance.” In 2003, the definition was modified to “A map is a symolised representation of geographical reality, representing selected features or characteristics, resulting from the creative effort of its author’s execution of choices, and is designed for use when spatial relationships are of primary relevance” (ICA Citation2019). The only difference between these two definitions is that “image” is replaced by “representation”. Both definitions talk about a model of reality.
Considering that the most recent official definitions are more than 15 years old and the developments in cartography and the spatial information sciences have progressed we can modify the definition to:
Cartography is the science and technique of producing maps and map related products. These products are digital or analog models of (a virtual) reality. Cartographic research focuses on
Map graphics (semiotics as language of cartography)
Epistemological aspects: modeling and object relationships in space and time (ontology)
Spatio-temporal communication
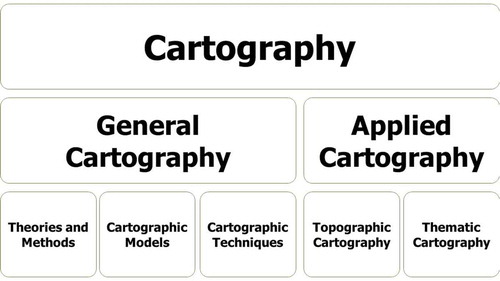
The three aspects of semiotics, modeling, and communication form the core of cartography. Each aspect appeared more or less prominent throughout the last century. A more functional explanation of what cartography does, is that cartography translates spatial data into spatial information through visualizations. gives an overview of the building of cartography and its sub-disciplines.
Figure 5. The structure of cartography.
4. The others: related disciplines
As a discipline dealing with spatial data cartography has many natural overlaps with neighboring disciplines such as geography, GIS, photogrammetry, remote sensing, and geodesy. In the following sections the various disciplines will be briefly characterized and their relationships with cartography will be discussed.
4.1. Geography
Perhaps the closest relationship cartography has is with geography. From antiquity until the present-day geographers have produced and worked with maps. Even the term geography predates the term cartography. The very nature of modern geography is to study the surface of the earth and its spatial differentiation, its physical characteristics as well as the space and place of human lives and actions. Geography also deals with humans in their physical and social environments. shows the structure of modern geography with its differentiation into physical and human geography as well as regional research.
Figure 6. The structure of geography.
The close relationship and many overlaps of geography and cartography often leads to the misconception that cartography is a part or sub-discipline of geography. When we look closer at the research objects of each discipline, we clearly see that cartography focuses on the map language, modeling and communication, whereas geography deals with different concepts. An example with two completely different disciplines from cartography and geography should illustrate the argument.
Considering mathematics and physics as related and yet independent disciplines we must conclude that physics cannot be done without mathematics. Mathematics is an indispensable tool for physicists. Yet, it is clearly recognized that mathematics and physics have different research objects and are two independent disciplines. When we transfer the argument to cartography and geography by analogy, we must state that maps are an indispensable tool for geographers and geography can hardly be done without using maps. Both have different research objects and consequently should be recognized as two related yet different independent disciplines.
4.2. GIS
Geographic information systems are all about spatial analysis. Beginning in the 1960s they were originally developed to store, manage, analyze and present spatial data. shows the functional components of GIS.
Figure 7. Functional components of GIS.
Their focus has always been on storage, management, and analysis. The visualization part of GIS is just one, however, not the most important part. In the beginning, GIS research was primarily done in geography and surveying engineering. Only in the 1980s GIS found their own place in the scientific community with the first textbooks and the first scientific journal. In 1985 a small monograph on GIS was published by Purkynĕ University (now Masaryk University) in Brno, Czech Republic (Konečný and Rais Citation1985); the first English language textbook appeared one year later (Burrough Citation1986), and the International Journal of Geographical Information Systems was launched in 1987.
The fact, that cartographic visualizations are one essential part of every GIS, and that these functions – in particular in the early days of GIS – were poorly developed, led to controversial assumptions as to the nature of GIS. Bähr (Citation1992) defined GIS as the continuation of cartography by other means.Footnote5 Others even turned away from GIS and proposed cartographic information systems (see section 2.2.3 above).
4.3. Geodesy, photogrammetry, and remote sensing
Geodesy like geography is a discipline that dates back several millennia. Already in the ancient Near East and in ancient Egypt land measurement and administration were practiced. In ancient Greece Eratosthenes was the first to measure the size of the earth by calculating the length of the radius of the earth as a sphere. Cartography overlaps with geodesy in several aspects of land surveying and mapping. However, the purpose of land surveying and mapping is to assess and map the land (primarily through cadastral and topographic maps) and not to focus on the theory of cartography.
Photogrammetry and remote sensing are relatively young disciplines. Only since the invention of photography in the 19th century it was possible to measure from images, and only since the launch of the first earth observation satellites in the 20th century remote sensing became an important discipline. The overlap with photogrammetry and remote sensing and cartography lies again in the mapping part. In particular image maps and mapping from point clouds apply visualization methods developed by cartography.
4.4. Geo-information science
Geo-information science (or GI-Science) is the integration of different disciplines dealing with spatial information (). It was introduced as geographical information science by Goodchild (Citation1992) meaning the science behind the systems or research about GIS and research with GIS.
Figure 8. Spatial sciences and their overlaps.
Since its inception GI-Science has become a prominent field in the spatial information sciences reaching into other domains such as cognitive science, psychology, linguistics, philosophy, social sciences, and computer science.
5. Summary and outlook
Coming from a very long tradition of map making in the context of geography and land surveying, cartography as a science is still a young discipline of about one century of age. The rapid developments of information technology in the second half of the 20th century had a profound influence on the development and understanding of cartography as a discipline. Influenced by the developments in neighboring disciplines, in particular by GIS and remote sensing, cartography had to find its identity in the group of spatial sciences. After a crisis in the 1990s and early 2000s cartography has found its focus again and stands strong as a relevant discipline. Considering the three main pillars of semiotics, modeling, and communication, we can identify current and future challenges for the development of cartography.
Semiotics is one fundamental pillar of cartographic visualizations. The study of signs and their use as “language” of cartography requires new approaches considering three-dimensional and temporal data. A unified theory of map design combining topographic and thematic mapping as well as for visualization of spatio-temporal 3D data should be developed.
Cartographic products are models of reality. This reality can be real or virtual. Maps as we know them are just one way to visualize spatio-temporal data. We, therefore, need integrated models of realities considering the spatial and temporal dimensions (ontologies) from which “maps” can be derived in various levels of detail (generalization).
Research on new and novel visualization techniques and technologies needs to be conducted. Flexible and foldable displays would fundamentally change the way we use maps and atlases, as smartphones and tablets changed the way we communicate and consume information. Globes that had largely come out of use, recently received a strong revival through the introduction of hyper globes. These are spherical displays where the image is projected either from outside or from inside onto the surface of a sphere. Through modifications of the projected images the globe appears to spin or the images move over the surface. This is a perfect way to visualize dynamic global phenomena. More development is needed toward high resolution spherical displays and solid 3D displays using holographic images.
Additional information
Notes on contributors
Wolfgang Kainz
Wolfgang Kainz is a full professor of cartography and geo-information science at the Department of Geography and Regional Research of the University of Vienna, Austria, where he conducts research and teaching on the mathematical principles of GIS, uncertainty and topology in GIS.
Notes
1. Translated by the author from the original Latin: “quid est ergo tempus? si nemo ex me quaerat, scio; si quaerenti explicare velim, nescio.”
2. Translated by the author from the original Latin “Est enim terra per Columbum … atque Americum Vesputium … inventa … ”.
3. Author’s translation.
4. Author’s translation.
5. Bähr is paraphrasing the Prussian general Carl von Clausewitz (1780–1861) who defined war as a mere continuation of politics by other means.
References
- Arnberger, E. 1970. “Die Kartographie als Wissenschaft und ihre Beziehungen zur Geographie und Geodäsie [Scientific Cartography and its Relations to Geography and Geodesy].” In Grundsatzfragen der Kartographie, edited by Österreichische Geographische Gesellschaft, 1–28. Vienna, Austria.
- Bähr, H.-P. 1992. “Beiträge von Photogrammetrie und Fernerkundung für Geo-Informationssysteme.” In Technologie Geographischer Informationssysteme, edited by A. Kilchenmann, 241–251. Berlin, Heidelberg: Springer.
- British Library. 2019. Ptolemy World Map. British Library. Accessed 7 October 2019. http://www.bl.uk/catalogues/illuminatedmanuscripts/ILLUMIN.ASP?Size=mid&IllID=28894
- Burrough, P. A. 1986. Principles of Geographical Information Systems for Land Resources Assessment. Monographs on Soil and Resources Survey (Book 12). Oxford: Oxford University Press.
- Carter, J. R. 2004. “Cartography Is Alive (Thank God!).” Cartographic Perspectives 49: 4–9. doi:10.14714/CP49.437.
- Celtis, K., K. Peutinger, and E. von Savoyen-Carignan. 1200. Tabula Peutingeriana. https://omnesviae.org/viewer/
- Corbett, J. P. 1979. “Topological Principles in Cartography.” Technical paper – U.S. Department of Commerce. Washington, DC: Bureau of the Census, 48.
- Eckert, M. 1921. Die Kartenwissenschaft: Forschungen und Grundlagen zu einer Kartographie als Wissenschaft: 1. Berlin: Vereinigung Wiss. Verleger.
- Eckert, M. 1925. Die Kartenwissenschaft: Forschungen und Grundlagen zu einer Kartographie als Wissenschaft: 2. Berlin: Vereinigung Wiss. Verleger.
- Goodchild, M. F. 1992. “Geographical Information Science.” International Journal of Geographical Information Systems 6 (1): 31–45. doi:10.1080/02693799208901893.
- Hsu, M.-L. 1993. “The Qin Maps: A Clue to Later Chinese Cartographic Development.” Imago Mundi 45: 90–100. doi:10.1080/03085699308592766.
- ICA. 2019. “Mission”. International Cartographic Association. Accessed 7 October 2019. https://icaci.org/mission/
- Imhof, E. 1972. Thematische Kartographie [Thematic Cartography]. Berlin, NY: Walter de Gruyter.
- Kelnhofer, F. 1996. “Geographisch und/oder Kartographische Informationssysteme.” In Kartographie im Umbruch — Neue Herausforderungen, neue Technologien. Beiträge zum Kartographiekongress Interlaken 96. Kartographische Publikationsreihe, edited by L. Hurni, 9–26. Vol. 14. Wabern, Switzerland: Schweizerische Gesellschaft für Kartographie.
- Konečný, M., and K. Rais. 1985. Geografické Informačni Systemý, 13. Vol. 26. Brno, Czech Republic: Folia Facultatis Scientiarum Naturalium Universitatis Purkynianae Brunensis.
- Lechthaler, M. 2010. “Interactive and Multimedia Atlas Information System as a Cartographic Geo-communication Platform.” In Cartography in Central and Eastern Europe. Lecture Notes in Geoinformation and Cartography, edited by G. Gartner and F. Ortag, 384–402. Berlin: Springer.
- Mark, E. 2016. Most Popular Gods & Goddesses of Ancient China. Ancient History Encyclopedia. Accessed 25 April 2016. https://www.ancient.eu/article/894/
- Mark, J. J. 2018. Enuma Elish - The Babylonian Epic of Creation - Full Text. Ancient History Encyclopedia. Accessed 4 May 2018. https://www.ancient.eu/article/225/
- Schmitt, A. K., M. Danišík, E. Aydar, E. Şen, Ĺ. Ulusoy, and O. M. Lovera. 2014. “Identifying the Volcanic Eruption Depicted in a Neolithic Painting at Çatalhöyük, Central Anatolia, Turkey.” PLoS ONE 9 (1): e84711. doi:10.1371/journal.pone.0084711.
- Taylor, D. R. F., and T. Lauriault, eds. 2005. Cybercartography: Theory and Practice. Amsterdam: Elsevier.
- Witt, W. 1967. Thematische Kartographie: Methoden und Probleme, Tendenzen und Aufgaben [Thematic Cartography, Methods and Problems, Trends and Tasks]. Hannover: Gebrüder Jänecke.
- Wood, D. 2003. “Cartography Is Dead (Thank God!).” Cartographic Perspectives 45: 4–7. doi:10.14714/CP45.497.