
ABSTRACT
This paper presents a brief overview of the geospatial technologies developed and applied in Chang’e-3 and Chang’e-4 lunar rover missions. Photogrammetric mapping techniques were used to produce topographic products of the landing site with meter level resolution using orbital images before landing, and to produce centimeter-resolution topographic products in near real-time after landing. Visual positioning techniques were used to determine the locations of the two landers using descent images and orbital basemaps immediately after landing. During surface operations, visual-positioning-based rover localization was performed routinely at each waypoint using Navcam images. The topographic analysis and rover localization results directly supported waypoint-to-waypoint path planning, science target selection and scientific investigations. A GIS-based digital cartography system was also developed to support rover teleoperation.
1. Introduction
Unmanned lunar and Mars rovers are in-situ robotic explorers that provide detailed information on the topography, geology and mineralogy of the landing sites with much higher resolutions than that from orbiters. So far, successfully landed rovers include Lunokhod-1 and Lunokhod-2 lunar rovers of the former Soviet Union, Sojourner, Spirit, Opportunity and Curiosity Mars rovers of the USA, Yutu and Yutu-2 lunar rovers of China (Zakrajsek, Mckissock, and Woytach Citation2005; Golombek et al. Citation1999; Li et al. Citation2005; Grotzinger et al. Citation2012; Liu, Di, and Peng Citation2015; Wu, Li, and Zuo Citation2019; Di, Liu, and Liu Citation2019a).
Chang’e-3 (CE-3) probe, including a lander and a rover, successfully landed in northern Mare Imbrium of the moon on 14 December 2013 The Yutu (Jade Rabbit) rover was released to the lunar surface and began surface exploration on December 15. The rover traversed 114.8 m (cross-site visual localization result) on the lunar surface and accomplished a series of scientific investigations under teleoperation (Liu, Di, and Peng Citation2015; Xiao et al. Citation2015).
Figure 1. Photos of the CE-3 and CE-4 rovers on the lunar surface taken by the landers.
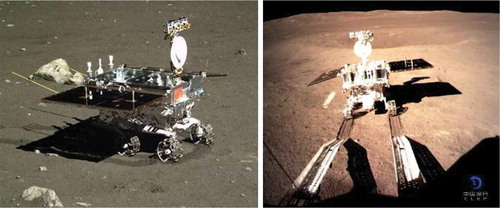
Chang’e-4 (CE-4) mission was designed to be a backup of the CE-3 mission. With the support of the Queqiao (Magpie Bridge) relay satellite orbiting Earth-Moon L2 point, the CE-4 probe successfully landed on the far side of the moon in Von Kármán crater inside the South Pole–Aitken (SPA) basin on 3 January 2019. The Yutu-2 rover was successfully released from the lander and touched on the lunar surface on the same day. The success of CE-4 marks the first soft landing of human spacecraft on the far side of the moon and provides a unique opportunity for in-situ exploration of the SPA basin which is the oldest and largest impact basin on the moon (Jia et al. Citation2018; Huang, Xiao, and Flajault Citation2018; Wu, Li, and Zuo Citation2019; Di, Liu, and Liu Citation2019a; Di et al. Citation2019b). As of 4 December 2019, the rover has traversed 345.059 m (odometer reading) (China Daily Citation2019). shows the CE-3 and CE-4 rovers on the lunar surface photographed by the cameras on-board the landers.
In CE-3 and CE-4 lunar rover missions, geospatial technologies were extensively used to support various scientific studies of the landing sites, and to support mission operations such as topographic mapping, hazard detection, path planning, rover localization and navigation, etc. (Wan et al. Citation2014; Peng, Wan, and Wu Citation2014; Liu, Di, and Peng Citation2015; Di et al. Citation2016; Liu, Di, Li Citation2019). The Planetary Remote Sensing team of State Key Laboratory of Remote Sensing Science, Institute of Remote Sensing and Digital Earth (RADI), Chinese Academy of Sciences, in collaboration with the rover teleoperation team of Beijing Aerospace Control Center (BACC), developed and applied the technologies for teleoperation of the rovers at BACC during the missions. The paper presents a brief overview of the geospatial technologies and applications in these two lunar rover missions.
2. Data and technical framework
Geospatial technologies for landing site mapping and rover localization have been performed using multiple data sources, including orbital data acquired by previous or ongoing orbiter missions, descent images acquired by the lander during the entry, descent and landing (EDL) process, and rover images taken by the rover after landing.
In the early phase of a lunar rover mission, landing site selection is critical and is usually accomplished by careful evaluation of scientific requirements and constraints for engineering implementation (Zhao, Li, and Wu Citation2019). Landing site topographic analysis is one of the key steps in the landing site selection process. This requires both digital elevation model (DEM) and digital orthophoto map (DOM) of the candidate landing sites. The products are primarily generated by photogrammetric mapping technology using high-resolution orbital images.
The orbital data used in topographic mapping and characterization of CE-3 and CE-4 landing sites mainly include Chang’e-2 (CE-2) images and Lunar Reconnaissance Orbiter Camera (LROC) Narrow Angle Camera (NAC) images. CE-2 orbiter acquired forward- and backward-looking stereo images (viewing angle 7.98 and -17.2 degrees, respectively) in the same orbit through push-broom imaging; the stereo images cover the entire moon with a spatial resolution of 7 m, and in the CE-3 landing site 1.5-m resolution images are available (Zuo, Li, and Zhang Citation2014). Based on CE-2 stereo images, DEM (20-m grid spacing) and DOM (7-m resolution) of the entire moon were produced and released by the Lunar and Deep Space Exploration Science Applications Center of National Astronomical Observatories, Chinese Academy of Sciences (NAOC) (Li, Liu, and Ren Citation2018; Ren et al. Citation2019). LROC NAC images have spatial resolutions of 0.5–2 m and almost cover the entire moon surface (Robinson et al. Citation2010); NAC stereo images can be acquired from adjacent orbits using off-nadir slew, but the stereo coverage is very limited. In addition to CE-2 and LROC images, the SLDEM2015 (Barker et al. Citation2016) and LROC Wide-Angle Camera (WAC) mosaic (Wagner et al. Citation2015) were also used for landing site topographic analysis and characterization.
Both CE-3 and CE-4 landers carry a downward-looking descent camera with a Field Of View (FOV) of 45.4° and an image size of 1024 × 1024 pixels (Liu, Di, and Peng Citation2015). The descent camera took thousands of images (about 4600 in CE-3 and 5300 in CE-4 mission) with resolutions from meter level to millimeter level during the EDL process. The descent images were used in lander localization and landing site mapping.
Both Yutu and Yutu-2 rovers carry three pairs of stereo cameras, i.e. panoramic camera (Pancam), navigation camera (Navcam), and hazard avoidance camera (Hazcam). Pancam and Navcam are mounted on the same camera bar atop the rover mast; Hazcam is fixed on the lower front of the rover body. Both Pancam and Navcam have a stereo base of 270 mm. Pancam has an image size of 2352 pixels × 1728 pixels, and a FOV of 22.9° ×16.9° (Jia et al. Citation2018). Navcam has an image size of 1024 × 1024 pixels, a FOV of 46.6° (Liu, Di, and Peng Citation2015). Along the traverse in each mission, the rover obtains Navcam stereo images at every waypoint and acquires Pancam stereo images some waypoints. These stereo images have been routinely used in detailed topographic mapping and rover localization to support mission operations.
The geospatial technologies and derived products have directly contributed to the safe and efficient surface operations of the rovers. The mapping and localization products have also been frequently used to support various scientific investigations before and during the missions, e.g. to support data acquisition and analysis by other science instruments, such as the Visible and Near-Infrared Imaging Spectrometer (VNIS) and the Lunar Penetrating Radar (LPR) for investigations of mineralogical compositions and subsurface structures, respectively (Xiao et al. Citation2015; Di et al. Citation2016; Li et al. Citation2019; Gou et al. Citation2019; Di et al. Citation2019b).
shows the technical framework of the geospatial technologies developed and applied in CE-3 and CE-4 missions. Photogrammetric mapping using orbital images is performed before the launch of the landers and rovers for general topographic analysis of the landing sites. The mapping products include DEM and DOM, and some derived products such as slope map and contour map. The orbital DOM is used as a basemap to support lander localization, which is accomplished quickly (e.g. within 30 min) after landing. During surface operations, detailed topographic mapping and rover localization are performed at the earth control center (i.e. BACC) in near real-time, i.e. a couple of minutes after the rover images are downlinked. More details of the key techniques and results are given in the following sections.
Figure 2. Technical framework of the geospatial technologies and applications in CE-3 and CE-4 missions.
3. Photogrammetric mapping techniques and applications
3.1. Landing site mapping using orbital images
Photogrammetric mapping techniques, such as rigorous sensor modeling, bundle block adjustment, and image matching, have been developed in order to produce DEM and DOM from CE-2 images (Di et al. Citation2014; Wu, Hu, and Guo Citation2014; Li, Liu, and Ren Citation2018; Liu et al. Citation2018; Ren et al. Citation2019). The DEM and DOM have been used in topographic characterization (e.g. slop and crater distributions) of CE-3 and CE-4 landing sites (Wu, Hu, and Guo Citation2014; Di et al. Citation2019b; Di, Liu, and Liu Citation2019c; Zhao, Li, and Wu Citation2019).
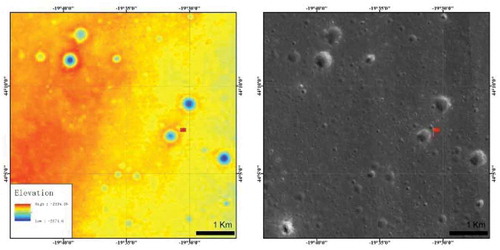
CE-2 orbiter acquired 1.5-m resolution images at the pre-selected CE-3 landing site (40°N ~50°N, 18°W ~35°W). shows a 4-m-resolution DEM and a 1.5-m-resolution DOM of CE-3 landing site generated from the 1.5-m-resolution CE-2 stereo images of No. 0236 track by the NAOC team. The maps are rendered in the Mercator projection; the elevation value is with respect to the reference sphere with a radius of 1737.4 km, and the red flag indicates the location of CE-3 lander (Liu, Di, and Peng Citation2015).
Figure 3. DEM (Left) and DOM (Right) of CE-3 landing site.
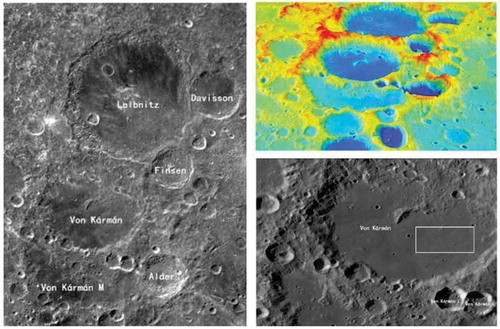
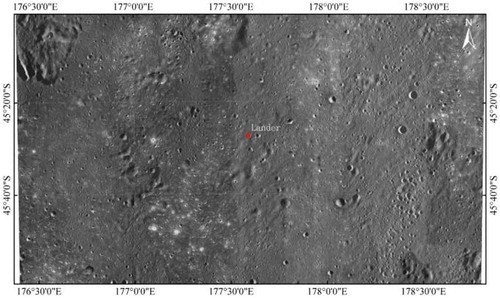
shows the imagery and topography of CE-4 landing site and surrounding area. The pre-selected landing site (white box in the lower-right image of ) is in the southeast of Von Kármán crater and covers the area of (176.4°E ~ 178.8°E, 45.0°S ~ 46.0°S), approximately 52 km × 30 km. The resolutions of the CE-2 DOM and LROC WAC mosaic are 7 m and 100 m, respectively. The resolution of the SLDEM2005 is about 42 m in this region; the landing site region is generally flat in this scale.
Figure 4. Imagery and topography of CE-4 landing site and surrounding area. Left: CE-2 DOM, Upper-right: 3D perspective of color-coded SLDEM2015, Lower-right: LROC WAC mosaic and pre-selected landing site (white box) of CE-4.
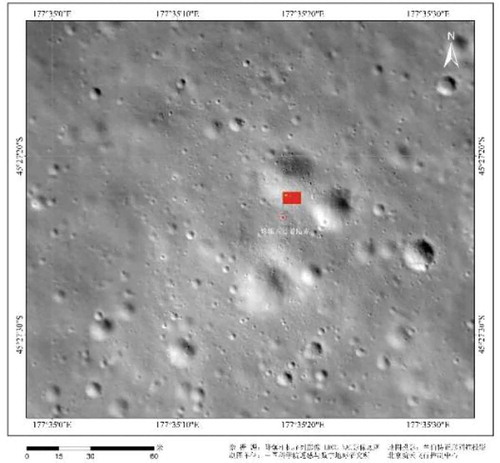
Based on 100 high-resolution LROC NAC images of CE-4 landing site, we produced a seamless DOM mosaic with 0.9-m resolution using similar techniques for producing a seamless DOM mosaic of Chang’e-5 landing region using LROC NAC images (Di et al. Citation2018, Citation2019d). shows the DOM mosaic in Lambert conformal conic projection. The DOM has an image size of 57,483 columns × 34,084 rows. It reveals a lot of details of the topographic features, e.g. numerous small craters that are not discernable in the maps shown in . In particular, there are many secondary crater clusters and ejecta materials which can be traced back to several craters in the vicinity (Di et al. Citation2019b; Di, Liu, and Liu Citation2019c). In addition to applications in landing site characterization, this high-resolution DOM, along with CE-2 DOM, has been used as a basemap in lander localization and long-term rover traverse planning (Di, Liu, and Liu Citation2019a; Liu, Di, Li, Citation2019).
Figure 5. LROC NAC DOM mosaic of CE-4 landing site with a resolution of 0.9 m (Liu, Di, Li Citation2019).
3.2. Landing site mapping using descent images
The sequential descent images were utilized to produce topographic maps with higher resolutions than those generated from orbital images. In CE-3 mission, 180 descent images were selected at intervals from 2.35 km to 10-m altitude, photogrammetric processing techniques, including feature matching, bundle adjustment, dense matching, space intersection, and DEM interpolation, were employed to produce DEM and DOM products of the landing site; 26 Ground Control Points (GCPs) and 18 checkpoints were selected from the CE-2 DEM and DOM for the bundle adjustment and accuracy assessment (Liu, Di, and Peng Citation2015). DEM and DOM products with 0.4-m, 0.2-m, and 0.05-m resolutions were generated, respectively. shows the DEM and DOM that cover an area of 97 × 115 m with 0.5-m resolution. The 0.4-m resolution DEM and DOM cover a larger area of 780 × 1800 m. Small features, e.g. rocks, can be identified from these maps. The maps were used as basemaps for rover localization and traverse planning.
Figure 6. CE-3 landing site DEM and DOM (0.05-m resolution) generated from descent images (Liu, Di, and Peng Citation2015).
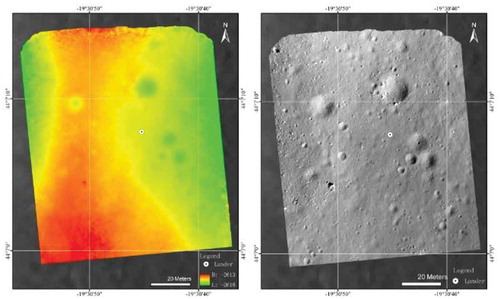
In CE-4 mission, 80 descent images were selected and used for detailed landing site mapping, with GCPs selected from the LROC NAC DOM (). shows the DOM that covers an area of 211 m × 187 m with 0.03-m resolution. Small features, e.g. meter level craters, were identified and measured from this very high-resolution DOM. It was used for a detailed analysis of the landing site and utilized as one of the basemaps for overall rover traverse planning.
Figure 7. CE-4 landing site DOM (0.03-m resolution) generated from descent images (Di, Liu, and Liu Citation2019c).
3.3. Detailed topographic mapping using rover images
In the two rover missions, local DEM and DOM with 0.02-m resolution were automatically produced in near real-time at each waypoint along the rover traverse using Navcam images. These maps were essential to support hazard analysis and rover path planning.
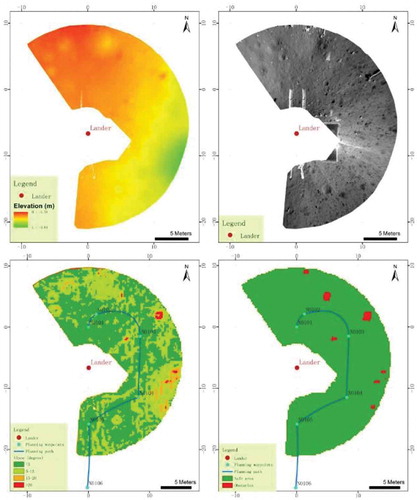
shows the DEM and DOM, and further-derived slope map and obstacle map at the lander location of CE-3. When producing the slope map, the DEM was down-sampled to 0.2-m resolution and the slope value was obtained through the local plane fitting of the z-values of 3 × 3 cell neighborhood; obstacle map was produced subsequently considering slope and elevation difference constraints (Liu, Di, and Peng Citation2015).
Figure 8. DEM (Upper-left), DOM (Upper-right), slope map (Lower-left), and obstacle map (Lower-right) derived from CE-3 Navcam images at the lander location (Liu, Di, and Peng Citation2015).
Pancam stereo images were acquired at some locations along the rover traverse for scientific investigation of the site, e.g. surface feature analysis and science target selection. The rover took 56 pairs of images with 28 different azimuth angles and 2 elevation angles to form a 360° panorama at one location. shows three 360° image mosaics automatically generated from the Pancam left-eye images taken by Yutu-2 rover at three locations (black dots labeled by S1, S2, and S3 in ). It is worth noting that the bright white stripes in the image mosaics are due to light reflections by the rover body.
Figure 9. The 360° Pancam image mosaics generated from left-eye images taken by Yutu-2 rover at three locations.
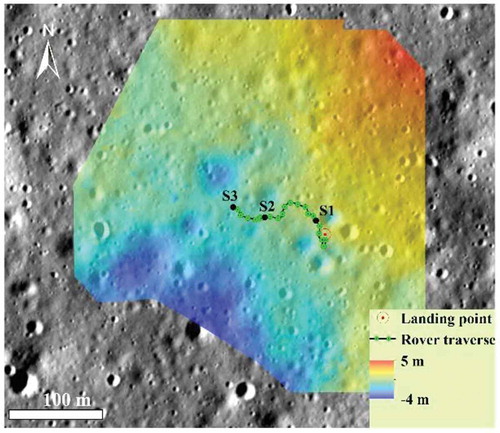
Three DEMs (0.05-grid spacing) at the three locations were automatically generated from the Pancam stereo images and then were merged into a larger DEM (380 × 390 m) based on accurate locations of the rover determined by the visual localization technique (see section 4.2). shows the merged DEM overlaid on the LROC NAC DOM. and reveal that in finer resolution the terrain of CE-4 landing site is much rugged and is generally higher in the NE than in the SW. This DEM contributed to the study of the topographic evolution of Von Kármán crater (Di et al. Citation2019b), which is significant to understanding the origin of the surface material measured by Yuyu-2 rover (Li et al. Citation2019; Gou et al. Citation2019).
Figure 10. DEM of CE-4 landing site derived from Pancam images taken at three locations (black dots).
4. Visual positioning techniques for rover localization and navigation
4.1. Lander localization
The locations of CE-3 and CE-4 landers were initially determined by the radio-tracking technique. To improve the positioning accuracy, lander localization was performed in each mission using visual positioning techniques immediately after landing. The CE-3 lander location was determined to be (19.51256°W, 44.11884°N) (marked in and ) through feature matching between the Navcam DOM (from images acquired when the rover was on the lander) and the descent DOM (), which was already registered to CE-2 DOM (Liu, Di, and Peng Citation2015). The CE-4 lander location was determined to be (177.588°E, 45.457°S) (marked in , and ) on the LROC NAC DOM through matching between descent images and the basemap (Di, Liu, and Liu Citation2019a). The CE-4 lander location was also determined on CE-2 DOM and SLDEM2015. High-precision lander localization in multi-source data is valuable to support the synergistic scientific investigation of the landing site using multiple data sets. In addition to lander localization, the descent and landing trajectory can be recovered based on bundle adjustment of sequential descent images (Liu, Xu, and Liu Citation2014; Wan, Liu, and Liu Citation2019; Liu, Ren, Li, Citation2019).
4.2. Rover localization
Localization of the rover with high accuracy is important for rover path planning and approaching science targets. The onboard dead-reckoning system, including wheel odometer and Inertial Measurement Unit (IMU), provides the initial locations of the rover along the traverse in real time. To reduce the localization error caused by wheel slippage and IMU drift, visual positioning techniques, namely cross-site visual localization and DOM matching, have been routinely applied to localize the rover with high accuracy using the Navcam images. The cross-site visual localization method is based on ASIFT feature matching and bundle adjustment of Navcam images acquired at adjacent sites (waypoints) (Wan et al. Citation2014); it was applied in near real-time (a couple of minutes after images downlinked) at each waypoint to support teleoperation of the rover. The DOM matching method is based on feature matching between the DOMs generated from Navcam stereo images and the basemaps generated from orbital or descent images (Liu, Di, and Peng Citation2015); it was applied at some waypoints where distinguishing features (e.g. small craters and large rocks) are available in the local areas.
In CE-3 mission, the overall traverse distance from the lander is 114.8 m from cross-site visual localization and 111.2 m from DOM matching; both results are of higher accuracy than that from dead reckoning and the DOM matching result is of highest accuracy (Liu, Di, and Peng Citation2015). shows the Yutu rover traverse map with the traverse from the DOM matching method overlaid on the descent DOM.
Figure 11. Yutu rover traverse map.
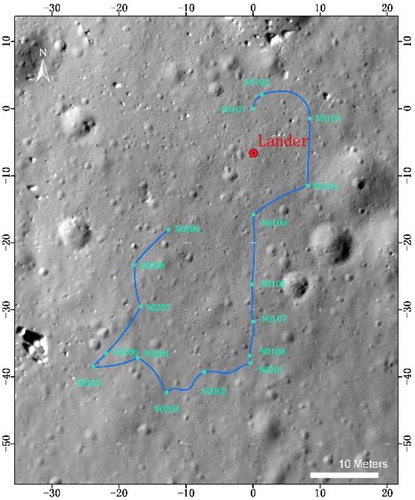
In CE-4 mission, Yutu-2 rover traveled 190.66 m from the lander according to wheel odometer by the end of the 5th lunar day (11 May 2019). The overall traverse distance was calculated to be 186.66 m from visual localization, which should have corrected some wheel slippage (Liu, Di, and Li Citation2019). By the end of the 11th lunar day (21 November 2021), the rover traveled 318.62 m (odometer reading) (CLEP, Citation2019). As of 4 December 2019, Yutu-2 rover has traveled 345.059 m (odometer reading) on the far side of the moon and accomplished the exploration tasks for the 12th lunar day (China Daily Citation2019). Visual localization of the rover has been continually performed to support the surface operations of CE-4 mission. The latest results will be reported in the future.
4.3. Application in rover navigation
Rover navigation is critical for safe and efficient traversing, and science target approaching. Path planning is a key component of rover navigation. During the mission operations, path planning was implemented by the teams of BACC and China Academy of Space Technology. Topographic analysis and rover localization results directly contributed to the three levels of rover path planning, namely overall planning, exploration period planning, and navigation unit planning (Yu, Fei, and Li Citation2019). The high-accuracy rover location and topographic information were indispensable for the analysis of the important factors of path planning, such as terrain attainability, hazard, illumination condition, communication attainability, traverse cost, etc.
5. GIS technology and applications
The abovementioned photogrammetric mapping and visual positioning techniques were developed and implemented as the topographic mapping and rover localization sub-systems, which are important parts of the rover teleoperation system at BACC. Meanwhile, Geographic Information System (GIS) technology was also used in support of surface operations and scientific studies in the two missions. For example, the RADI team, in collaboration with the BACC team, developed a stand-alone digital cartography system for supporting rover teleoperation based on ArcGIS Engine – Developer Kit. shows the main interface of the system.
Figure 12. Main interface of the digital cartography system for supporting rover teleoperation.
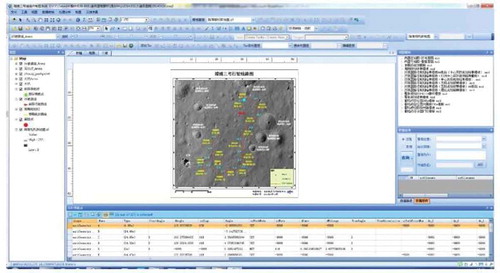
The major purpose of this GIS-based software system is to make and release standardized maps using multiple source data acquired or derived before and during the rover missions. It has three modules: (1) multi-source data integration, (2) data processing and analysis, and (3) cartographic product generation. The first module manages topographic maps (derived from orbital, descent and rover images), control point data, rover traverse data, path planning data, etc., and integrates them into the same spatial reference frame and coordinate system through data conversion, transformation, and editing. To meet the needs of rover teleoperation decision-making, the second module consists of a set of tools to derive specific maps or data, including slope, aspect, elevation profile, contour, 3D perspective view, line of sight for communication, skyline, illumination condition, projection of a camera’s FOV on the surface, and so on. The third module provides specially designed map templates, map symbol database, and annotations for rover teleoperation, and produces standardized high-quality maps that can be used and released electronically or printed out on large format printers.
6. Conclusions
A series of geospatial technologies, i.e. photogrammetric mapping, visual positioning, and GIS, were developed and used in CE-3 and CE-4 lunar rover missions. The technologies greatly contributed to landing site mapping and characterization, lander and rover localization, hazard detection, and rover path planning during mission operations. In summary, the geospatial technologies are indispensable and critical in support of engineering operations and scientific investigations of the missions.
Future lunar and Mars rover missions may require landing in more challenging terrain, traversing longer distance within one navigation unit, acquiring more scientific data with a certain level of autonomy, etc. To meet such new requirements, the relevant geospatial technologies need to be expended and new technologies need to be developed not only to improve accuracy, robustness, and on-board real-time processing capability but also to increase the intelligence of the rover.
Acknowledgments
The authors gratefully acknowledge the Beijing Aerospace Control Center for the support and close collaboration during Chang’e-3 and Chang-4ʹe mission operations. We thank China National Space Administration for providing Chang’e-3 and Chang’e-4 data, and the Lunar and Deep Space Exploration Science Applications Center of the National Astronomical Observatories for providing the Chang’e-2 DOM and DEM. We also thank those who worked on the Planetary Data System archive to make the LROC images and SLDEM2015 available, and Arizona State University for making the LROC WAC mosaic available.
Disclosure statement
No potential conflict of interest was reported by the authors.
Additional information
Funding
Notes on contributors
Kaichang Di
Kaichang Di is a professor at Institute of Remote Sensing and Digital Earth (RADI), Chinese Academy of Sciences. His research interests include planetary photogrammetry and remote sensing, visual localization and navigation, and planetary science. He is currently the chair of Inter-Commission Working Group III/II “Planetary Remote Sensing and Mapping” of International Society for Photogrammetry and Remote Sensing.
Zhaoqin Liu
Zhaoqin Liu is an associate professor at RADI. His research interests include planetary mapping, and planetary GIS.
Wenhui Wan
Wenhui Wan is an assistant professor at RADI. His research interests include visual localization and robot navigation,
Man Peng
Man Peng is an associate professor at RADI. Her research interests include planetary photogrammetry, and topographic analysis.
Bin Liu
Bin Liu is an associate professor at RADI. His research interests include geometric modeling orbital imagery, and high-precision topographic mapping.
Yexin Wang
Yexin Wang is an associate professor at RADI. Her research interests include planetary mapping and target recognition.
Sheng Gou
Sheng Gou is an assistant professor at RADI. His research interests include planetary mineral retrieval using hyperspectral data, and planetary geology.
Zongyu Yue
Zongyu Yue is a professor at RADI. His research interests include planetary remote sensing and planetary science.
References
- Barker, M. K., E. Mazarico, G. A. Neumann, M. T. Zuber, J. Haruyama, D. E. Smith. 2016. “A New Lunar Digital Elevation Model from the Lunar Orbiter Laser Altimeter and SELENE Terrain Camera”. Icarus 273: 346–355. doi:10.1016/j.icarus.2015.07.039.
- China Daily, 2019. “China’s Lunar Rover Travels over 345 Meters on Moon’s Far Side.” 4 December 2019. http://www.chinadaily.com.cn/a/201912/04/WS5de77085a310cf3e3557bfc4.html
- CLEP (China’s Lunar and Deep Space Exploration), 2019. “The Chang’e-4 Lander and Rover Woke up and Entered the Twelfth Lunar Day.” 22 November 2019. http://www.clep.org.cn/n5982341/c6808267/content.html
- Di, K., M. Jia, X. Xin, B. Liu, Z. Liu, M. Peng, Z. Yue, et al. 2018. “High Resolution Seamless DOM Generation over Chang’e-5 Landing Area Using LROC NAC Images”. International Archives of the Photogrammetry, Remote Sensing & Spatial Information Sciences XLII-3: 271–276. doi:10.5194/isprs-archives-XLII-3-271-2018.
- Di, K., M. Jia, X. Xin, J. Wang, B. Liu, J. Li, J. Xie et al. 2019d. “High-resolution Large-area Digital Orthophoto Map Generation Using LROC NAC Images.” Photogrammetric Engineering and Remote Sensing 85 (7): 481–491. DOI:10.14358/PERS.85.7.481.
- Di, K., Y. Liu, B. Liu, M. Peng, W. Hu. 2014. “A Self-calibration Bundle Adjustment Method for Photogrammetric Processing of Chang’E-2 Stereo Lunar Imagery.” IEEE Transactions on Geoscience and Remote Sensing 52 (9): 5432–5442. DOI:10.1109/TGRS.2013.2288932.
- Di, K., Z. Liu, B. Liu. 2019a. “Chang’e-4 Lander Localization Based on Multi-source Data.” Journal of Remote Sensing 23 (1): 177–184.
- Di, K., Z. Liu, B. Liu. 2019c. “Topographic Analysis of Chang’e-4 Landing Site Using Orbital, Descent and Ground Data.” ISPRS Geospatial Week 2019 – GSW2019.” International workshop on Planetary Remote Sensing and Mapping, June 10-14, 1383–1387. The Netherlands: Enschede, .
- Di, K., B. Xu, M. Peng, Z. Yue, Z. Liu, W. Wan, L. Li, and J. Zhou. 2016. “Rock Size-frequency Distribution Analysis at the Chang’e-3 Landing Site.” Planetary and Space Science 120: 103–112. doi:10.1016/j.pss.2015.11.012.
- Di, K., M.-H. Zhu, Z. Yue, Y. Lin, W. Wan, Z. Liu, S. Gou, et al. 2019b. “Topographic Evolution of Von Kármán Crater Revealed by the Lunar Rover Yutu-2”. Geophysical Research Letters 46: 12764–12770. doi:10.1029/2019GL085252.
- Golombek, M., R. Anderson, J. Barnes, J. F. Bell, N. T. Bridges, D. T. Britt, J. Brückner et al. 1999. “Overview of the Mars Pathfinder Mission: Launch through Landing, Surface Operations, Data Sets, and Science Results.” Journal of Geophysical Research: Planets 104 (E4): 8523–8553. DOI:10.1029/98JE02554.
- Gou, S., K. Di, Z. Yue, Z. Liu, Z. He, R. Xu, H. Lin, et al. 2019. “Lunar Deep Materials Observed by Chang’e-4 Rover”. Earth and Planetary Science Letters 528: 115829. doi:10.1016/j.epsl.2019.115829.
- Grotzinger, J. P., J. Crisp, A. R. Vasavada, R. C. Anderson, C. J. Baker, R. Barry, D. F. Blake, et al. 2012. “Mars Science Laboratory Mission and Science Investigation”. Space Science Review 170: 5–56. doi:10.1007/s11214-012-9892-2.
- Huang, J., Z. Xiao, J. Flajault. 2018. “Geological Characteristics of Von Kármán Crater, Northwestern South Pole-Aitken Basin: Chang’E-4 Landing Site Region.” Journal of Geophysical Research: Planets 123:1684–1700.
- Jia, Y., Y. Zou, J. Ping, C. Xue, J. Yan, Y. Ning. 2018. “The Scientific Objectives and Payloads of Chang’E-4 Mission”. Planetary and Space Science 162: 207–215. doi:10.1016/j.pss.2018.02.011.
- Li, C., D. Liu, B. Liu, X. Ren, J. Liu, Z. He, W. Zuo, et al. 2019. “Chang’e-4 Initial Spectroscopic Identification of Lunar Far-side Mantle-derived Materials”. Nature 569: 378–382. doi:10.1038/s41586-019-1189-0.
- Li, C., J. Liu, X. Ren. 2018. “Lunar Global High-precision Terrain Reconstruction Based on Chang’e-2 Stereo Images.” Geomatics and Information Science of Wuhan University 43 (4): 485–489. ( in Chinese with English abstract).
- Li, R., S. W. Squyres, R. E. Arvidson, B. A. Archinal, J. Bell, Y. Cheng, L. Crumpler et al. 2005. “Initial Results of Rover Localization and Topographic Mapping for the 2003 Mars Exploration Rover Mission.” Photogrammetric Engineering and Remote Sensing: Special Issue on Mapping Mars 71 (10): 1129–1142. DOI:10.14358/PERS.71.10.1129.
- Liu, B., M. Jia, K. Di, J. Oberst, B. Xu, W. Wan. 2018. “Geopositioning Precision Analysis of Multiple Image Triangulation Using LROC NAC Lunar Images”. Planetary and Space Science 162: 20–30. doi:10.1016/j.pss.2017.07.016.
- Liu, B., B. Xu, Z. Liu. 2014. “Descending Ad Landing Trajectory Recovery of Chang’e-3 Lander Using Descent Images.” Journal of Remote Sensing 18 (5): 988–994. ( in Chinese with English abstract).
- Liu, J., X. Ren, W. Yan, C. Li, H. Zhang, Y. Jia, X. Zeng. 2019. “Descent Trajectory Reconstruction and Landing Site Positioning of Chang’E-4 on the Lunar Farside”. Nature Communications 10: 4229. doi:10.1038/s41467-019-12278-3.
- Liu, Z., K. Di, J. Li. 2019. “Landing Site Topographic Mapping and Rover Localization for Chang’e-4 Mission.” Science China - Information Sciences 63. Accepted.
- Liu, Z., K. Di, M. Peng. 2015. “High Precision Landing Site Mapping and Rover Localization for Chang’e-3 Mission.” Science China-physics Mechanics & Astronomy 58 (1): 1–11.
- Peng, M., W. Wan, K. Wu. 2014. “Topographic Mapping Capability Analysis of Chang’e-3 Navcam Stereo Images and Three-dimensional Terrain Reconstruction for Mission Operations.” Journal of Remote Sensing 18 (5): 995–1002. ( in Chinese with English abstract).
- Ren, X., J. Liu, C. Li, H. Li, W. Yan, F. Wang, W. Wang et al. 2019. “A Global Adjustment Method for Photogrammetric Processing of Chang’E-2 Stereo Images.” IEEE Transactions on Geoscience and Remote Sensing 57 (9): 6832–6843. DOI:10.1109/TGRS.36.
- Robinson, M. S., S. M. Brylow, M. Tschimmel, D. Humm, S. J. Lawrence, P. C. Thomas, B. W. Denevi, et al. 2010. “Lunar Reconnaissance Orbiter Camera (LROC) Instrument Overview”. Space Science Reviews 150: 81–124. doi:10.1007/s11214-010-9634-2.
- Wagner, R. V., E. J. Speyerer, M. S. Robinson, and L. R. O. C. Team. 2015. “New Mosaicked Data Products from the LROC Team.” Proceedings of 46th Lunar and Planetary Science Conference, March 16-20 2015, 1473. The Woodlands, Texas.
- Wan, W., Z. Liu, K. Di, B. Wang, J. Zhou. 2014. “A Cross-Site Visual Localization Method for Yutu Rover”. Int. Arch. Photogramm. Remote Sens. Spatial Inf. Sci. XL-4: 279–284. doi:10.5194/isprsarchives-XL-4-279-2014.
- Wan, W., Z. Liu, B. Liu. 2019. “Descent Trajectory Recovery of Chang’e-4 Lander Based on Descent Images.” ISPRS Geospatial Week 2019 – GSW2019, “International workshop on Planetary Remote Sensing and Mapping, June 10-14, 1457–1461. The Netherlands: Enschede..
- Wu, B., H. Hu, and J. Guo. 2014. “Integration of Chang’E-2 Imagery and LRO Laser Altimeter Data with a Combined Block Adjustment for Precision Lunar Topographic Modelling.” Earth and Planetary Science Letters 391: 1–15. doi:10.1016/j.epsl.2014.01.023.
- Wu, W., C. Li, W. Zuo. 2019. “Lunar Farside to Be Explored by Chang’e‐4.” Nature Geoscience 12 (4): 222–223. DOI:10.1038/s41561-019-0341-7.
- Xiao, L., P. Zhu, G. Fang, Z. Xiao, Y. Zou, J. Zhao, N. Zhao et al. 2015. “A Young Multilayered Terrane of the Northern Mare Imbrium Revealed by Chang’E-3 Mission.” Science 347 (6227): 1226–1229. DOI:10.1126/science.1259866.
- Yu, T., J. Fei, L. Li. 2019. “Study on Path Planning Method of Lunar Rover.” Journal of Deep Space Exploration 6 (4): 384–390. ( in Chinese with English abstract).
- Zakrajsek, J., D. Mckissock, J. Woytach. 2005. “Exploration Rover Concepts and Development Challenges.” First Space Exploration Conference: Continuing the Voyage of Discovery, 1–23. Orlando: AIAA 2005.
- Zhao, Y., F. Li, B. Wu. 2019. “Precise Landing Site Selection and Evaluation System Design for Chang’e-4 Probe.” Spacecraft Engineering 28 (4): 22–30. ( in Chinese with English abstract).
- Zuo, W., C. Li, and Z. Zhang. 2014. “Scientific Data and Their Release of Chang’E-1 and Chang’E-2.” Chinese Journal of Geochemistry 33: 24–44. doi:10.1007/s11631-014-0657-3.