
ABSTRACT
As a well-known urban landscape concept to describe urban space quality, urban street vitality is a subjective human perception of the urban environment but difficult to evaluate directly from the physical space. The study utilized a modern machine learning computer vision algorithm in the urban build environment to simulate the process, which starts with the visual perception of the urban street landscape and ends with the human reaction to street vitality. By analyzing the optimized trained model, we tried to identify urban street vitality’s visual features and evaluate their importance. A region around the Mochou Lake in Nanjing, China, was set as our study area. Seven investigators surveyed the area, recorded their evaluation score on each site’s vitality level with a corresponding picture taken on site. A total of 370 pictures and recorded score pairs from 231 valid survey sites were used to train a convolutional neural network. After optimization, a deep neural network model with 43 layers, including 11 convolutional ones, was created. Heat maps were then used to identify the features which lead to high vitality score outputs. The spatial distributions of different types of feature entities were also analyzed to help identify the spatial effects. The study found that visual features, including human, construction site, shop front, and roadside/walking pavement, are vital ones that correspond to the vitality of the urban street. The consistency of these critical features with traditional urban vitality features indicates the model had learned useful knowledge from the training process. Applying the trained model in urban planning practices can help to improve the city environment for better attraction of residents’ activities and communications.
1. Introduction
Urban public space is the key area for a resident to live its public urban life and is highly related to urban sustainable development (Kim and An Citation2017; Yang et al. Citation2019). Vitality in urban public space refers to a safer, more desirable, and more attractive space that has the capacity to offer more choices for social activities and be a place for cultural exchanges. This kind of space is the successful result of the process of place-making for people (Jalaladdini and Oktay Citation2012). The key criterion for an urban space to be considered as vital is being lively as people stop and stay for the space desirability, not because of compulsion (Molavi and Jalili Citation2016). As one of the largest urban public spaces, streets bear a profound social and humanistic connotation (Montgomery Citation1998). In the context of urban geography and urban planning, street vitality is broadly categorized as the continuing force of urban streets (Lynch Citation1960), the diversity of urban life (Jacobs Citation1961), or the activity of the people in streets (Gehl Citation2011; Gao et al. Citation2019). It is a vital issue in understanding urban public space and providing a sustainable human-based public environment. Typically, a study on street vitality could be done by analyzing the human’s perception, also known as the image of the city, using several experience-based predefined spatial entity concepts such as the Path, Edges, Districts, Nodes, and Landmarks described by Lynch (Citation1960).
After 40 years of rapid urbanization, Chinese urban construction has started to pay attention to the urban space’s quality in a more humanized way. As being considered our dominant sense by many people (Hutmacher Citation2019), vision is vital to sense the space and play a key role in our activities in the urban spaces (Cafuta Citation2015). However, most studies on street vitality were based on spatial factor assessments such as transportation condition (Fitch, Rhemtulla, and Handy Citation2019; Ikioda Citation2016; Galanis, Botzoris, and Eliou Citation2017; Aslam, Cheng, and Cheshire Citation2019) as well as other physical factors of the built environment (e.g., Peiravian, Derrible, and Ijaz Citation2014; Wang et al. Citation2018; Ewing and Clemente Citation2013). In contrast, probably due to technological limitations and practical reasons, studies on street vitality’s visual features were still few.
The recent development in machine learning gives us a powerful tool to solve visual problems. A convolutional neural network (CNN or ConvNet) (LeCun et al. Citation1998; Yu et al. Citation2018) can be used on image data to identify its patterns and features and take the classification or regression operations on images (Krizhevsky, Sutskever, and Hinton Citation2012). Recent progress has shown an above-human performance on general image classification works with newly developed networks since late 2015 (He et al. Citation2015). Studies were conducted on a lot of pattern recognition on various types of images using CNNs with promising results (Alom et al. Citation2018).
To directly identify the visual features for urban street vitality from street view, the study utilized a CNN model to mimic an urban scene’s human perception. The study assumed that a CNN model would perceive urban street vitality in a similar way as we humans do if it could learn to give similar scores to human evaluations. Thus, by analyzing the CNN model itself, which is actually a deterministic mathematic function, we may better understand how humans feel, especially what visual features make us feel a place is vital. Therefore, the study aims to achieve the following objectives:
Propose a technological approach to evaluate street vitality of an urban street scene by inputting a picture of the scene into a machine or computer program.
Train a working CNN to be the key to the above process at an acceptable accuracy.
Propose a method to identify vital visual features by using the trained model on-scene images.
Provide insights for key visual features by a case study in the study area and propose the results’ applications.
2. Methodology
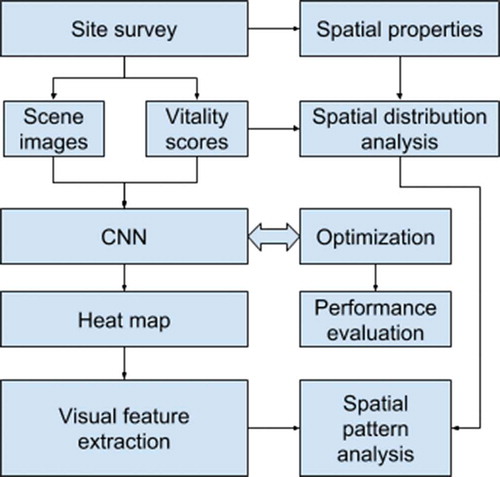
This paper draws on the preliminary findings of a case study that involves fieldwork and computer modeling. shows the complete study workflow, including data collection, modeling, and visual feature extraction. First, on-site surveys, the research data was collected, then a convolutional neural network as a visual evaluation model was trained to mimic the human investigators’ feelings on vitality. After that, we used the heat map to identify the most relevant pixel blocks, and finally, we tried to identify the key visual features.
Figure 1. Study workflow
2.1. Study area and survey sites selection
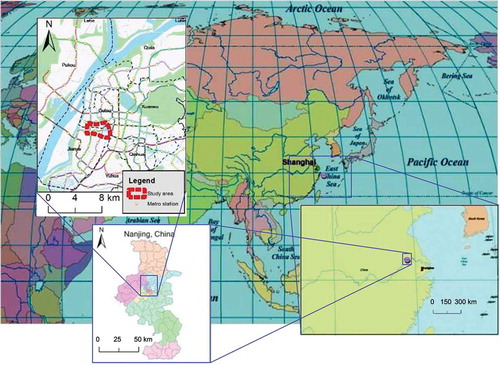
We selected a part of Gulou District, Nanjing, China, as our study area (see ). This area is in the middle of the Hexi region in Nanjing. It was the first developed part of the Hexi region since the 1980s. The area contains Mochou Lake, a local view spot, the Memorial Hall of the Victims in Nanjing Massacre by Japanese Invaders, a national famous memorial museum, the Wanda Plaza, a business and retail center, and many old and new residential spaces built between the 1980s and 2010s. Its landscape is a diversified and fully developed urban area, making it a fair sample for our study on urban street vitality’s visual features.
Figure 2. Study area
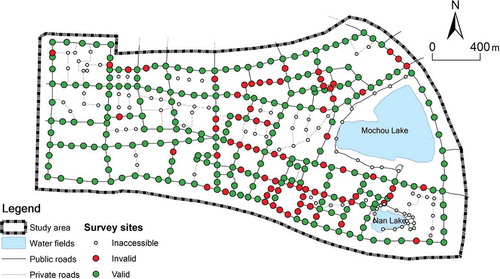
Before the surveys were conducted, 402 sites were pre-selected at indoor work on a street map. Sites were located at street intersections and inserted in between to keep neighboring sites’ distance to less than 100 meters. The number was then reduced to 304 by excluding the 98 sites on private roads not accessible to the general public and the ones around Mochou Lake that were under maintenance at the time of the survey ().
Figure 3. Survey sites
2.2. Site survey
First, seven investigators were briefly trained to know what to do. They were mainly asked to locate pre-selected sites in the study area and visit them one by one and record their feeling of each site’s vitality as a score into a table. Additionally, they were requested to give the separate scores to the natural environment’s quality, human activity, business activity, building environment, and open space for the surveyed site.
Second, surveys were arranged to be on clear weekends, between 10 am to 3 pm, to avoid as much inconsistency as possible in partial results. Each investigator was asked to finish all the sites if possible (but for various reasons, all of them failed to do so) and may revisit a site in another day after a whole sweep. Investigators can work solo or in groups. A panorama of the site and a corresponding score should be taken and recorded by each visit. If multiple investigators had visited a site together, they should make agreements for a single score to record, otherwise the data pair would be considered invalid. In this situation, the site would become invalid if that was its only visit during the survey. However, if a site had been visited at a different time, it would be allowed to have multiple evaluation scores along with their corresponding pictures resulting in multiple data pairs on one site.
The site surveys were done between 15 December 2018 and 15 January 2019. Over 800 pairs of site scores and corresponding pictures were collected. Due to the failure of agreements and other causes, including insufficient picture quality, wrong aspect ratio or simply missing out, the number of valid sites was reduced to 231. With some multi-visited sites, a total number of 370 data pairs were used as our study dataset.
2.3. Convolutional neural network
A convolutional neural network was built using the PythonTM programming language version 3.7 from the Python Software Foundation on its website https://www.python.org/and the software package Keras (Chollet Citation2015) with TensorflowTM (Abadi et al. Citation2016) backend. To feed the image data pictured by multiple devices into the neural network, we made a crop of each image and resized it into a unified size of 448 × 1792. As a conventional practice to improve the efficiency of the learning process, the vitality scores were fitted into a standard scaler of scikit-learn (Pedregosa et al. Citation2011) and re-scaled to a range of – 2.99 to 1.67 from its original domain, which was 0 to 4 before fed into the network as label values.
The network consists of 11 convolutional layers in five blocks, most of which were fairly conventional. A max-pooling layer was used to generalize visual features in each of the first four blocks layers. We used average pooling after the last 1 × 1 convolution layer with an output shape of 4 × 21 to obtain a quantized numeric result as a vitality score at the end of the network. After some trials and optimization of the hyperparameters, we obtained a working network with layers, as shown in .
Table 1. Table of the CNN layers
2.4. Heat maps for visual feature identification
A heat map (Zeiler and Fergus Citation2014) shows the discriminative image regions used by a CNN to identify a specific class in the image in case of classification, or the contribution of each image region to the final score value in case of regression. Our study aimed at identifying visual features for vitality. Heat maps were used to extract heat regions of images at certain levels (layers). By studying its histogram, we can identify the key features of urban street vitality.
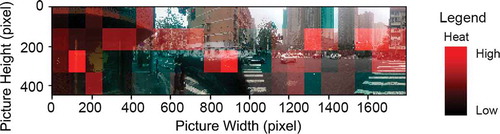
We use the tensor output of layer 41, which is right before the final average pooling layer, to identify the heated regions. As the previous layer’s output shape is 4 × 21, this can give us the heat of each 84 regions on an input image (). Each region is of the size of approximately 100 × 100 pixels. Pixel blocks give the most contribution, above a certain threshold, to the vitality score were extracted ().
Figure 4. Output of layer 41 of the CNN as a heat map
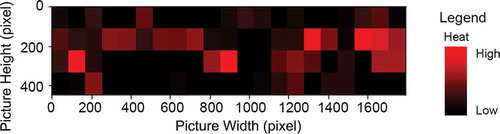
Figure 5. Scene image with heat map overlaid
Finally, the extracted pixel blocks were classified into 12 classes manually. Per-feature average and class total heats were calculated and summarized in . A higher per-feature average suggests a possibly more crucial feature, while a higher total heat suggests the class to be dominant in the scenes.
Table 2. Classification statistics for the top 3.5% features
3. Results
3.1. Spatial distribution of street vitality
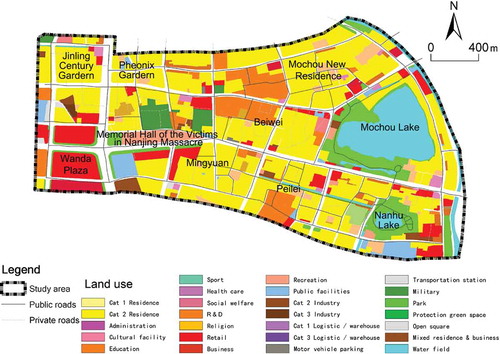
shows the human perceptions of vitality at our surveyed sites by the investigators. Comparing with the land-use status () of the study area, higher vitality sites concentrated around relatively new matured areas. There is a high score kernel in the middle south of the study area around Peilei Street, which developed between the 1990s and 2000s. However, the Mochou New Residence region in the northeast of the study area, one of the first-developed parts in the late 1980s, does not have very high scores. It is possibly due to the lack of well-built public spaces in the old-fashioned designed resident spaces. Streets around the newly built business and retail area at the southwest corner (around Wanda Plaza) also do not have high vitality. It is possibly due to the large scale of road systems for motor traffic where the pedestrian spaces are limited rather than enlarged.
Figure 6. Surveyed street vitality scores
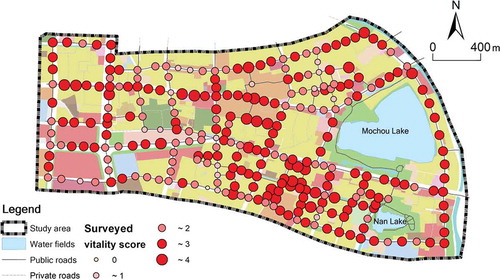
Figure 7. Land use of the study area
3.2. Performance of CNN
The CNN we used in this study was generally conventional, as shown in . The network utilized five convolution blocks, each containing two convolution layers with their own normalization and activation layers. Despite the last block, each block uses a max-pooling layer and a dropout layer along with the reduced resolution by pooling, the kernel increases by two times between each block. Average-pooling was used to summarize the regional information into a unified single number score of vitality in the last block. We used ADAM optimizer and MSE (mean squared error) as optimizer and loss function for the training.
3.2.1. Training
In a total of 370 data pairs, 30% were kept for the test set while the horizontal flipping was used on the remaining pairs for data augmentation, resulting in 518 training samples and 111 test ones for the model training. With a batch size of 4, in the first 100 epochs in the training process, the test set’s loss dropped to 0.55 along with the loss for the training set ().
Figure 8. Training history of the epochs 2–100
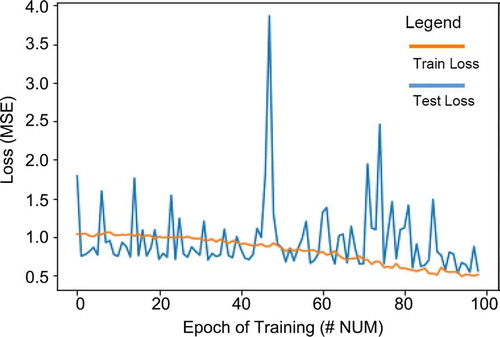
After training for another 250 epochs, we reached a minimum loss of 0.18 on the test set while the training set loss was at 0.07. Here, we used early-stop to obtain the optimal model and used it for the following study.
3.2.2. Distribution of model error
Since the vitality score represents the ordinal levels, if we consider the vitality score as categorical data of 5 classes, we can use a confusion matrix () to show the detailed distribution between ground truth and model predicted scores. The corresponding model accuracy on the full dataset was 94.9% and 87.4% for the test set. Kappa coefficient (Cohen Citation1960) showed a value of 0.919 on the full set, suggesting that the model has a good capability to make inferences.
Figure 9. Confusion matrix

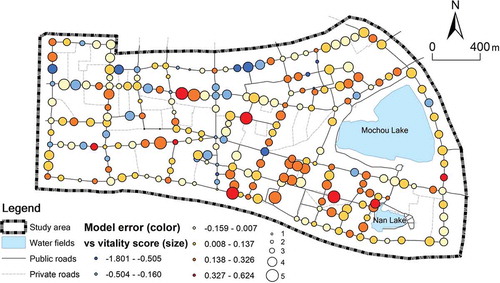
shows the model error in colors and the ground truth vitality score in dot sizes. Light yellow color indicates a relatively small error while dark blue and dark red indicate significant negative and positive errors, respectively. Generally, the larger errors are more common at places where the human sensed vitality is above the average level. In case that there were multiple scores for a particular site, they would be averaged before showing on the map as one colored circle.
Figure 10. Model error spatial distribution
3.3. Visual feature identification
With all pictures put through the CNN model, the 41st layer’s output can be used as a heat map for the corresponding input image. Each output block as described in Sect. 2.4 has a heat value, and the total distribution is shown in . A total of 84 values for the corresponding blocks were averaged at the following average-pooling layer to generate a single value output. A higher heat value indicates a more positive effect of the block has on the vitality of the scene.
Figure 11. Block heat value (output of layer 41) distribution
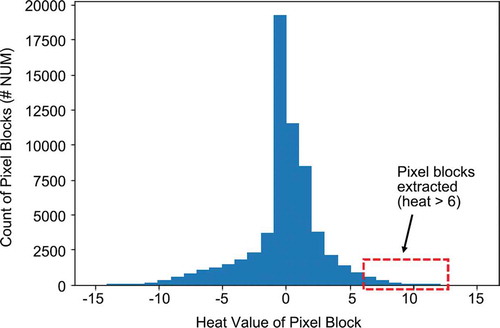
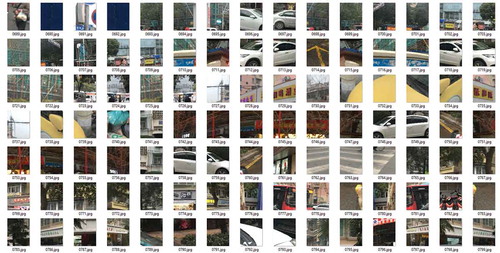
We extracted the blocks with the highest heat values to analyze urban street vitality’s positive visual features. With the threshold of 6, a total of 2289 blocks, about 3.5% of all, was extracted () and categorized into 12 classes.
Figure 12. Extracted high heat feature blocks (sample)
As shown in , the most heated types were vehicles, trees, buildings, and roadside/walking pavement. However, the most relevant features are humans, construction sites, shopfronts, and roadside/walking pavement, indicating pedestrian space, from the per-feature contribution perspective.
3.4. Spatial pattern of primary street vitality visual features
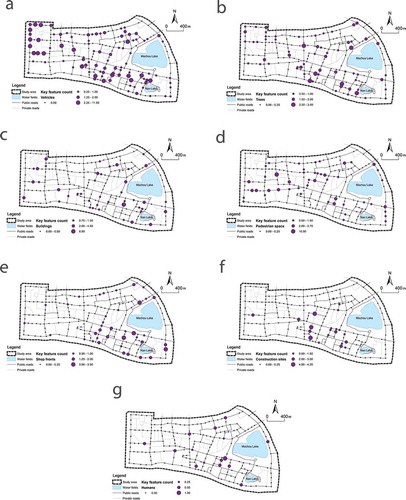
Comparing the spatial distribution of the primary features () to the land-use status (), we found that the features such as vehicles ()), buildings ()), and pedestrian space (roadside/walking pavement, )) are distributed relatively evenly in the study area. However, features such as shop fronts ()) and construction sites ()) and even trees ()) are better recognized in maturely developed urban areas, mostly in the east part of the study area.
Figure 13. Spatial distributions of vital visual features including vehicles (a), trees (b), buildings (c), pedestrian spaces (d), shop fronts (e), construction sites (f), and humans (g)
4. Conclusions and discussion
The study shows a CNN can be trained on human perception vitality evaluation labels and street view images to recognize the features in a street view picture to evaluate the scene’s vitality. Furthermore, the trained neural network model can be analyzed to generate a heat map on a specific input image to identify the network’s area of interest. Extracting the visual features in the heated areas can help urban researchers understand vital physical features for urban street vitality.
The results verified that the CNN model had found visual features very similar to what we humans may concern, such as pedestrian space, motor traffic, retail, and other humans(Jones, Marshall, and Boujenko Citation2008). It suggested the network had learned to work in more or less the similar way we do in urban space perception. By studying the trained neural network model for various urban environment perception properties, we may better understand the human perceptions process in urban environments.
The results show that if we want more eyes and feet in an urban area, we need more well designed and decorated pedestrian space, shop fronts for retail service space, some vehicles around, some featuring buildings as well as some green view to improve peoples’ feeling on vitality. Sometimes even construction sites can help attract people by showing the place is actively maintained. The results, including identified vital features, can improve urban vitality in city planning, managing, operation, and renewal.
However, this study is still in a preliminary stage. The study area is relatively small (also the available dataset), and the data pre-processing is also relatively simple. The study used a CNN for regression, which is different from the vanilla CNN working for classification. More optimizations can be conducted to the network to achieve a better performance, which may affect the features and their importance. Further study may utilize a more advanced CNN such as a Regional CNN (R-CNN) (Girshick et al. Citation2014) to classify in the first part and use another network to make the regression for human perception simulation.
The score labels used in model training are based on a group of the seven investigators’ vitality ratings. In this way, the model was trained to mimic the seven investigators’ perceptions of vitality, not the general public’s. Possible next steps can be taken on comparing with results from diversified raters to identify and evaluate both the similarity and differences for explaining possible biases.
In the present study, the heat block threshold is set as a specific value of 6 to balance the workload and representative of the result. Of course, by introducing another CNN in the feature extraction process, more thresholds can be evaluated sufficiently to check whether there are any differences or trends along with the thresholds.
The spatial distribution maps suggest spatial auto-correlation on vitality levels and model errors () by clustering of sizes and colors of circles. Further research will focus on the possible spatial attenuation mechanism on the street vitality.
Supplemental Material
Download MS Word (103.9 KB)Acknowledgments
We would like to thank Shao-meng Wei, Jin Xiang, Jie-qi Yin, Wei Zhang, Pu Zhao, and Jun-wei Zhu of Nanjing University for their help in the site-survey and data processing. We would also like to thank all the anonymous reviewers and the editors whose professional comments have greatly improved this paper.
Disclosure statement
No potential conflict of interest was reported by the author(s).
Data availability statement
The data that support the findings of this study are available on request from the corresponding author at http://public.dupetrc.qiyi.us:31382/model_simplednn/model_streetvitality. The data are not publicly available due to the uncensored faces and license plates in the street view images taken by our investigators and used in model training may violate individuals’ privacy.
Supplementary material
Supplemental data for this article can be accessed here.
Additional information
Funding
Notes on contributors
Yi Qi
Yi Qi is a lecturer at the School of Architecture and Urban Planning at Nanjing University, China. He was a visiting scholar at Lancaster Environment Centre at the time of this study. He holds a Ph.D. in Human Geography and had been working on geographic information modeling and analysis. He teaches several courses on the topic while developing tools, models, and applications to address practical urban planning problems, especially on geographic accessibility and spatial interaction problems. He currently dedicated his work to machine learning applications and neural networks in urban planning and geospatial studies.
Sonam Chodron Drolma
Sonam Chodron Drolma is a master candidate in urban planning and design at Nanjing University, China. She came from Tibet and had come through a difficult way to chase her interest in geographic information sciences while dealing with three different natural languages and a few different computer languages. She is currently working on researches using machine learning in urban build environment evaluation.
Xiang Zhang
Xiang Zhang holds a Ph.D. in human geography and was an assistant researcher in urban planning at Nanjing University, China at the time of this study. He dedicated his time mainly to practical urban designing activities and became a professional urban planner and an experienced researcher. He had done a lot in leading urban master planning projects, and he always tries to investigate possibilities in integrating quantitative analysis into the traditional workflow.
Jing Liang
Jing Liang holds a Master degree of Engineering in urban planning and design. She is a senior urban planning project manager at the Department of Planning and Landscape Design, Nanjing Branch, Huachengboyuan Engineering Technology Group. For many years, she cooperated with the research team at Nanjing University in various studies concerning computers in urban planning. She is recently dedicated to urban planning project management while evaluating the value of new technologies, including machine learning in traditional urban planning and landscape designing workflow.
Haibing Jiang
Haibing Jiang is an assistant professor at the School of Urban and Planning, Yancheng Teachers University. He is also holding a Ph.D. in Human Geography and has been working on accessibility analysis based on national scale transport studies over the last decade and had won awards for his published papers indicating the recognition of his work in the field. He has recently been working with the study team at Nanjing University on research using new methodologies such as deep learning.
Jiangang Xu
Jiangang Xu is a professor on human geography and urban planning in the School of Architecture and Urban Planning at Nanjing University, China. He had dedicated his decades of work on the application of computer and geographic information technology in urban planning. He is also well known as he had taught a series of visionary courses on GIS application in urban planning for both the bachelor and graduate students.
Tianhua Ni
Tianhua Ni is an associate professor at the School of Geography and Ocean Science, Nanjing University. He is mainly engaged in teaching and research in regional ecological carrying capacity and high-quality green development, regional environmental planning and management, and water pollution control in river basins. Recently, he is working on the application of artificial neural networks in environmental and ecological studies.
References
- Abadi, M., P. Barham, J. Chen, Z. Chen, A. Davis, J. Dean, M. Devin, et al. 2016. “Tensorflow: A System for Large-scale Machine Learning.” Proceedings of the 12th USENIX Symposium on Operating Systems Design and Implementation, 265–283. Berkeley: USENIX Association.
- Alom, M. Z., T. M. Taha, C. Yakopcic, S. Westberg, P. Sidike, M. S. Nasrin, B. C. Van Essen, et al. 2018. “The History Began from Alexnet: A Comprehensive Survey on Deep Learning Approaches.” arXiv preprint arXiv:1803.01164.
- Aslam, N.S., T. Cheng, and J. Cheshire. 2019. “A High-Precision Heuristic Model to Detect Home and Work Locations from Smart Card Data.” Geo-spatial Information Science 22 (1): 1–11. doi:10.1080/10095020.2018.1545884.
- Cafuta, M. R. 2015. “Open Space Evaluation Methodology and Three Dimensional Evaluation Model as a Base for Sustainable Development Tracking.” Sustainability 7 (10): 13690–13712. doi:10.3390/su71013690.
- Chollet, F., and others. 2015. “Keras.” https://keras.io
- Cohen, J. 1960. “A Coefficient of Agreement for Nominal Scales.” Educational and Psychological Measurement 20 (1): 37–46. doi:10.1177/001316446002000104.
- Ewing, R., and O. Clemente. 2013. Measuring Urban Design: Metrics for Livable Places. Washington, DC: Island Press.
- Fitch, D. T., M. Rhemtulla, and S. L. Handy. 2019. “The Relation of the Road Environment and Bicycling Attitudes to Usual Travel Mode to School in Teenagers.” Transportation Research Part A: Policy and Practice 123: 35–53. doi:10.1016/j.tra.2018.06.013.
- Galanis, A., G. Botzoris, and N. Eliou. 2017. “Pedestrian Road Safety in Relation to Urban Road Type and Traffic Flow.” Transportation Research Procedia 24: 220–227. doi:10.1016/j.trpro.2017.05.111.
- Gao, Y., J. Cheng, H. Meng, and Y. Liu. 2019. “Measuring Spatio-Temporal Autocorrelation in time Series Data of Collective Human Mobility.” Geo-Spatial Information Science 22 (3): 166–173. doi:10.1080/10095020.2019.1643609.
- Gehl, J. 2011. Life Between Buildings: Using Public Space. Washington, DC: Island Press.
- Girshick, R., J. Donahue, T. Darrell, and J. Malik. 2014. “Rich Feature Hierarchies for Accurate Object Detection and Semantic Segmentation.” Proceedings of the IEEE Conference on Computer Vision and Pattern Recognition, 580–587. Columbus, OH: IEEE. doi: 10.1109/CVPR.2014.81.
- He, K., X. Zhang, S. Ren, and J. Sun. 2015. “Delving Deep into Rectifiers: Surpassing Human-level Performance on Imagenet Classification.” Proceedings of the IEEE International Conference on Computer Vision 1026–1034. doi:10.1109/ICCV.2015.123.
- Hutmacher, F. 2019. “Why is There So Much More Research on Vision than on Any Other Sensory Modality?” Frontiers in Psychology 10: 2246. doi:10.3389/fpsyg.2019.02246.
- Ikioda, F. 2016. “The Impact of Road Construction on Market and Street Trading in Lagos.” Journal of Transport Geography 55: 175–181. doi:10.1016/j.jtrangeo.2015.11.006.
- Jacobs, J. 1961. The Death and Life of Great American Cities. New York: Random House.
- Jalaladdini, S., and D. Oktay. 2012. “Urban Public Spaces and Vitality: A Socio-spatial Analysis in the Streets of Cypriot Towns.” Procedia-Social and Behavioral Sciences 35: 664–674. doi:10.1016/j.sbspro.2012.02.135.
- Jones, P., S. Marshall, and N. Boujenko. 2008. “Creating More People-friendly Urban Streets through ‘Link and Place’ Street Planning and Design.” IATSS Research 32 (1): 14–25. doi:10.1016/S0386-1112(14)60196-5.
- Kim, S., and K. An. 2017. “Exploring Psychological and Aesthetic Approaches of Bio-retention Facilities in the Urban Open Space.” Sustainability 9 (11): 2067. doi:10.3390/su9112067.
- Krizhevsky, A., I. Sutskever, and G. E. Hinton. 2012. “Imagenet Classification with Deep Convolutional Neural Networks.” In Advances in Neural Information Processing Systems, edited by F. Pereira, C. J. C. Burges, L. Bottou, and K. Q. Weinberger, 1097–1105, Lake Tahoe, USA: Curran Associates.
- LeCun, Y., L. Bottou, Y. Bengio, and P. Haffner. 1998. “Gradient-based Learning Applied to Document Recognition.” Proceedings of the IEEE 86 (11): 2278–2324. doi:10.1109/5.726791.
- Lynch, K. 1960. The Image of the City. Cambridge, MA: MIT Press.
- Molavi, M., and F. Jalili. 2016. “Comparison of Vitality between Two Streets of Tehran.” Urbanism. Arhitectura. Constructii 7 (4): 267.
- Montgomery, J. 1998. “Making a City: Urbanity, Vitality and Urban Design.” Journal of Urban Design 3 (1): 93–116. doi:10.1080/13574809808724418.
- Pedregosa, F., G. Varoquaux, A. Gramfort, V. Michel, B. Thirion, O. Grisel, M. Blondel, et al. 2011. “Scikit-learn: Machine Learning in Python.” Journal of Machine Learning Research 12:2825–2830.
- Peiravian, F., S. Derrible, and F. Ijaz. 2014. “Development and Application of the Pedestrian Environment Index (PEI).” Journal of Transport Geography 39: 73–84. doi:10.1016/j.jtrangeo.2014.06.020.
- Wang, X., J. Yao, S. Yu, C. Miao, W. Chen, and X. He. 2018. “Street Trees in a Chinese Forest City: Structure, Benefits and Costs.” Sustainability 10 (3): 674. doi:10.3390/su10030674.
- Yang, J., M. Tsou, K. Janowicz, K. C. Clarke, and P. Jankowski. 2019. “Reshaping the Urban Hierarchy: Patterns of Information Diffusion on Social Media.” Geo-Spatial Information Science 22 (3): 149–165. doi:10.1080/10095020.2019.1641970.
- Yu, H., J. Wang, Y. Bai, W. Yang, and G. Xia. 2018. “Analysis of Large-Scale UAV Images Using a Multi-Scale Hierarchical Representation.” Geo-Spatial Information Science 21 (1): 33–44. doi:10.1080/10095020.2017.1418263.
- Zeiler, M. D., and R. Fergus. 2014. “Visualizing and Understanding Convolutional Networks.” In Computer Vision – ECCV 2014. ECCV 2014. Lecture Notes in Computer Science 8689, edited by D. Fleet, T. Pajdla, B. Schiele, and T. Tuytelaars, 818–833. Cham: Springer. doi:10.1007/978-3-319-10590-1_53.