
ABSTRACT
Changes in technology are coming at an ever increasing pace. This holds for photogrammetry and remote sensing as well. “Everything moves” – this is why I chose this topic to shed some light on some of the recent developments. Naturally, this undertaking can never be complete in the sense of covering all developments in Photogrammetry and Remote Sensing.
Besides, the impact of Deep Learning in photogrammetry is not mentioned in this paper.
This is a very personal account. People may not agree with some of my findings, but this is in the nature of science. In any case, this contribution is meant as a tribute to Gottfried’s successful lifelong work. It is not a scientific paper in the traditional sense but rather a collection of thoughts that emerged over the 50 years of my professional career. It is also meant for an audience who has not necessarily a deep photogrammetric expert know-how.
Preliminary remarks
This is a modified version of a presentation which I gave on occasion of receiving a honorary doctorate degree (Dr.h.c.) from the School of Rural and Surveying Engineering of the Aristotle University of Thessaloniki on 21.9.2015. Working in photogrammetry for more than 50 years gave me some experience in various domains of our science and technology. I saw methods, hard- and softwares coming and going. But there were always people around who contributed significantly to every phase of the development. One of these outstanding personalities is Prof. Gottfried Konecny. He contributed equally well to science as such as to the management of science. With his always forward looking attitude and his tireless engagement he shaped a long period. In Gruen (Citation1998) I explained already my professional relationship to Prof. Konecny. While we never did any research projects together, we had lots of joint interests and meeting opportunities concerning the functioning of ISPRS.
It happens very often that, as people get older, they show increasing interest in the historical and philosophical foundations of their disciplines. This is definitely the case with Prof. Konecny (see his presentation at the 100 years celebration of ISPRS, Konecny Citation2010). Therefore I have dedicated a fairly large section to the issue of perspective projection, a mathematical foundation whose roots are usually wrongly described in textbooks of the Western World.
I stay away from a projection of Photogrammetry and Remote Sensing into the future. Here I take it with A. Einstein: ‘I never think about the future. It comes soon enough’. For those who are interested in more details I refer to Pfeifer (Citation2010).
I also do not touch the issue of machine learning, which is becoming currently an increasingly relevant topic in photogrammetry and remote sensing. In this respect I would like to refer to Qin and Gruen (Citation2020), which gives a comprehensive survey of this technology and its impact on photogrammetry.
1. Introduction
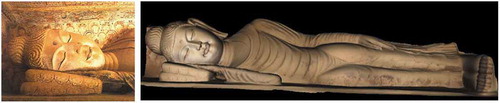
“Everything moves”. These were the last words of Buddha before he went into pari-nirwana (). Meaning: Everything is changeable. Buddha Shakyamuni (Siddhartha Gautama) (563–483 BC) comes from a totally different cultural/geographical background than another great philosopher: Aristotle (384–322 BC). Aristotle proclaimed the intellectual virtues: nous, sophia, and phronesis – Intelligence, Wisdom, Prudence (Practical Wisdom)). In an interesting article N. F. Gier (The Virtue of Nonviolence: from Gautama to Gandhi) compares the philosophies of Buddha and Aristotle and finds many similarities.
Figure 1. The inclining (“sleeping”) Buddha in Dunhuang, China, cave 158; digital image(left) and 3D model(right), generated photogrammetrically (courtesy Prof. Deren Li, Wuhan University)
When my co-student and friend Prof. Reiner Rummel received his honorary PhD award from The Aristotle University of Thessaloniki on 5 March 2014 he made some special reference to Aristotle and his work “Metaphysics”. He correctly emphasized that Aristotle introduced the term “Geodesy”, as opposed to “Geometry”, which was existing at this time already. It is interesting to note that Geodesy referred to the actual measurements, while Geometry encompassed the theory. This dual approach to a subject (from both theoretical and practical point of views) is very typical and fully in line with Aristotle’s other scientific and philosophical concepts. So for instance when it comes to the issue of “Reason” in Aristotle’s work he makes a clear distinction between theoretical and practical reason. This represents a decisive break with Plato, who equated theoretical knowledge and virtue. In stark contrast Aristotle observes that while young people gain theoretical wisdom by studying geometry and math, ‘they apparently do not attain phronesis. The reason is that practical wisdom is concerned with particulars as well (as with universals), and knowledge of particulars comes from experience’. So we have there already the two pillars of our science: Theory and Practice. Both have to be represented equally well in successful research and in curricula at learned institutions.
Such learned institution was the Department of Geodetic Science of the Ohio State University, where I spent in the early 1980s 3.5 very important years of my life. Despite the fact that the Department was dominated by Geodesists at this time, I felt very well there and remember a very productive and intellectually challenging period. Beside the many other Greek students there were also Emmanuel Baltsavias and Petros Patias. Manos followed me to Zurich, where he became a very valuable cooperator and Petros made his career here in Thessaloniki.
As a Geodesist, when you talk about your science, you can always refer to such Greats as Aristotle, Erathostenes, Gauss, Helmert and so forth. Even Einstein with his relativity theory may be called upon. We photogrammetrists cannot scoop from such a full bucket. Instead we have to spend much time to explain the difference between Photography and Photogrammetry. And here it is again. The term “Photogrammetry” comes from the Old Greek. Here “Photo … ” means „Light“, „ … gramme“ means „Line“ and “metry“ means „Mensuration“. Therefore Photogrammetry can be understood as “Measuring Lines with Light”. It is very essential here that it is not limited to photographs, nor to point measurements. This has some far-reaching consequences and opens photogrammetry a wide range of sensors, processing techniques and applications. Indeed we have come a long way from the second part of the 19th century, when photogrammetry was exclusively executed with specially constructed, big and heavy photographic cameras and data processing machines and was mainly used in mapping and architectural documentation. Nowadays, where sensors are available of many kinds and everywhere, not only the data processing has changed significantly, but, and even more importantly, new areas of applications with novel requirements are opening up continuously.
2. Changes toward digital photogrammetry
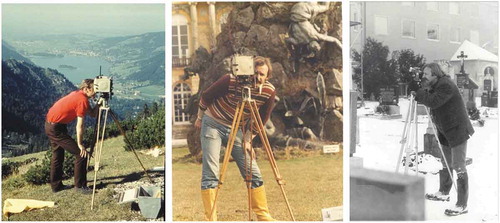
I can see the change when I look at my own professional life. As a student at TU Munich I still spent much time in a dark room doing stereo measurements on a Multiplex instrument. Or I spent many days outdoors either in the mountains or at Cultural Heritage places (which was nice!) with bulky equipment doing terrestrial photogrammetry (). Sometimes the work had to be done even in winter (which was not so nice).
Figure 2. Terrestrial photogrammetry with the TAF photographic glass-plate camera in the Bavarian mountains and at Castle Herrenchiemsee. Theodolite observations for photogrammetric control at the Monastery Au/Inn
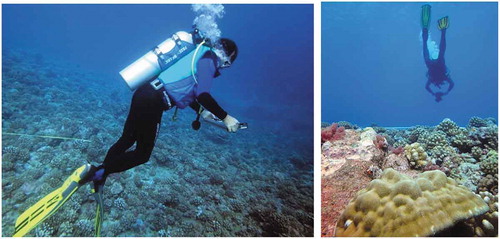
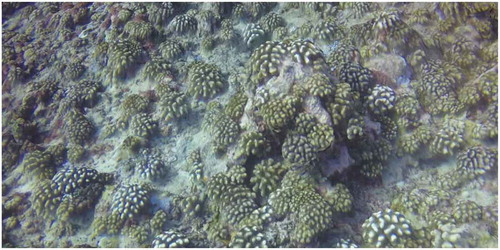
The applications were either topographic mapping or Cultural Heritage. Nowadays we collect data in automatic mode with little flying robots (UAVs), being equipped with off-the-shelf digital cameras (in the meantime also with laser scanners), GPS and IMU for navigation and with autopilot and stabilization platform (). Drones can even be applied underwater, in many novel applications. Here is a case where we still use a human platform to collect multi-image data of corals in order to monitor coral growth ().
Figure 3. Phantom-3 drone (used in archeological applications at Moorea Island, French Polynesia (left) and Oblique drone image over an archeological temple site (right)
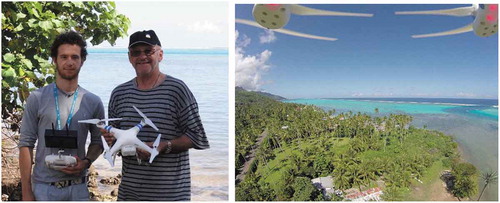
Figure 4. Collecting image data underwater with a stereo camera rig (left) and with a single camera (right) for the 3D measurement of coral growth
The data processing is done on a laptop, partly automatic and partly in the field already, or at least in a friendly office environment. shows a 3D model of a coral field, as a result of fully automated processing of underwater images.
Figure 5. 3D model of a coral field, generated fully automatically from underwater images
And if I look at our own projects, done with modern technology, then I see a very wide range of different applications (in parantheses other Sciences involved):
-Motion analysis systems for animation (Movie industry, Medicine, Sports)
-Human body measurement (Medicine)
-Measurement of Turbulent Flow (Hydromechanics)
-Industrial quality control (Mechanics, Manufacturing)
-Table Tennis robot (Mechatronics)
-Measurement of the reflectors of ESA´s Planck and Herschel spacecrafts (Space Science)
-Measurement of mixing liquids (Technical Chemistry)
-3D Cloud mapping (Climatology, Weather)
-Reconstruction of the Big Buddhas of Bamiyan (Cultural Heritage)
-3D modeling and analysis of 1500 Nasca geoglyphs (Archeology)
-Randa Rockslide (Geology)
-3D/4D city modeling (City Planning, etc.)
-3D modeling of Shukov towers (Architecture, Structural Engineering)
-Ecological modeling of tropical islands (“Moorea Avatar”) (Earth Sciences, Physics, Biology, Medicine, etc.)
Everything moves. Aristotle discusses motion (kinēsis) in his “Physics” quite differently from modern science. Aristotle’s definition of motion is closely connected to his actuality-potentiality distinction. Taken literally, Aristotle defines motion as the actuality (entelecheia) of a “potentiality as such”. What Aristotle meant however is the subject of several different interpretations.
Photogrammetry was from its very beginning related to motion. Motion at very different speeds and therefore very divers recording intervals. From the growth of corals (a few cm growth requires only one set of images per year) to the fast movement of human actors (250 Hz image recording frequency) or the flight of projectiles.
But also the discipline and its underlying technologies is changing. We look at the history of photogrammetry with the eyes of the economist N.D. Kondratjew, who in 1925 formulated his wave theory of development in economics. According to him economy develops in cycles, which consist of 30 years of growth-20 years of recession −30 years of growth. A period of growth is triggered by the invention of new technologies (“Need is the mother of invention”). Applied to photogrammetry we can distinguish up to now 4 phases of development: Plane Table Photogrammetry (triggered by the invention of photography), Analogue Photogrammetry (introduction by precision optics and mechanics and by airplanes), Analytical Photogrammetry (invention of computers), Digital Photogrammetry (microelectronics, semiconductors). Each of those major inventions led to a paradigm shift in photogrammetry. shows the major phases of photogrammetric development. What will be the next topic for growth? Internet, big data, cloud computing, social sensing? Predictions are always subject to misconceptions. I wish to refer to Prof. Gottfried Konecny´s Keynote Address at the 1985 ASP/ACSM Meeting “The ISPRS – 75 years old or 75 years young?” were he remarked on the topic of digital photogrammetry: “A technological boom in digital sensing and digital photogrammetry is to be expected, in which digital methods will most likely be applied in small scale thematic mapping, and in which classical photogrammetry will be applied in parallel for large scale mapping”. Of course it is easy to know things better after 30 years passed. In the year 1985, when digital photogrammetry was in its infant shoes, it was hard to make safe predictions.
Figure 6. Phases of photogrammetric development (Courtesy G. Konecny)
Every new technology has its forerunner technologies. In case of photogrammetry these were image processing algorithms (1964–1980), network aspects (systematic errors, blunders, precision and reliability structures, 1972–1980), online triangulation by sequential estimation (Kalman, TFU, Givens, 1980–1984), Charge coupled Devices (CCDs), framegrabbers, workstations (Tektronics, Sun), image processing systems with image acquisition devices (1980–1984) and Least Squares image and template matching algorithms (1984–1985).
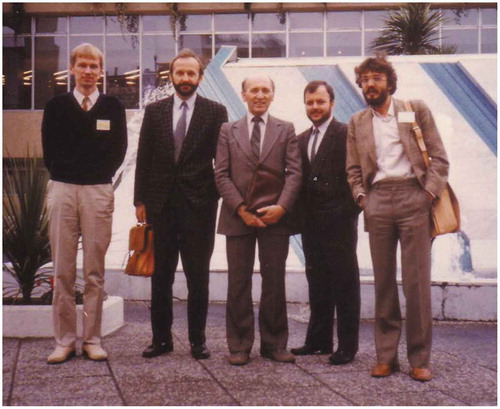
In the early 80s those of the photogrammetric community who were convinced of the value of digital techniques were still a small minority. shows the group of photogrammetrists who attended the SPIE Symposium on “Computer Vision for Robotics” in Cannes, 2–6 December 1985. The hope that we all had, that photogrammetry would contribute substantially to robotics, did unfortunately not materialize, at least not at those times.
Figure 7. Small group of photogrammetrists at the SPIE Symposium on “Computer Vision for Robotics”, Cannes, 2–6 December 1985. From left: H. Haggren, A. Gruen, V. Kratky, G. Vozikis, E. Baltsavias
One of the problems that kept people from working in the digital domain was the cost of equipment. For instance, we paid 1986 CHF 11,500 for a Canon camera with 0.2 Mpi plus recorder/player. Three years later (1989) we spent CHF 72,000 on a Kontron ProGres 3000 camera with 7.5 Mpi image size.
Progress was slow. At the ISPRS Congress in Vienna 1996 we counted 32 papers in Architectural Photogrammetry, among which 11 were using fully digital systems and 21 photographic or hybrid.
In Industrial Photogrammetry on the other hand there were 20 papers with fully digital approaches and only 3 using photographs or hybrid. This clearly shows the different requirement of the different communities. Industrial applications have a much stronger need for fast or even real-time processing. At those times we formulated requirements for a smart camera, a camera that could execute essential operations on-board (using a “seeing chip”). As such on-chip functions we defined: Lower noise, higher dynamic range, programmable sensitivity, non-uniformity and shading correction, variable exposure and timing control, region-of interest capability, dynamic pixel size and shape, on-chip image processing (in parallel). Even today most of these functions are not available on-chip.
While technological deficiencies played a role in the acceptance of this technology at those times, we are enjoying now a time, were key technologies have advanced to a degree that the limitations are not really of technological nature anymore, but mainly in the human brain.
3. The origin of perspective projection
When you reflect upon your science and technology you ask questions like: Where do I belong to in the wide spectrum between natural sciences and diverse technologies. I personally always understood my work as that of an engineer. While I see Geodesy more on the side of the Natural Sciences. There is a, maybe oversimplified, definition, which we use at our school to distinguish environmental scientists and environmental engineers. Similar to the work of medical doctors the environmental scientist is responsible for the diagnosis, while the engineer will do the therapy. So let me be the therapist.
A therapist of course also needs theories to draw from. Photogrammetry has various foundations.
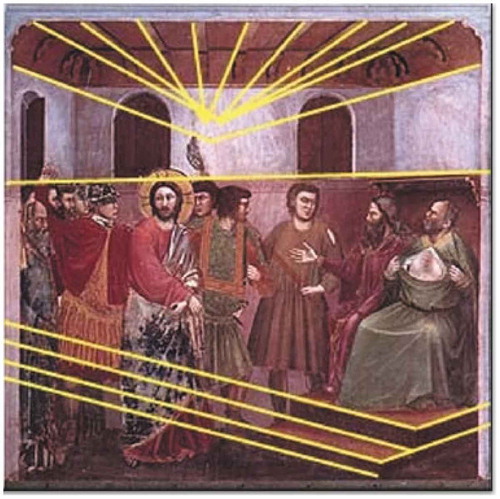
An important one is surely geometry. If we consult the (Western) textbooks we learn that the perspective projection was known to the Arabs of the 11th century in mathematical-optical terms (astronomer and mathematician Alhazen (965–1040) in his Perspectiva), but used for the first time in architecture and paintings by artists of the Italian renaissance. The first step in western art toward the use of perspective was Giotto di Bondone´s (1266–1337) painting Jesus before the Caif ().
Figure 8. Giotto di Bondone: Jesus before the Caif (courtesy Chr. W. Tyler)
The architect and sculptor Filippo Brunelleschi (1377–1446) became well-known for his use of perspective in his paintings and architectural studies. From then on the perspective became a common tool function for many artists and architects. The famous German painter Albrecht Dürer published in 1525 four books on geometry, whereby the perspective is treated in the fourth book (Underweysung der Messung, mit dem Zirckel und Richtscheyt, in Linien, Ebenen unnd gantzen corporen/Viertes Buch). shows famous woodcuts, published in this book and indicating how the perspective was used to produce drawings.
Figure 9. Woodcuts by Albrecht Dürer, 1525: Instruments for drawing perspectives
In fact the perspective was used in Europe much earlier. Plato and his contemporaries (5th century BC) were provoked by the dramatic use of perspective in the scenery for the plays of Aeschylus and Sophocles. One of these innovative scene painters, Agatharchus, introduced perspective and illusion into painting. He even wrote a commentary on his use of convergent perspective, whose effects had inspired several contemporary Greek geometers to analyze the projective transform mathematically. Non of those early perspective paintings have survived. However, we find in Pompeii (1st cent. AD) a mural () which shows the use of perspective, although the geometry is not very consistent. It is assumed that the knowledge of perspective has been handed down from the Greek Classic to the Romans, although the missing link has not been found yet.
Figure 10. Pompeiian mural of the pageant of Orestes, 1st century AD. Black lines: perspective projection, white lines: approximate parallel projection
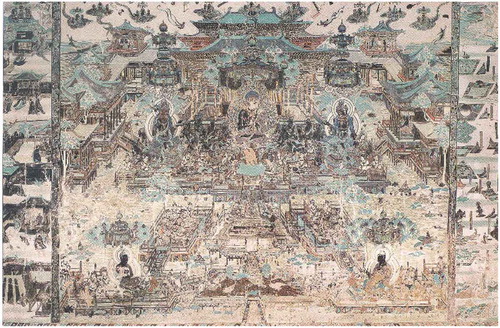
We find perspective scenes also already in Chinese frescos of the Tang Dynasty (8th century) – see . Interestingly, in this painting several perspectives were used at the same time. We do not know why.
Figure 11. Sukahavativyauhau Sutra, Mogao Grottos, Dunhuang, Cave 172. Tang Dynasty, 705–780 AD
As can be seen from Dürer´s woodcuts (), to produce a perspective image was very time-consuming at those times. And moreover, to reconstruct the 3D object from perspective images (a base function of photogrammetry) is even more demanding. Therefore, it took another 250 years before we find such a task done. It was the Swiss Doctor and Natural Scientist M. A. Capeller, who in 1726 produced the first map of the Pilatus region, derived from hand-drawn perspectives. This is nowadays considered the first photogrammetrically derived topographic map, although photography had not even been discovered yet.
The applications of photogrammetry in the late 19th century are already well described by E. Dolezal, Citation1896 (In “The Application of Photogrammetry to Practical Measurement Tasks”, in German) and later (International Archive of Photogrammetry, Vol. 1, No. 1, Vienna, March 1908) he notes “Die Anwendungen der Photogrammetrie sind vielseitig und wichtig. Der Ingenieur bei Terrainaufnahmen in schwer zugänglichem Gelände, der Topograph bei seinen Arbeiten im Hochgebirge, der Architekt bei der Aufnahme von Baudenkmälern, der Metereologe bei Wolkenaufnahmen und bei Fixierung sich rasch vollziehenden Erscheinungen, der Ballistiker zum Studium der Flugbahnen, der Marineur für die Küstenaufnahmen, der Militär und Aeronaut für Rekognoszierungszwecke, endlich der Forschungsreisende, der Geograph und Astronom, sie alle werden bei sinngemässer Anwendung der photographischen Messkunst bedeutenden Vorteil ziehen”. So we realize that photogrammetry was already then used in various non-topographic applications: Documentation of buildings, cloud measurements, ballistic curves of projectiles, coastal measurements, military and aeronautical tasks of reconnaissance, in geography and astronomy.
At this point we make a big jump and bridge one century. A century filled with wars, death and destruction, but also with great scientific discoveries and technical innovations.
4. The new photogrammetry
What is photogrammetry today? It has developed from 2D/3D point positioning and 2.5D mapping into an integrated unified n-D technology, encompassing satellite, aerial and terrestrial sensor platforms. It has moved from single sensor/multiple processing instruments to multiple sensors/single processing platform techniques.
The early 21st century sees photogrammetry within a totally new environment for research, development, teaching and professional practice:
We sense a new interest in the geosciences, triggered mainly through the devastating effects of man-made and natural hazards and through the energy shortage and environmental pollution/global warming
IT and communication techniques continue to revolutionize our societies. Data accessibility has greatly improved and technology/knowledge transfer becomes more important than ever before
The globalization of science continues
Technologies and applications undergo an intense diversification, fostering also inter- and trans-disciplinarity
In photogrammetry specifically we have to face the following developments, with serious impacts on the whole field and in particular on the profession.
4.1. Inflation of data
“An image is worth a thousand words” – what will 100 Million images tell us?
Ubiquitous imaging. Images are easy to be produced. The data acquisition rate has improved tremendously. Avalanches of images are descending upon us: From earth observing satellites, from aerial platforms (including UAVs), from terrestrial platforms like Mobile Mapping Systems (Google and Microsoft street images, etc.). In addition, laser scanners can produce point-clouds at a rate of up to 1 million points per second.
A huge application market is predicted for drones (UAVs). A drone is able to fly for at least for half an hour and a system fully equipped with camera and navigation devices can now be bought for around 1000 USD or less. By 2020, in the US alone there will be some 20,000 UAVs at work, the Federal Aviation Administration predicts. According to the Association for Unmanned Vehicle Systems International (AUVSI), a trade group that represents makers and users of drones, about 80% of the commercial market for drones will be used for agriculture. Drone images can help in precision farming to monitor the crop, determine the moisture level, locate insect infestations, determine the amount of weed killer and fertilization, and give insurance companies a clear picture about the damages done by natural hazards.
Australian Industries expect UAVs to have a serious impact in the following five key application areas, to drive cost reduction and productivity: Maritime patrol & surveillance, mineral exploration & mine planning, situational awareness in emergency services, asset inspection and maintenance in utilities, aerial surveying for construction.
Drone use legislation is still a hot topic in most countries. The AUVSU estimated in a recent report that the legalization of commercial drones in the US could deliver economic benefits worth more than 80 USDbn over the next decade.
How can we handle all these images? Our data processing capabilities are trailing far behind data acquisition rates. Personality issues are currently ranking high in public discussions. Will we finally get the “transparent human”?
4.2 Increased system complexity
Data processing systems are becoming more and more complex, especially when we move into automated processing. It is not sufficient to just understand the basics of traditional surveying and photogrammetry. Many new subjects like Image analysis and understanding, artificial intelligence, computer graphics and animation, information system theory and others must be controlled in order to be able to handle the full field. Under these conditions shall we rely more on black-boxes or rather aim at better education to be able to understand the complexity?
4.3. Competition from neighboring disciplines
The fact that new technologies and algorithms are being used that have been developed outside our field by experts from other disciplines implies automatically that we are facing a state of competition. Computer vision in particular is an area with high overlap to photogrammetry. Very often the question is posed “What is the difference between photogrammetry and computer vision”? The newly created term “Photogrammetric Computer Vision”, while expressing the wish for integration, rather obscures than clarifies the issue. A key difference between both approaches (in simple words) is that photogrammetry is clearly result oriented, while computer vision still emphasizes the path to results.
Sometimes the adoption of misleading terms are the result of trans-disciplinarity. One such example is “SfM – Structure from Motion”, which was created by the computer vision community, but now is also widely used in photogrammetry. It denotes algorithmic approaches for generating a point cloud from a set of images, supposedly fully automatically. Firstly, in this process not only the structure of the object is generated but also the scale, location and orientation in 3D space. Secondly, motion usually plays no role in the procedures. Interestingly, motion is being used in photogrammetry, but in a different way than SfM suggests. If an object moves rigidly, its shape, location and size can be determined by just taking images from one viewpoint. In terms of data quality most SfM results cannot stand a critical analysis. The result data is usually unstructured, with plenty of gaps and blunders, such that it needs a follow-up clearance and editing procedure to make it usable.
How should we cope with the competition? By focusing on our strengths and development of our own capabilities and attitudes. This must include flexibility, openness and self-assurance. The depth in research must be maintained.
Also, we must competition turn into cooperation.
4.4. Crowdsourcing
Also a kind of competitive task is crowdsourcing. Many instances of crowdsourcing have been published recently. Crowdsourcing is appropriate as long as the task is simple enough, e.g. if specific objects are searched in a huge pile of images. As soon as the task becomes more complex, e.g. when a 3D city model has to be generated, crowdsourcing will fail. There is plenty of evidence on Google Earth. If crowdsourcing should be a valid alternative to mapping and modeling, the role of experts has to be clearly defined and appropriate quality control procedures have to be established.
Worldwide digital maps like Google Maps and Apple Maps are good examples of the urgent need to have accurate and reliable data. Both systems are struggling with the lack of good quality data. They finally realized that there must be experts in the data generation pipeline. The way they solve the problem is buying mapping companies. Google bought Skybox, a high-resolution satellite imagery company. In addition Google employs a large group of human operators to manually check the maps and correct any errors. A third of Apple´s acquisitions in 2013 were mapping companies. It purchased Locationary, a company focused on crowdsourcing location data and HopStop, which collected data from hundreds of transit agencies to help users commute via public transport, walking or biking. They also bought Embark Inc, a company which owns 10 different iOS apps that help users navigate through major cities public transportation systems.
Although there are a number of digital globes already available, the wish to have better quality data has recently resulted in the formation of a new company Vricon Inc. as a joint venture of Digital Globe and Saab. The purpose is the production of better resolution and highly accurate photorealistic products by combining the 3D modeling expertise of Saab with the huge image archive of Digital Globe.
Crowdsourcing was applied recently quite successfully after Nepal’s massive earthquake struck this Himalayan country on 25 April 2015. Barely hours after the temblor struck social media was flooded with pictures of the disaster and within 24 hours a global volunteer initiative had begun mapping physical infrastructure in Nepal’s affected areas, using OpenStreetMap to help coordinate rescue and relief operations.
4.5. The great paradigm shift in photogrammetry
The ease of data acquisition and data handling has led to a substantial paradigm shift in photogrammetry, especially in terrestrial applications, but also in UAV-based aerial projects.
In the old days of Analogue and Analytical Photogrammetry the expertise and art of image acquisition was to generate as few images as possible, because image taking was costly and also handling of the photographs in the darkroom and the following manual processing was very time-consuming and costly, both in terms of use of equipment and labor. Nowadays this situation has changed dramatically. Images are taken very quickly and at large numbers (sometimes by the thousands) and very often these images are combined with laser scans, counting also by the thousands. The great redundancy of raw data allows to delete those data which are of bad quality and those measurements which are gross erroneous, without losing essential information.
5. The photogrammetric pipeline
In image-based recording and modeling we distinguish the following components in data handling: Acquisition, processing, administration, analysis and representation. Therefore the data and information processing pipeline for turning images into models contains the following components: Raw data acquisition (using satellite, aerial and terrestrial images, laser-scans, etc.), data/information processing (geo-referencing, object measurement, semantics collection, modeling), data administration (with Spatial Information Systems-SIS), analysis (SIS) and representation (visualization, animation, simulation).
5.1. Data acquisition
We nowadays dispose of a great variety of different devices: CCD and CMOS still video cameras of various geometrical, spectral and radiometric resolutions, camcorders, linear array cameras of various types (among those three-line scanners and panoramic cameras), laser-scanners, X-ray and electronic imaging devices, microwave and ultrasound sensors, GPS/INS, video-theodolites, etc. Several aspects have led to new concepts in data acquisition: The ease of image taking, the possibilities for fast image processing and the need for real texture mapping. While traditionally the art of photogrammetry consisted in taking and processing as few images as possible, very often from a fixed stereobase, we nowadays experience a paradigm shift toward the collection of large numbers of images (image sequences), taken from all possible directions, in order to facilitate automated processing and good photo-realistic texture mapping. Also the combination of different sensors (e.g. images and laserscans) is a viable means to support automated processing.
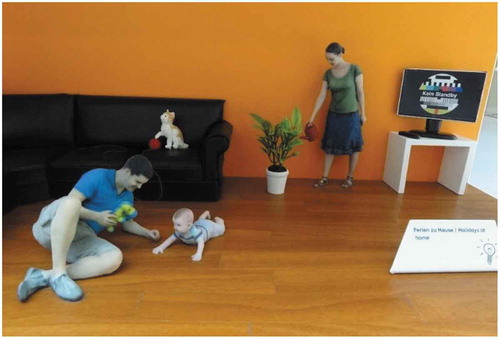
There are commercial systems for motion analysis which work with up to 245 cameras simultaneously with up to 166 Hz (Vicon). These systems depend on the use of special targets to mark the objects. Therefore only relatively few 3D trajectories of moving objects are recorded. However, there are also systems in use which apply a “Shotbox” with 64 cameras distributed over the semi-sphere and producing fully automatically 3D models of people, animals and objects. This data is the fed into a 3D printer to generate hardcopy models. shows a scene which was created by photogrammetric reality-based scanning, modeling and 3D printing.
Figure 12. A realistic 3D scene generated with a “Shotbox” of 64 cameras. The humans and other objects are realistically represented, including texture. This image is made from a 3D printed scene. Courtesy museum focusTerra, ETH Zurich, Special Exhibition “Earth´s Treasures”
5.2. Data processing
The automation of processing is the key topic in research and development today. However, one has to note that fully automatic processing procedures are still not fully developed. The related results are mostly not reliable enough and require a large amount of pre- and post-editing. One can observe very often that results generated by automated methods do by far not match the requirements of the professional user. Therefore semi-automated processing techniques have lately found some interest and offer a way out of the existing dilemma.
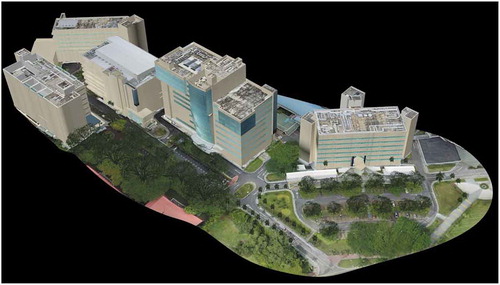
shows a 3D model of the Engineering Section of the National University of Singapore (NUS). It was generated by using a combination of aerial UAV images, terrestrial images and laser scans from a Mobile Mapping System. The data processing approach was semi-automated. Besides a detailed building representation (5 cm image footprint) also the terrain, trees and lamp posts were modeled.
Figure 13. 3D model of the engineering section of NUS, Singapore
5.3. Data administration and analysis
The use of Spatial Information Systems (SIS) has opened new venues for the storage and administration, but also for the analysis of data. The database functions of SIS allow for the storage of consistent, non-redundant data, both for geometric and attribute information. This way up-to-date vector and raster data can be combined with information from existing records. Database functionality also provides for analysis functions which would otherwise have to be implemented with much effort. Some SIS also include 3D visualization modules, which however not always represent the state-of-the-art.
5.4. Data representation
Nowadays 3D visualization products are standard. A great amount of commercial software is available for this purpose, but in most cases with severe limitations. The key parameters to be observed here are true 3D modeling, real-time capability, quality of rendering and size of datasets. There is no package available yet which would satisfy all requirements simultaneously in a reasonable way. Beyond pure visualization, techniques from Virtual Reality, Augmented Reality, Gaming, simulation and animation are also very useful for our applications.
Photogrammetry and remote sensing are image-based techniques for the extraction of metric and semantic information from images. As opposed to photogrammetry, which is strongly geometry-oriented, remote sensing is looking more into the radiometric properties of images, in order to extract useful information in particular for landuse applications. However, the steady increase of the geometrical resolution of satellite images puts the 3D modeling issues also there on the top of the priority list.
Different design and modeling approaches are applied at the following levels: Sensor (geometry, radiometry), network geometry, imaging process, image analysis, objects/scene generation, results of post-processing/analysis.
At all stages of this pipeline procedures may be executed in manual, semi-automated or fully automated modes. The overriding issues and the great challenges in research are the further automation of all processes. Currently only very few procedures can be executed automatically with reliable results. Just to mention one issue: Object extraction. As we pass through the stages object detection – 3D geometry reconstruction – semantical modeling the automation becomes increasingly difficult. Even if we look at only one, but very important problem, the generation of Digital Surface/Digital Terrain Models via image matching, we find that the automated generation of DSMs/DTMs still suffers under the following problems: Little or no texture, distinct object discontinuities, local object patch is no planar face in sufficient approximation, repetitive objects, incl. vegetation (e.g. orchards in aerial images), occlusions, moving objects, incl. shadows (by movement of the illumination source during image acquisition), multi-layered and transparent objects, radiometric artifacts, like specular reflections and others, reduction from DSM to DTM.
6. Automation of photogrammetric processing
The automation of photogrammetric processing is obviously an important factor when it comes to efficiency and costs of data processing. The success of automation in image analysis depends on many factors and is a hot topic in research. The image scale for instance plays an important role in automation. Potentially, the smaller the scale the more successful automation will be. In general one can state that
- Orientation/geo-referencing can be done in parts automatically
- DSM generation can be done automatically, but may need substantial post- editing
- Ortho-image generation is a fully automatic process
- Object extraction and modeling is possible in semi-automated mode at best
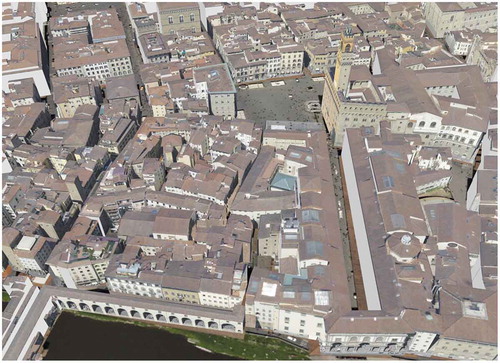
For the 3D modeling of buildings and other man-made objects we have developed a methodology and software called CyberCity Modeler (CC-Modeler). This is a semi-automated technique, where the operator measures manually in the stereomodel a weakly structured pointcloud, which describes the key points of an object. The software then turns this pointcloud automatically into a structured 3D model, which is compatible with CAD, visualization and GIS software. Texture can be added to the geometry to generate a hybrid model. A DTM can also be integrated. shows a part of downtown Firenze.
Figure 14. 3D city model of Firenze, Italy, produced with CC-Modeler (courtesy CyberCity Inc.)
The terrain is a key element in all geo-related applications and investigations and thus also in our project. The status of terrain modeling varies worldwide very much. Although there exist already worldwide Digital Surface Models (DSMs), e.g. SRTM-based, they show the terrain only in 2.5D representation, have many gaps and are partially very inaccurate. The need for more detailed modeling is obvious in many applications. Sometimes LiDAR is used, giving a height accuracy of 0.5 m in open terrain and 1.5 m in vegetation-covered terrain.
Such efforts can only be successful if the required data can be generated in an automated or at least semi-automated way. Although image matching has a long history of research and development, the problem is by far not fully solved yet.
Certain studies may require the analysis of changes occurring over time. Image-based techniques allow to go back in time and process existing older images. This has been done with the archeological site of Tucume, Peru, where a 3D model was produced from aerial images from the year 1949. Sometimes images from different platforms, sensors and times may have to be combined in 3D modeling, like in the case of our Bamiyan project in Afghanistan ().
Figure 15. The Big Buddha of Bamiyan. Left: The empty niche after destruction. Right: The computer-reconstructed 3D model
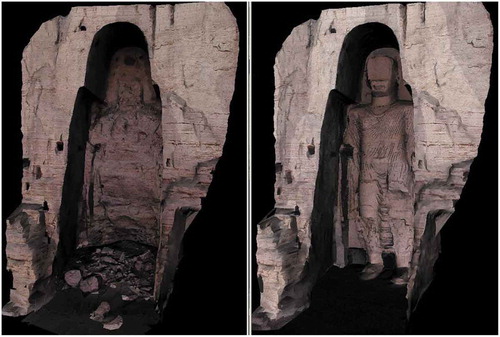
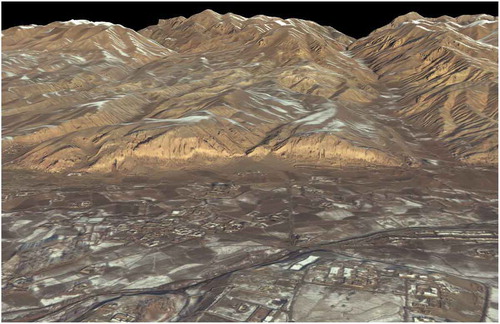
Figure 16. The Bamiyan valley and the rock cliff with the two empty Buddha niches
The modeling of large sites has received much attention in recent years. This was triggered on the one side by the increased interest of UNESCO and other supranational and national organizations, and on the other side by the new technologies available for recording, processing, administration and visualization of the data. As can be seen from the UNESCO World Heritage List (whc.unesco.org), many recent additions can actually be classified as “Large Sites”, both in terms of culture and nature. In a press release (No. 2002–77: “For UNESCO, Space Technologies should be Harnessed for Sustainable Development”) UNESCO has stressed the use of satellite imagery for monitoring World Heritage sites. Lately, many conferences are devoted to this issue. Conservation and management of these sites rely heavily on the availability and timeliness of data.
We have conducted a number of projects in the past that have shown the potential of some of the new recording, processing and modeling techniques. Among those are:
Large sites: Mount Everest, Ayers Rock/Australia, Kunming Region/China, Big Buddhas of Bamiyan/Afghanistan and surroundings (), Geoglyphs of Nasca/Peru (), Tucume/Peru, Inka settlement Pinchango Alto/Peru, Machu Picchu/Peru, Petroglyph site of Chichictara/Peru, Xochicalco/Mexico.
Figure 17. 3D model of the Nasca geoglyphs (line concentration near Palpa)
Single structures/buildings: Rock church Bet Georgis of Lalibela/Ethiopia, Bayon Tower, Angkor/Cambodia, etc.
6.1. 3D modeling – 3D mapping
Photogrammetry has always been a 3D measurement technique and 3D modeling is an essential task. In earlier times the third coordinate could not be shown, so it has been either discarded or a 2.5D representation was chosen, like in case of contour lines. Since now we have computers of sufficient computing power, storage and display capabilities there is no need to suppress the third dimension any more. In fact the issue of 3D mapping is currently discussed in many places. So far there are hardly any scientific investigations available that would shed more light on the issues involved. 3D mapping is still not fully understood in terms of
- How does it differ from traditional 2D and 2.5D mapping?
- Which objects have to be mapped and at which resolution and accuracy?
- How should truly 3D objects be modeled in terms of geometry, topology and texture?
- How should these objects be represented in the database?
- How much automation is currently possible?
There are more questions surrounding the issue of 3D mapping, like:
+ What is a 3D map?
+ How are digital globes like Google Earth/Maps changing our perception of a map?
+ How should the data be collected? Offline – Online? Is mapping of demand an option?
+ How far can we get with collaborative mapping?
+ How should object extraction be done? Manually, semi-automatically, fully automatically?
+ How should the results be represented (visualized)? Via hardcopy, softcopy. What is the role of personal map makers?
With digital 3D maps we are not limited to traditional map functions any more. Some of the digital globes show us the way already to a much extended map functionality: Automated route planning, navigation, 3D buildings, fly-over tours, street views, public transport filter (overlay of subway and bus routes, travel schedules, etc.), touristic and business locations, etc. Google is currently even developing an application that lets everybody analyze his/her situation with respect to installing solar panels. In the project Sunroof tool (https://www.google.com/get/sunroof#) one can plug in one´s address. Then Google uses aerial imagery to help one figure out whether solar power might be a worthwhile idea. Then one can fine-tune the estimate to figure out whether solar panels make financial sense, by plugging in one´s monthly electric bill, choosing a financing option (leasing versus loans versus buying), etc. Of course such functionality needs 3D city model information, as provided by photogrammetry.
Since high resolution satellite images are entering now the resolution domain of aerial images it is justified to discuss the use of such images for 3D mapping. In this context one has clearly to distinguish the geometrical aspects from the interpretation aspects (semantics). While in the first case the geo-referencing and the DTM accuracy are crucial, the footprint and the image quality are the determining factors for image interpretation.
Some countries are going ahead already with the realization of 3D maps. In Switzerland the swisstopo has introduced what is called a “Topographic Landscape Model” (TLM). There is a hierarchy of models. The TLM is the base-model for the whole country. From that different Cartography and Representation models can be derived.
Compared to current practice in the TLM there is no displacement of elements, thus no generalization needed at this level. The data will be more accurate (well defined objects 0.2–1.5 m, less well defined objects (e.g. forest borders) 1–3 m) and current through continuous updating. The data model is set up such that future extension of content will be possible.
See http://www.swisstopo.admin.ch/internet/swisstopo/en/home/topics/geodata/TLM.html.
So what is needed to realize the inherent potential of 3D maps? We need new definitions for “maps” (models) and map content. We need a classification of earth observation systems with respect to their usability for 3D modeling. Techniques for very fast object extraction and modeling have to be further developed. Reliable quality control procedures have to be established and methods for permanent updating of models have to be researched. Obviously there lie formidable tasks ahead for all members of the community (researchers, developers, national mapping agencies and mapping companies). All these activities must be undertaken in close contact with the new generations of map users.
7. Photogrammetric “deliverables”
Today professions are not clearly defined anymore and separable. This requires from our side the development of own capabilities, attitudes and strengths, but also openness, flexibility and self-assurance. So what is our strength and what should remain our focus? Here we can list the following topics: Sophisticated sensor models, network competence, refined measurement algorithms (precision), redundant data (reliability), self-diagnosis, quality control, system design for general applicability, engineering approach: testing, validation, robustification, and finally the service to the profession. Photogrammetry is not just an academic discipline, but has a substantial number of professionals and practitioners out there who deserve to receive information about the latest developments and even new products from those who are active in R&D.
Looking at the market of photogrammetric data processing software we see a large body of commercial and open-source packages being available. In a study which I did for a project in Singapore a few years ago I counted 44 modules of photogrammetric image processing software from 35 manufacturers plus 51 modules of point cloud processing software from 44 manufacturers.
8. Photogrammetry and remote sensing
Since the early 80s photogrammetry went fully digital, first a bit slow but steady in the close-range field and later, since the late 80s, also in the aerial image domain. However, until recently the processing platforms for satellite imagery, aerial and close-range images developed independently from each other. They even differed from each other to an extend that images from one domain could not even be processed with software of the other domains. This situation has changed. Nowadays we see the first systems which are capable of dealing with images of all domains, at least with respect to some functions.
It is rather surprising that this trend toward unified software platforms has not emerged earlier, as we can observe already for quite some time a convergence of processing methodologies. The following factors have contributed to this convergence and will continue to do so:
+ Use of digital images. After the introduction of digital satellite images and digital terrestrial images even the aerial image acquisition works fully digital. The different image formats or the differences in spectral channels should not pose a problem concerning the development of unified software.
+ Sensor models. Two major geometrical sensor models have emerged lately: The single frame model and the linear array model. Others, like panoramic or pointscan cameras are rather the exception. Both sensor models can be integrated as plug-ins in unified application software.
+ Multi-image acquisition and processing. Many satellite sensors are nowadays capable of producing stereo (along-track or across-track) images or even more than two images of the same scene from different viewpoints. This opens the possibility for precise 3D geo-referencing and processing. Aerial and terrestrial imagery provided for this capability already for a long time.
+ 3D processing. The possibility of 3D processing and the steadily increasing spatial resolution of satellite imagery calls for the adoption of techniques that are already in use in photogrammetry for some time. The problems that we face with the automation of the processing chain are very similar for images from different sensor platforms.
+ Sensor and data integration. The use of different kind of sensor data, e.g. images and laserscan data, GPS/INS, existing map and GIS information, etc. also leads to similar technical processing requirements.
+ Post-processing. After processing the image data we face problems that are also essentially independent of the type of imagery: Collecting and analyzing data in a Spatial Information Systems (SIS), visualization and animation of static results and processes.
With the new generation of high-resolution satellite sensors (IKONOS, Quickbird, GeoEye, WorldView-1 and-3, Pleiades, etc.) the issue of 3D modeling is gaining much more prominence. Therefore photogrammetric techniques are also becoming more important in satellite image applications. On the other hand, radiometric analyses are also attaining more attention in photogrammetry. We observe that the originally different techniques in remote sensing and photogrammetry are converging strongly today.
We are currently observing that photogrammetry and remote sensing have expanded their techniques very much in recent years – mostly toward the joint goal of precise geo-referencing and 3D modeling. This has opened many new fields of applications. The pressing need for modeling our 3D environment from aerial and high-resolution satellite images will have a tremendous impact in natural hazard damage monitoring, risk analysis, car navigation, Location-based Services, virtual tourism, and in many more applications. Several recent dramatic destructions caused by natural hazards in Asia have made us aware again of the value of high-resolution satellite imagery for fast damage assessment.
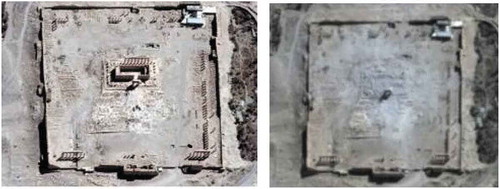
Another very recent example of the power of satellite imagery was the imaging of the Bel Temple in Palmyra, which was destroyed by ISIS, before and after destruction (see ).
Figure 18. Pleiades satellite images of the Temple of Bel, Palmyra. Left: Taken on 27.8.2015, right: Taken on 31.8.2015, after destruction (courtesy Reuters)
9. Photogrammetry – a secret technology?
With dramatically increasing use of images and derived products the need for photogrammetric expertise becomes more and more pressing. It is an interesting fact that photogrammetric technology is included in many products of our daily life, without people even knowing it: Animations in movies, computer games, Google Earth and Google Maps, Apple Maps, bio medical systems, goal-line technology, etc. The expansion of photogrammetric applications has not caused a better familiarity of the public with this technology. Large media coverages like the computer reconstruction of the Big Buddhas of Bamiyan, Afghanistan by photogrammetry are still rare.
On the other side there are Internet groups whose members publish daily results of photogrammetric works. Some of those results are quite amazing. There is for instance on Facebook a “Photogrammetry Group” with over 11,250 members with a very active membership. In addition there are groups like “Geoscience and Remote Sensing”, “UAV/UAS/RPAS/Aerial/Terrestrial Photogrammetry Surveying and Geomatics”, “UAS for mapping”, “Capturing Reality Arena”, “The Archaeology News Network”, “International Coral Reef Society”, “QGIS Community”, and so forth.
In the “The Life of Galilei” by Bertold Brecht he lets Galileo Galilei talk to Andrea Sarti: “As a scientist I had a unique opportunity. During my time astronomy reached the market places”.
In my life-time I did not have the pleasure to see photogrammetry entering the market places. But who knows, this may happen right now. Everything moves!
Aristotle: “The roots of education are bitter, but the fruits are sweet”.
Acknowledgments
During my professional career I met and cooperated with many people, who contributed significantly to the success of our group´s work – colleagues, who joined our group in Zurich as guest professors, postdocs and other senior scientists, who shared with us their experiences in dedicated areas, sponsors in Switzerland and from outside the country, who, through their generous contributions, made our activities possible in the first place, and experts from government agencies and private companies, who made sure that we would not lose touch with reality.
But above all I am thankful for the many young talented people, who joined our group, probably with the expectation to increase their own knowledge and who, in the course of their work (R&D projects, thesis work), helped building up a tremendous tower of know-how, expertise in methodology and software. This was always the main source of my motivation: To work with talented, diligent and dedicated young people and to see them growing into mature and internationally respected experts.
Data availability statement
There is no data related to this work.
Additional information
Notes on contributors
Armin Gruen
Armin Gruen was since 1984 Professor and Head of the Chair of Photogrammetry at the Institute of Geodesy and Photogrammetry, Federal Institute of Technology (ETH) Zurich, Switzerland. Since 1 August 2009 he is retired and is now working as an independent consultant on various projects. He graduated 1968 as Dipl.-Ing. in Geodetic Science and obtained his doctorate degree 1974 in Photogrammetry, both from the Technical University Munich, Germany. From 1969 to 1975 he worked as Research and Teaching Associate, and until 1981 as Chief Engineer at the Institute of Photogrammetry and Cartography, Technical University Munich. From 1981 to 1984 he acted as Associate Professor at the Department of Geodetic Science and Surveying, The Ohio State University, Columbus, Ohio, USA.Prof. Gruen has held lecturing and research assignments at various Universities and Research Facilities in Germany, Italy, Finland, Netherlands, USA, Australia, Thailand, China, Singapore. He is Member of the Editorial Boards of several scientific journals. He has published more than 500 articles and papers and is Editor and Co-editor of over 21 books and Conference Proceedings. He has organized and co-organized/co-chaired over 35 international conferences and he has served as a consultant to various government agencies, system manufacturersand engineering firms in Germany, Japan, Korea, Switzerland, USA and other countries. He is co-founder of CyberCity AG, Zurich and 4DiXplorer AG, Zurich, Switzerland. He holds a number of international awards, among which are the Otto von Gruber Gold Medal (ISPRS, 1980) and the Brock Gold Medal Award (ISPRS, 2008), the Honorary Membership of the ISPRS (2008), the Honorable Doctorate (Dr.h.c.) from the Aristotle University, Thessaloniki, Greece (2015) and the Honorary Membership of the Asian Association of Remote Sensing (AARS, 2018).As Principal Investigator on the Simulation Platform of the SEC-FCL (Future Cities Laboratory) project he was recently mainly involved in Smart City applications of 3D/4D city models, including the generation and updating of those models from high-resolution satellite and UAV images. Currently he is involved as PI in the international project MOOREA IDEA (Island Digital Ecosystem Avatar) – an Avatar for tropical islands, contributing mainly to the physical modeling aspects of the project. He also acts as the scientific-technical leader of the R&D project on 3D/4D city modeling in the context of the “Virtual Singapore” project (“FCL Virtual Singapore”). See https://en.wikipedia.org/wiki/Armin_Gruen and https://www.researchgate.net/profile/Armin_Gruen.
References
- Dolezal, E. 1896. “Die Anwendung der Photographie in der praktischen Messkunst.” In Ausgabe 22 von Encyklopädie der Photographie, Verlag Wilhelm Knapp, Halle/Saale
- Gruen, A., 1998. “Real-time Photogrammetry: The Fast Road to Virtual Worlds ?” Keynote paper, ISPRS Commission V Symposium on ‘Real-Time Imaging and Dynamic Analysis, June 2-5. Hakodate/ Japan. Int. Arch. of Photogrammetry and Remote Sensing, Vol. 32, Part 5, pp. 1-8; Festschrift zur Emeritierung Prof. Dr. h.c. Gottfried Konecny, Wissenschaftliche Arbeiten der Fachrichtung Vermessungswesen der Univ. Hannover, Nr. 227, pp. 127-136
- Konecny, G., 2010. “100 Years ISPRS.” ISPRS Centenary Celebration, Vienna University of Technology. Accessed 4 July 2010. https://www.isprs.org/documents/centenary/afternoon_lectures/1_100_years_ISPRS_Final.pdf
- Pfeifer, N., 2010. “Photogrammetry and Remote Sensing. Beyond the Centenary.” ISPRS Centenary Celebration, Vienna University of Technology. Accessed 4 July 2010. https://www.isprs.org/documents/centenary/afternoon_lectures/3_pfeifer_centenary.pdf
- Qin, R., and A. Gruen. 2020. “The Role of Machine Intelligence in Photogrammetric 3D Modeling – An Overview and Perspectives.” International Journal of Digital Earth 1–17. doi:10.1080/17538947.2020.1805037.