
 ?Mathematical formulae have been encoded as MathML and are displayed in this HTML version using MathJax in order to improve their display. Uncheck the box to turn MathJax off. This feature requires Javascript. Click on a formula to zoom.
ABSTRACT
The classification of urban functional areas plays an important role in urban planning and resource management. Although previous studies have confirmed that different urban functional areas have different morphological structures and Land Surface Temperature (LST) characteristics, these two types of characteristics have rarely been fully integrated and used for functional area classification. In this paper, a new framework for classifying urban functional areas is proposed by combining urban morphological features and LST features. First, metrics are constructed from three levels, namely, building, road and region, which are used to portray urban morphology; LST is retrieved using thermal infrared remote sensing to reflect LST features with four metrics: the average temperature, maximum temperature, temperature difference and standard deviation of temperature. Then, the functional areas are classified into four categories: service/public land, commercial land, residential land and industrial land. A random forest algorithm is used to effectively fuse the features of these two categories and classify the functional areas. The effectiveness of the proposed framework is tested in the study area of Shenzhen City, Guangdong Province. The results show that the combined classification accuracy of the proposed classification method is 0.85, which is 0.26 higher than that of the classification model based on urban morphology and 0.1 higher than that of the classification model based on LST features. The proposed framework verifies that the integration of LST features into urban functional area classification is reliable and effectively combines urban morphology and LST features for functional area classification.
1. Introduction
A rich natural landscape can be gradually transformed into an artificial surface through intensive human activities (Song et al. Citation2018), forming a complex and diverse urban functional area. Urban functions can involve several types of land use with variable spatial distributions. This functional attribute reflects the basic structure of a city driven by multiple characteristics, including service/public residential, commercial, and industrial functions, among others; the corresponding functions are generally aggregated based on the spatial patterns of individual geographic objects (Zhang and Du Citation2015; Xing and Meng Citation2018). These functions were initially designed by city planners and further reshaped naturally with the influence of human activities and city evolution (Yuan et al. Citation2015). In recent years, rapid urbanization has led to significant and complex changes in urban functions (Liu et al. Citation2017b, Citation2012), and such changes have highlighted the important roles of different functions in urban planning and resource management and further demonstrated the need for the effective classification of urban functions.
With the development and application of crowdsourced data, the classification methods of urban functional areas have gradually become diversified (Wu, Gui, and Yang Citation2020). Many scholars carve various morphological features of cities based on Point-Of-Interest (POI) data, remote sensing data, road data, etc. (Wu et al. Citation2021), such as spatial distribution features of buildings, road network density features, road landscape features, etc., and divide urban space into categories such as commercial, residential, and industrial zones based on the features. These research types include target classification using POI data and functional area delineation with a hierarchical semantic cognitive model (Zhang, Du, and Wang Citation2017). Different types of urban information have been obtained from diurnal optical remote sensing images and fused with POI and street view data for functional area classification to effectively extract urban morphology and functional information (Huang et al. Citation2021). In addition, urban area patches divided by road networks can express urban morphological information considering urban landscape elements and the spatial composition (Getz and Saltz Citation2008). These data involve various subsets of urban functional information, and the internal morphology and core functions of urban patches still cannot be fully and accurately determined based on basic data fusion alone (Hu et al. Citation2016).
In the context of landscape ecology, many scholars have introduced theories of landscape ecology to quantify urban spatial components and their interactions into effective urban morphological information by establishing urban landscape metrics to determine urban functional areas based on urban landscapes (Barnsley and Barr Citation1997). For example, (Chen, Xu, and Devereux Citation2014) improved the traditional spatial measurement method, integrated the side length, area and height information of landscape elements, and quantified the two-dimensional and three-dimensional forms of various cities. (Vanderhaegen and Canters Citation2017) focused on the characteristics of built landscapes and their spatial configuration metrics to quantify urban morphology and function. (Xing and Meng Citation2020) integrated multiple spatial metrics for urban landscapes, secondary roads and other areas and the interactions among factors to construct an automatic classification framework for urban functions, which effectively improved the accuracy of urban function classification. However, there are still some challenges in using urban morphological information to classify functional areas; notably, metrics are typically extracted from large-scale urban landscapes, and the obtained data cannot fully reflect the morphology of cities and thus be used to assess urban functions. Moreover, similar morphological structures such as residential and commercial areas are often poorly classified. Therefore, there is still uncertainty in classifying urban functions based on urban morphology alone.
In recent years, the Urban Heat Island (UHI) phenomenon has become one of the most discussed urban environmental issues (Huang, Liu, and Li Citation2021; Yang et al. Citation2020), and has changed the surface energy balance (Haashemi et al. Citation2016); this heat island influence may lead to various adverse effects (Patz et al. Citation2005; Vargo et al. Citation2016). Consequently, the urban thermal environment has gradually become a popular research topic in the field of urban planning and sustainable development (Wu et al. Citation2014). Especially for urban functional areas, various spatial characteristics, intensities of human activities and energy consumption levels lead to unique thermal characteristics (Yao, Xu, and Zhang Citation2019). To understand and solve various UHI problems at the appropriate scale, many scholars have started to analyze the spatial heterogeneity pattern of the urban thermal environment by establishing the relationship between urban LST and urban functional areas (Guo et al. Citation2016; Feng et al. Citation2019b). For example, (Sun et al. Citation2013) analyzed how functional areas can be designed to regulate LST effectively by analyzing the stability of the mean annual temperature in winter and summer in different functional areas. (Li, Xu, and Yao Citation2021; Yao, Xu, and Zhang Citation2019) further assessed the effect of urbanization on the UHI effect by analyzing the relationship among this effect, the complexity of urban functions and the landscape structure. (Feng et al. Citation2019b) expressed the heterogeneous relationship between LST and the landscape by introducing urban functional areas. The results of these studies highlighted the differences in LST features in different functional areas and the potential of introducing LST features into functional area classification work.
Existing studies have attempted to improve the classification of functional areas through feature fusion. For example, (Gao, Janowicz, and Couclelis Citation2017; Tu et al. Citation2018) tried to extract natural features such as city morphology from high-resolution remote sensing images; additionally, roads, buildings, social attributes, and other data were obtained from POI information and cell phone positioning data through multi-feature fusion for urban functional area mapping. All of the above studies successfully incorporated information on urban social attributes into the classification of functional areas, but there are some problems with this general approach. First, the obtained social attribute information depends on the degree of access to crowdsourced data. Second, the generation of crowdsourced data is irregular, and the distribution is highly spatially heterogeneous; this issue poses a challenge for integrating multisource features and performing large-scale functional area classification. Therefore, LST features have been used to characterize social activities. Since LST is highly influenced by human social activities (Shahmohamadi et al. Citation2011; Guo et al. Citation2020) and the development of thermal infrared remote sensing has provided a fast and convenient way to obtain LSTs at a large scale, combining urban morphology and LST characteristics may be equally effective in classifying urban functions.
However, the following challenges remain with the introduction of LST features: first, it must be determined how to fuse these features and at what scale to perform the classification. For the first problem, existing methods can be generally classified into manual methods and machine learning methods such as random forest algorithms and Convolutional Neural Networks (CNNs) (Amini et al. Citation2018). Manual methods tend to rely on experts’ empirical knowledge (Bian et al. Citation2017), while CNN methods are usually applicable to high-dimensional features and applied to large data sets for easily interpretable and fast classification; therefore, the random forest algorithm in machine learning is chosen in this paper to integrate features. For the second problem, traditional approaches, including pixel-level and object-level classification, heavily rely on mining spectral, textural and geometrical features. However, such methods are not suitable for distinguishing urban functions because the former is limited to low- or medium-resolution images (Blaschke Citation2010; Blaschke et al. Citation2014) and the latter overlooks the spatial arrangements of independent elements and is insufficient for estimating morphological relationships (Farabet et al. Citation2013). Since road networks are initially designed by urban planners to delineate specific areas, this paper measures morphological indicators and LST features at the scale of parcels delineated by road networks.
Based on this hypothesis, this paper proposes an urban functional area delineation framework that integrates urban morphology and LST features. The greatest advantage of this framework is that it introduces LST features to assist in functional area classification. The contributions of our work are three-fold. First, we design a method to detect urban morphological features and effectively obtain information on the morphological structure of urban functional areas. Second, the spatial heterogeneity of urban LSTs is systematically considered to distinguish spatial locations and different statistical features to classify urban functions. Third, comparative experiments based on urban morphology, LST features, and the fusion of the two information types are performed to demonstrate the effectiveness of the proposed method.
The remainder of this paper is organized as follows. Section 2 explains the framework for integrating urban morphological features and LST features for classifying urban functions. Section 3 shows the experimental data and results of the analysis. Section 4 discusses in detail the feature importance of the classification model and the advantages of the feature fusion approach in the classification model. Section 5 presents the conclusions of this paper.
2. Methodology
2.1. Overview
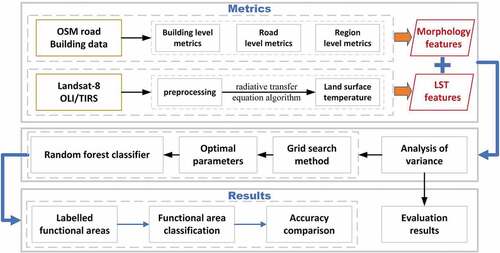
The proposed approach consists of three main parts, the framework of which is shown in . In the first part, we outline three levels of urban morphology at the building, road and area levels based on Open Street Map (OSM) road and building data (Section 2.2). Then, we retrieve urban LSTs based on Landsat-8 remote sensing images and select the maximum temperature, average temperature, temperature difference and temperature standard deviation at the functional area scale to characterize the urban LST. In the second part, we automatically classify urban functional areas based on urban morphological features, LST features, and the combination of both feature types (Section 2.4). Specifically, a random forest model is used to effectively integrate urban morphological features and LST features. In this model, two parameters, including the number of trees and number of features, need to be determined in advance to balance the accuracy and complexity of the model. The effective combination of both parameters can avoid model overfitting and reduce the generalization error, and the best model is obtained by combining different parameters. The third part involves obtaining the classification and evaluation results.
Figure 1. Framework of urban function classification.
2.2 Delineation of urban morphological metrics
To effectively reflect the real form and structure of a city, the following morphological metrics are proposed in this section, as listed in , at the building, road and area levels; these metrics are effectively measured in this study.
Table 1. Urban morphology metrics
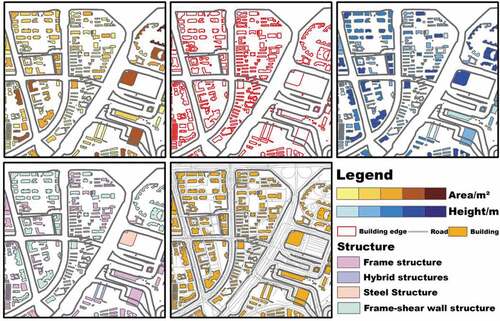
shows some typical examples of a real situation and the corresponding indices. It is important to note that indicators related to the building floor area, building edges, building heights and building structures are measured for each functional area based on building data. Information about area and height are included in the third part of the experiment. Edges and structures are derived from spatial calculations based on data sources. There are significant differences in urban morphology within and among different functional areas.
Figure 2. Typical example of urban morphology index measurements.
2.2.1. Delineation of building level metrics
The area of a building explains the extent to which the functional area is occupied by the building footprint. In this paper, four morphological metrics, namely, the total building area, maximum building area, average building area and standard deviation of the building area, are constructed separately. The edges of a building can be interpreted as the length of the building profile and reflect the complexity of the building shape in the functional area. We use three morphological metrics, namely, the total number of building edges, average number of building edges and standard deviation of building edges, to describe the urban morphological characteristics. In addition, the height of a building is an important attribute used to measure the vertical orientation of the urban form. The average building height and the standard deviation of building height are proposed to express morphological characteristics. The building structure can reflect the different architectural styles in a functional area and be designed to meet different functional needs. The building structure is expressed by the ratio of the building area to the building height. Based on the building structure, the average structure index and the standard deviation of the building structure index in the same functional area are calculated as supplementary morphological metrics.
2.2.2. Delineation of road-level metrics
The distribution of roads in an area also reflects the different functional requirements of the area. To characterize the urban form at the road level, the total length of roads in each functional area can be calculated based on the road network data to establish the total road length metric. In addition, two other metrics are considered: the ratio of roads to buildings and the ratio of roads to other areas. These metrics are calculated by dividing the total length of roads in a functional area by the total area of buildings or other areas. These metrics consider the spatial distribution of roads in a city and reflect the requirement to provide different urban functions.
2.2.3. Delineation of region-level metrics
To reflect the urban form at the block level, we use the patch-averaged fractal dimension and landscape shape index to describe the physical properties of cities from the perspective of the landscape and assess the spatial distributions of and relationships between functional areas and buildings.
The average patch fractal dimension provides information on the irregularity of the building distribution in a functional area and is reflective of the building landscape. The fractal dimension is calculated as follows.
Variables and
are the length and area of building edges, respectively. The average value of all buildings in each functional area was calculated as the average patch fractal dimension.
The landscape morphology index represents the spatial agglomeration and heterogeneity of buildings in a functional area, which is reflective of the architectural landscape. The landscape morphology index was calculated as follows.
Variables and
refer to the edge length and area of the
building within a functional area, respectively.
2.3. Urban LST feature extraction
2.3.1. LST retrieval based on a radiative transfer algorithm
Generally, data were preprocessed with a radiometric calibration process and line-of-sight atmospheric analysis of spectral hypercubes for atmospheric correction. Based on existing studies of LST inversion with Landsat-8 remote sensing imagery, a radiometric algorithm is used to retrieve LSTs (Callejas Citation2011; Chen et al. Citation2006). This algorithm is a conventional temperature inversion model based on an atmospheric radiative transfer model, and the surface thermal radiation intensity can be obtained by subtracting the bias of atmospheric influence from the total thermal radiation observed by satellite sensors and converting the result to the corresponding LST. Considering the difference in retrieval accuracy of different retrieval algorithms in different seasons, the radiative transfer equation method exhibits similar retrieval results in different seasons(Sekertekin and Bonafoni Citation2020; Yu, Guo, and Wu Citation2014). The method is able to link data limitations and improve the transferability of our classification framework. The formula for its calculation is shown below.
where is the true LST;
is the blackbody emissivity;
is the surface specific emissivity;
is the atmospheric transmittance in the thermal infrared band;
is the image radiometric calibration;
is the atmospheric upward radiometric intensity;
is the atmospheric downward radiometric intensity; and
and
are coefficients. In the Landsat-8 thermal infrared band,
774.885
and
1321.079
. On the NASA website (https://atmcorr.gsfc.nasa.gov), the values of
,
, and
can be obtained as 0.72, 2.18, and 3.46, respectively.
2.3.2. Feature extraction and description
Different LSTs reflect different regional landscape layouts and functional needs (Song et al. Citation2014). Based on the urban LST obtained by inversion, as shown in , we selected and calculated the average temperature, maximum temperature, regional temperature difference and standard deviation of the temperature in each functional area to reflect the statistical characteristics of LST. Generally, the thermal effects of industrial and commercial areas are more significant than those of other areas, and the thermal effect of service/public areas is relatively small. Notably, the regional maximum temperature is generally associated with areas with abnormal geothermal phenomena, such as industrial areas. The regional average temperature reflects the overall thermal intensity inside a functional area, which is usually related to the intensity of human activities. The regional temperature difference and standard deviation of the temperature can reflect the variations in thermal characteristics within a functional area.
Table 2. Characteristic indexes of LST
2.4. Functional area classification based on morphological metrics and LST characteristics
The random forest algorithm has been verified as a sufficient approach for classification in land cover/land use applications (Rodriguez-Galiano et al. Citation2012a, Citation2012b) and is a highly flexible machine learning algorithm that integrates multiple trees through the concept of integrated learning based on the traditional decision tree algorithm and ultimately makes decisions based on multiple tree voting. This method can effectively improve the classification accuracy of new samples. In particular, the randomness of the algorithm is reflected in the fact that the training samples for each decision tree are randomly selected and the splitting attributes of each node in the tree are randomly selected.
The random forest algorithm requires two user-defined parameters, including the number of features used to generate the tree at each node and the number of growing trees. An efficient combination of parameters can effectively reduce the complexity of the algorithm and enhance the effectiveness of the features, and the grid search method can be used to systematically traverse multiple parameter combinations and determine the best effect parameters through cross-validation. That is, the parameters are adjusted sequentially in steps within the specified parameter ranges, and the adjusted parameters are used to train the learner and find the most accurate parameter in the test set from all the parameters; this approach is actually a training and comparison process. The accuracy assessment results for different parameter combinations are displayed in Section 3.3.2.
3. Results
3.1. Study area and data
The study area is located in Shenzhen, Guangdong Province (), with a total area of 1997.47 km2. As one of the national economic centers and an international city, Shenzhen has a complex and heterogeneous landscape reflecting a variety of urban functions. Therefore, this paper aims to classify four major urban functions, including service/public function, residential function, commercial function, and industrial function, according to the proposed framework.
Figure 3. Study area and experimental data.
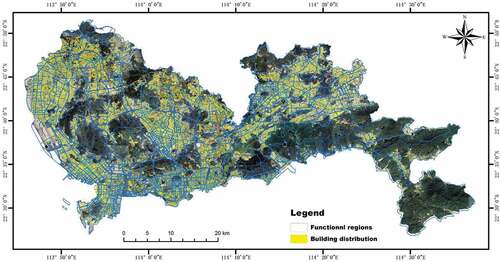
On the basis of the selected area, 1792 parcels were first classified based on the roads obtained from OpenStreetMap. The building data and real functional area data were provided by the Shenzhen Urban Planning and Land Resources Commission (Shenzhen Ocean Bureau). Among them, the data of the actual functional area are the real data of the Shenzhen planning department, which provides rich semantic information on the training set labels. It can provide data support for our classification framework. Second, to obtain LST features, Landsat-8 images taken on 2 November 2019, at 10:52 a.m. BST was selected to retrieve LST, which was lower at this time, but the difference did not significantly affect the results because the study focused on the relative patterns of LST rather than the absolute values. Landsat-8 images consist of 11 spectral bands, including 9 multispectral bands and 2 thermal infrared bands, and are among the most common data sources for LST retrieval.
3.2. Urban morphology and LST features for classification
3.2.1 LST retrieval results
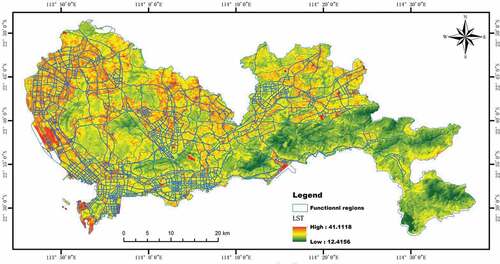
The LST retrieval results are shown in . The temperature range is 12.4 to 41.1 degrees Celsius, the lowest surface temperature is associated with water bodies, and the highest surface temperature is associated with buildings. The complex surface temperature in this area highlights the need for this study. Data were collected during daytime in autumn and under cloud-free conditions. According to the historical meteorological data for Shenzhen, the maximum temperature in Shenzhen at that time was 30°C, the weather was sunny, and the northeast wind was grade 2; these characteristics are representative surface thermal characteristics of Shenzhen and meet the application requirements.
Figure 4. LST retrieval results and functional area.
3.2.2 The calculated urban morphological metrics and LST features
The calculated urban morphological metrics and LST features are shown in . The figure shows five statistics for each feature metric: the first quartile, median, third quartile, minimum and maximum values after removing outliers. For the urban morphology metrics, ME, RRO, MPFD, and LSI exhibit a relatively symmetrical pattern, and the other metrics display trends with a long head and a minimum value of 0, thus creating high outliers, which indicates that most functions are at the building, road, and regional levels. There are large morphological differences among regions.
Figure 5. Box plots of urban morphology and LST metrics.
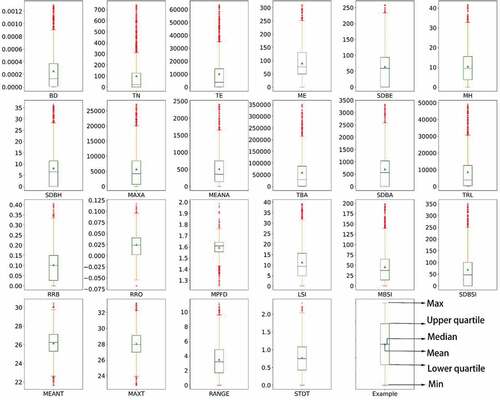
For the four metrics of LST, a relatively symmetrical median is presented, indicating that the LST metrics for most functional areas fluctuate within a relatively stable range and that the presence of outliers provides support for regional classification.
The above 18 morphological metrics show the changes in, diversity of and spatial layout of the urban morphological distribution at the building, road and region scales. The four LST characteristics show the differences in the thermal environment at a regional scale and reflect the differences in the intensity of human social activities. Therefore, these described metrics can effectively describe the urban form and LST characteristics and be used to classify different urban functions.
3.3 Model evaluation
3.3.1 Evaluation of morphological metrics and LST characteristics
Urban morphological metrics and LST features are required to assess the importance and contribution of each feature in functional region classification. The relationship among morphological metrics, LST features and different functional types was analyzed by ANOVA of 1792 functional type areas, as shown in . The urban morphological metrics all display Sig. values less than 0.01. Moreover, except for MEANA, SDBA, and RRB, all the metrics have Sig. values equal to 0.000 and relatively high F values; therefore, they can be used as effective variables for functional area classification. Compared with other metrics, these metrics passed the significance test, but their explanatory power was not as good as some other metrics. Among the LST features, the contribution of each feature to functional area classification was large, with a minimum F-value of 46.665, and the LST features were all significantly correlated with the functional type (Sig. = 0.000). The above analysis assessed the efficiency of the proposed urban morphology metrics and LST features, determined the strength of each feature’s contribution to the classification of urban functions, and further revealed the applicability of these features in functional regions.
Table 3. The results of the variance analysis of urban morphological metrics and LST characteristics
3.3.2 Grid Search Method for Determining Hyperparameters
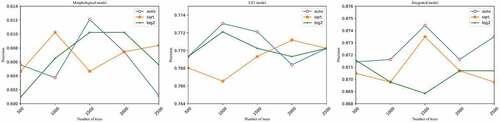
After the evaluation of urban morphological metrics and LST features, the random forest algorithm uses these features for functional area classification. The number of trees and number of features, which need to be provided during the construction of this algorithm, are set based on the grid search method; the number of trees in the random forest is set to [500, 1000, 1500, 2000, 2500], and the number of features is set to [“auto”, “sqrt”, “log2”], where auto indicates that all meaningful features in each tree are considered. There is no restriction on individual trees. Moreover, sqrt involves taking the square root of the total number of features in a single run, and in the log2 case, 20% of the variance is considered in a single run. The best parameters were determined for each model in the 15 sets of controlled experiments. As shown in , the optimal parameters for the morphological model were [“1500”, “auto”], the optimal parameters for the LST model were [“1000”, “auto”], and the optimal parameters for the combined model were [“1500”, “auto”].
Figure 6. Hyperparameter results using a grid search method.
3.4 Urban function classification and accuracy assessment
As shown in ), Shenzhen is divided into 1792 functional areas. Among them, 1075 and 717 areas were classified to establish training and testing data sets, respectively. Then, classification models based on the urban morphology, LST features and feature fusion were constructed.
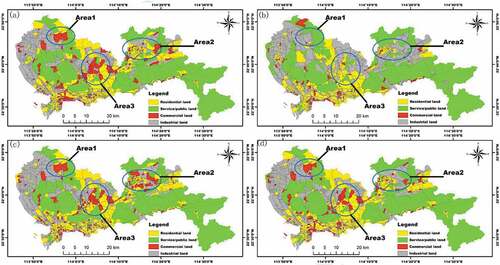
Figure 7. Functional area classification. (a) Actual classification. (b) Classification results based on urban morphology. (c) Classification results based on LST characteristics. (d) Classification results based on both the urban morphology and LST.
shows the classification accuracy for each functional area type. The classification model based on urban morphology yields an overall accuracy of 0.59 and a kappa coefficient of 0.40, and when only surface temperature features are applied for classification, the overall accuracy is 0.75 and the kappa coefficient is 0.64; these results illustrate the obvious advantages of using LST features in the classification of urban functional areas. However, by combining these features, the overall accuracy increases significantly to 0.85, and the kappa coefficient increases to 0.78. For the fusion model, a significant improvement in classification accuracy is achieved, except for the user accuracy of service/public areas. In particular, the improvement in classification accuracy for residential and commercial areas is extremely obvious.
Table 4. Classification accuracy of urban functional areas based on morphological, LST, and integrated models
The classification results based on the urban morphology, LST features and combined features are shown in ), (c) and (d). Notably, the classification results based on urban morphology are best in relatively small functional areas, and the classification results based on LST features are best in large functional areas. Differences can be seen in three prominent typical areas. In area 1, using urban morphological features, commercial land uses are misclassified into other types, and using LST features and all features can provide more accurate results. In area 2, a large region with a mix of commercial and residential public uses, the urban morphological features successfully capture the industrial and residential attributes of the region, while the LST features capture more of the commercial attributes of the region. Neither of the single-feature models achieves excellent results, but the combined feature model integrates the information for more features and achieves a more accurate classification result. In area 3, the urban morphology model barely captures the commercial attributes of the region and more often misclassifies these attributes as residential, which is related to the high similarity between the morphological structures of residential and commercial areas; the LST model and the fusion model overcome this shortcoming and achieve good classification results in this region. The above classification results indicate that it is reasonable to combine these features to improve the classification accuracy of functional areas. This result highlights the advantages of fusing urban morphological and surface temperature features to classify urban functional areas.
4. Discussion
This paper provides an interesting framework for the classification of urban functional areas. In this framework, we introduce LST features that are fused with urban morphological metrics to identify functional areas, and improved classification results were obtained. The results demonstrate the variability in the LST characteristics of the different functional areas and the considerable potential of applying these characteristics for functional area classification. However, the challenges of using these data remain undiscussed and should be considered.
4.1. Contributions of morphological metrics and LST to classification
One of the characteristics of the random forest algorithm is that it provides good model interpretability (Strobl et al. Citation2007). The model we built achieved good classification results, but the importance of classification features requires further discussion. Through feature importance evaluation, we can determine which features are most important, which can help us further assess the applicability of the model and make certain adjustments to the model to improve robustness. Commonly used methods can measure the importance of features by calculating the purity of nodes through the Gini index (Menze et al. Citation2009; Boulesteix et al. Citation2012).
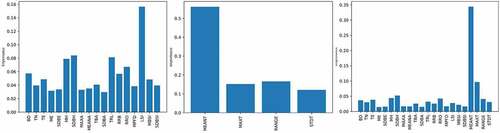
shows the results of the importance assessment of model characteristics based on the Gini coefficient. For the urban morphology classification model, the LSI feature contributes the most to the result, accounting for more than 15% of the importance among the 18 features; in addition, the importance of MH, SDBH, TRL and RRO indicates that the building-, road- and area-level metrics selected in this paper all contribute to the functional area classification. For the LST classification model, the most important feature is the mean temperature in the functional area (MEANT), which accounts for 55% of the importance of the four features; moreover, even the least-important feature accounts for more than 10% of the overall importance, which verifies the effectiveness of the features. For the fusion model proposed in this paper, the most important feature is still MEANT, and it is much more important than other features, which reflects the effectiveness of considering LST in urban functional area classification.
Figure 8. The relative importance of the features in the three models.
Although morphological metrics and LST features were effectively evaluated, there are still two aspects of the analysis that need to be further discussed: the availability of crowdsourced data used to construct morphological metrics and the reasons why LST improves the classification accuracy of functional areas.
For the first problem, data availability influences the process of morphological metric construction. The building data used in this article are officially provided by the government and provide valuable spatial and structural information to quantify the urban form. Although no single building-level metric makes a large contribution to the overall result, the overall contribution is 30.13%. Such data are not available everywhere; however, these data are necessary for quantifying the urban form. In the context of this problem, with the development of online maps (such as Baidu Maps, Gaode Maps, etc.) (Chen et al. Citation2018), increasing amounts of spatial information, attribute information, and building data can be obtained from these open-source platforms. In addition, remote sensing image building extraction based on methods such as deep learning has gradually become another reliable data source (Shao et al. Citation2020; Zhang et al. Citation2017).
In terms of the second problem, what exactly LSTs can indicate has been discussed in many studies (Liu et al. Citation2017a; Feng et al. Citation2019a). These studies concluded that LST is associated with urban imperviousness, high densities of buildings, vegetated water bodies, etc. Thus, it represents the intensity of mankind’s transformation of the natural environment. The results show that due to the contribution of LST features, we can describe the types of urban functions from the perspective of human activities (Portela et al. Citation2020; Zhou et al. Citation2020). Compared with traditional social media data, check-in data, bus swiping data, etc., LST data are generally more readily available. We suggest that the LST features quantified from remote sensing images can describe functional areas and guide urban construction and structural improvement.
4.2. Urban function classification with feature fusion
Feature fusion has been verified as an effective way to improve the accuracy of classification algorithms (Mangai et al. Citation2010). However, the actual fusion process must be further assessed. A typical example can be found in . When using morphological metrics and LST features separately, the user accuracy for service/public land is 0.45 and 0.90, respectively. However, when these features are used together, the user’s accuracy is 0.87, lower than that for LST features alone. These problems require a more effective selection and the use of morphological metrics and LST features for functional zoning. The uncertainty of these characteristics must be considered, especially in the selection of morphological metrics, although some metrics have low ANOVA F values, and importance assessments based on the Gini coefficient are not sufficient in the actual classification process. The roles of many characteristics are still unknown, and methods such as Principal Component Analysis (PCA) and the Analytic Hierarchy Process (AHP) can be considered for classification improvement. These methods support feature filtering. Moreover, a more automated classification method is needed. For example, neural networks have the potential to solve this feature complexity problem.
4.3. The quality and timing of LST
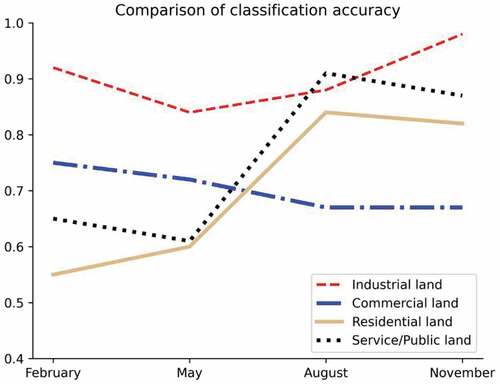
In describing the effectiveness of LST features for the classification of urban functions, the images used by the proposed method should be compared for a wide range of applications (Wu et al. Citation2020). The first issue is the quality of remotely sensed images. To consider the accuracy of LST retrieval, the current selection method focuses on choosing images with fewer clouds during the daytime by limiting the transit time and cloud amount (Zhou, Huang, and Cadenasso Citation2011). The second problem is the selection of remote sensing image time. In this paper, a classification framework combined with LST is proposed to select remote sensing images under sunny and less cloudy weather in Shenzhen in summer to ensure image quality. In fact, the time selection of remote sensing images is more complicated. For this reason, we design a comparison experiment by selecting remote sensing images in February, May, August and November to invert the LST and quantify the LST features into the random forest classification framework, and the classification results are shown in . Among them, the best classification accuracy is derived from the November images for industrial areas, February for commercial areas, and August for residential areas and service/public areas. More specifically, the August and November images of Shenzhen City achieve better classification results in the classification framework, with average classification accuracies of 0.84 and 0.82, respectively, especially for residential land, presumably due to the more pronounced spatial heterogeneity of the August and November LSTs. This result indicates that the selection time of images causes the variability of classification accuracy in this classification framework; however, this issue does not have a very significant impact on the results, and such data can be generated relatively easily under comparison experiments. However, the fusion of multi-temporal data to eliminate this variability to improve the classification framework will be an important area for future research.
Figure 9. Comparison of the different LST times on classification accuracy.
4.4. Limitations and future research directions
In the future, we will improve our ability to classify functional areas from the following aspects. First, although satisfactory results have been achieved for the study area, the four types of systems in this article are limited. Therefore, we hope to be able to classify more functional area types in the future. Second, LST features are introduced in this paper to assist in functional area classification, and future research will focus on how to fuse LST retrieval results from different months and dates to improve the accuracy of functional area classification. Third, this article uses a road network to divide plots, and the existence of mixed functional areas cannot be avoided; these areas lead to errors in the division of functional types. In future research. We hope to integrate multisource data, such as text data from POI and Weibo data sets. In addition to classifying single functional types, we will also consider the identification of mixed functional areas. Moreover, because LST data are relatively easy to obtain, in the future, we will try to map urban functional areas on a large regional scale, such as at the scale of urban clusters.
5. Conclusions
Urban morphological information and LST data provide a wealth of information on urban structures and functions; therefore, such data can be applied in the classification of urban functional areas, but they have not been fully integrated and analyzed. In this paper, we discuss the classification of functional areas by integrating urban morphological features and LST features. In this paper, a system of indicators is developed to measure urban morphology at three levels: the building, road and area levels. To obtain the features of urban LST, thermal infrared remote sensing is used to retrieve LST and describe thermal features in terms of four aspects: the maximum temperature, average temperature, temperature difference and standard deviation of the temperature change. Finally, a random forest algorithm is used to effectively couple the two types of features to classify functional areas. The results based on the experimental data show that the overall classification accuracy rate is 0.85, which is an increase of 0.26 and 0.1 compared with a single morphological model and LST model, respectively. The Kappa coefficient is 0.78, which is 0.38 and 0.14 higher than that of the single model. The results show that the morphological differences and LSTs of different functional areas are obvious. The fusion of the two types of features can significantly improve the classification accuracy, especially for residential and commercial areas, which are not well classified with the single-class feature models. This framework for ensemble classification can achieve good classification results. These results show the reliability of city function classification based on the random forest algorithm fusion of morphological features and LST features.
Previous studies have confirmed that different functional areas have different morphological structures and LSTs. The framework proposed in this paper provides an interesting perspective on the classification of urban functional areas by using the two types of features in reverse for fusion analysis. In addition, the results of this study are instructive for policy makers and urban designers and can help them couple urban structure and thermal environmental effects in planning to reduce the negative impacts of UHI.
Disclosure statement
No potential conflict of interest was reported by the author(s).
Data availability statement
The data that support the findings of this study are available at [http://www.gscloud.cn/, https://www.openstreetmap.org/], These data were derived from the following resources available in the public domain: [http://www.gscloud.cn/, https://www.openstreetmap.org/]
The building and real functional area data that support the findings of this study are available from the corresponding author, [Hanfa Xing], upon reasonable request.
Additional information
Funding
Notes on contributors
Bin Li
Bin Li is currently pursuing the MS degree in geographic information science from Shandong Normal University. His research interests include the spatial analysis of land use/land cover and applied urban modeling.
Yefei Liu
Yefei Liu will receive the BS degree in geographic information science from Shandong Normal University, China, in 2022, Her research interests include tectonic geochemistry, sulfide deposit, and Arctic glaciology.
Hanfa Xing
Hanfa Xing received the PhD degree in cartography and geographical information engineering from Central South University, China, in 2012. His research interests include urban landscape analysis, human activity mining, and applied urban modeling.
Yuan Meng
Yuan Meng received the MS degree in cartography and geographical information science from Shandong Normal University, China, in 2019. Her research interests include the spatial analysis of land use/land cover, built environment, and human behavior patterns.
Guang Yang
Guang Yang received the PhD degree in photogrammetry and remote sensing from Wuhan University, China, in 2017. His research interests include spatial fairness of urban greenery, land cover classification and remote sensing of the environment.
Xiaoding Liu
Xiaoding Liu is the chairman of the Guangdong Society of Surveying and Mapping, and the dean of the Guangdong Academy of Land and Resources Surveying and Mapping. His research interests include urban spatial planning and mapping
Yaolong Zhao
Yaolong Zhao received the PhD degree in geography from the University of Tsukuba, Tsukuba, Japan, in 2007. His research interests include historical GIS and cultural geography.
References
- Amini, S., S. Homayouni, A. Safari, and A.A. Darvishsefat. 2018. “Object-based Classification of Hyperspectral Data Using Random Forest Algorithm.” Geo-spatial Information Science 21 (2): 127–138. doi:10.1080/10095020.2017.1399674.
- Barnsley, M.J., and S.L. Barr. 1997. “Distinguishing Urban Land-use Categories in Fine Spatial Resolution Land-cover Data Using a Graph-based, Structural Pattern Recognition System.” Computers, Environment and Urban Systems 21: 209–225. doi:10.1016/S0198-9715(97)10001-1.
- Bian, X., C. Chen, L. Tian, and Q. Du. 2017. “Fusing Local and Global Features for High-Resolution Scene Classification.” IEEE Journal of Selected Topics in Applied Earth Observations and Remote Sensing 10 (6): 2889–2901. doi:10.1109/JSTARS.2017.2683799.
- Blaschke, T. 2010. “Object Based Image Analysis for Remote Sensing.” ISPRS Journal of Photogrammetry and Remote Sensing 65 (1): 2–16. doi:10.1016/j.isprsjprs.2009.06.004.
- Blaschke, T., G.J. Hay, M. Kelly, S. Lang, P. Hofmann, E. Addink, R. Queiroz Feitosa, et al. 2014. “Geographic Object-Based Image Analysis - Towards a New Paradigm.” ISPRS Journal of Photogrammetry and Remote Sensing 87 (100): 180–191. doi:10.1016/j.isprsjprs.2013.09.014.
- Boulesteix, A.L., A. Bender, J. Lorenzo Bermejo, and C. Strobl. 2012. “Random Forest Gini Importance Favours SNPs with Large Minor Allele Frequency: Impact, Sources and Recommendations.” Briefings in Bioinformatics 13 (3): 292–304. doi:10.1093/bib/bbr053.
- Callejas, I. J. A. 2011. “Relationship between Land Use/cover and Surface Temperatures in the Urban Agglomeration of Cuiabá-Várzea Grande, Central Brazil.” Journal of Applied Remote Sensing 5 (1): 053569. doi:10.1117/1.3666044.
- Chen, S., W. Lang, X. Li, C. Shen, and Q. Fan. 2018. “Determining the Influence of Building Density on Heat Island Effect Using Baidu Map and Remote Sensing.” Photogrammetric Engineering and Remote Sensing 84 (9): 549–558. doi:10.14358/PERS.84.9.549.
- Chen, X.-L., H.-M. Zhao, P.-X. Li, and Z.-Y. Yin. 2006. “Remote Sensing Image-based Analysis of the Relationship between Urban Heat Island and Land Use/cover Changes.” Remote Sensing of Environment 104 (2): 133–146. doi:10.1016/j.rse.2005.11.016.
- Chen, Z., B. Xu, and B. Devereux. 2014. “Urban Landscape Pattern Analysis Based on 3D Landscape Models.” Applied Geography 55: 82–91. doi:10.1016/j.apgeog.2014.09.006.
- Farabet, C., C. Couprie, L. Najman, and Y. Lecun. 2013. “Learning Hierarchical Features for Scene Labeling.” IEEE Transactions on Pattern Analysis and Machine Intelligence 35 (8): 1915–1929. doi:10.1109/TPAMI.2012.231.
- Feng, Y., C. Gao, X. Tong, S. Chen, Z. Lei, and J. Wang. 2019a. “Spatial Patterns of Land Surface Temperature and Their Influencing Factors: A Case Study in Suzhou, China.” Remote Sensing 11 (2): 182. doi:10.3390/rs11020182.
- Feng, Y., S. Du, S.W. Myint, and M. Shu. 2019b. “Do Urban Functional Zones Affect Land Surface Temperature Differently? A Case Study of Beijing, China.” Remote Sensing 11 (15): 1802. doi:10.3390/rs11151802.
- Gao, S., K. Janowicz, and H. Couclelis. 2017. “Extracting Urban Functional Regions from Points of Interest and Human Activities on Location-based Social Networks.” Transactions in GIS 21 (3): 446–467. doi:10.1111/tgis.12289.
- Getz, W.M., and D. Saltz. 2008. “A Framework for Generating and Analyzing Movement Paths on Ecological Landscapes.” Proceedings of the National Academy of Sciences 105 (49): 19066–19071. doi:10.1073/pnas.0801732105.
- Guo, A., J. Yang, X. Xiao, J. Xia, C. Jin, and X. Li. 2020. “Influences of Urban Spatial Form on Urban Heat Island Effects at the Community Level in China.” Sustainable Cities and Society 53: 101972. doi:10.1016/j.scs.2019.101972.
- Guo, G., X. Zhou, Z. Wu, R. Xiao, and Y. Chen. 2016. “Characterizing the Impact of Urban Morphology Heterogeneity on Land Surface Temperature in Guangzhou, China.” Environmental Modelling and Software 84: 427–439. doi:10.1016/j.envsoft.2016.06.021.
- Haashemi, S., Q. Weng, A. Darvishi, and S. Alavipanah. 2016. “Seasonal Variations of the Surface Urban Heat Island in a Semi-Arid City.” Remote Sensing 8 (4): 352. doi:10.3390/rs8040352.
- Hu, T., J. Yang, X. Li, and P. Gong. 2016. “Mapping Urban Land Use by Using Landsat Images and Open Social Data.” Remote Sensing 8 (2): 151. doi:10.3390/rs8020151.
- Huang, X., J. Yang, J. Li, and D. Wen. 2021. “Urban Functional Zone Mapping by Integrating High Spatial Resolution Nighttime Light and Daytime Multi-view Imagery.” ISPRS Journal of Photogrammetry and Remote Sensing 175: 403–415. doi:10.1016/j.isprsjprs.2021.03.019.
- Huang, Xin, Anling Liu, and Jiayi Li. 2021. ”Mapping and analyzing the local climate zones in China’s 32 major cities using Landsat imagery based on a novel convolutional neural network.” Geo-spatial Information Science 24 (4):528–557. doi: 10.1080/10095020.2021.1892459
- Li, T., Y. Xu, and L. Yao. 2021. “Detecting Urban Landscape Factors Controlling Seasonal Land Surface Temperature: From the Perspective of Urban Function Zones.” Environmental Science and Pollution Research 1–16. doi:10.1007/s11356-020-11060-z.
- Liu, W., J. Feddema, L. Hu, A. Zung, and N. Brunsell. 2017a. “Seasonal and Diurnal Characteristics of Land Surface Temperature and Major Explanatory Factors in Harris County, Texas.” Sustainability 9 (12): 2324. doi:10.3390/su9122324.
- Liu, Xiaoping, Jialv He, Yao Yao, Jinbao Zhang, Haolin Liang, Huan Wang, and Ye Hong. 2017. ”Classifying urban land use by integrating remote sensing and social media data.” International Journal of Geographical Information Science 31 (8):1675–1696. doi: 10.1080/13658816.2017.1324976.
- Liu, Y., F. Wang, Y. Xiao, and S. Gao. 2012. “Urban Land Uses and Traffic ‘Source-sink Areas’: Evidence from GPS-enabled Taxi Data in Shanghai.” Landscape and Urban Planning 106 (1): 73–87. doi:10.1016/j.landurbplan.2012.02.012.
- Mangai, U., S. Samanta, S. Das, and P. Chowdhury. 2010. “A Survey of Decision Fusion and Feature Fusion Strategies for Pattern Classification.” IETE Technical Review 27 (4): 293–307. doi:10.4103/0256-4602.64604.
- Menze, B.H., B.M. Kelm, R. Masuch, U. Himmelreich, P. Bachert, W. Petrich, and F.A. Hamprecht. 2009. “A Comparison of Random Forest and Its Gini Importance with Standard Chemometric Methods for the Feature Selection and Classification of Spectral Data.” BMC Bioinformatics 10: 213. doi:10.1186/1471-2105-10-213.
- Patz, J.A., D. Campbell-Lendrum, T. Holloway, and J.A. Foley. 2005. “Impact of Regional Climate Change on Human Health.” Nature 438 (7066): 310–317. doi:10.1038/nature04188.
- Portela, C.I., K.G. Massi, T. Rodrigues, and E. Alcântara. 2020. “Impact of Urban and Industrial Features on Land Surface Temperature: Evidences from Satellite Thermal Indices.” Sustainable Cities and Society 56: 102100. doi:10.1016/j.scs.2020.102100.
- Rodriguez-Galiano, V.F., M. Chica-Olmo, F. Abarca-Hernandez, P.M. Atkinson, and C. Jeganathan. 2012a. “Random Forest Classification of Mediterranean Land Cover Using Multi-seasonal Imagery and Multi-seasonal Texture.” Remote Sensing of Environment 121: 93–107. doi:10.1016/j.rse.2011.12.003.
- Rodriguez-Galiano, V.F., B. Ghimire, J. Rogan, M. Chica-Olmo, and J.P. Rigol-Sanchez. 2012b. “An Assessment of the Effectiveness of a Random Forest Classifier for Land-cover Classification.” ISPRS Journal of Photogrammetry and Remote Sensing 67: 93–104. doi:10.1016/j.isprsjprs.2011.11.002.
- Sekertekin, A., and S. Bonafoni. 2020. “Land Surface Temperature Retrieval from Landsat 5, 7, and 8 over Rural Areas: Assessment of Different Retrieval Algorithms and Emissivity Models and Toolbox Implementation.” Remote Sensing 12 (2): 294. doi:10.3390/rs12020294.
- Shahmohamadi, P., A.I. Che-Ani, K.N.A. Maulud, N.M. Tawil, and N.A.G. Abdullah. 2011. “The Impact of Anthropogenic Heat on Formation of Urban Heat Island and Energy Consumption Balance.” Urban Studies Research 2011: 1–9. doi:10.1155/2011/497524.
- Shao, Z., P. Tang, Z. Wang, N. Saleem, S. Yam, and C. Sommai. 2020. “BRRNet: A Fully Convolutional Neural Network for Automatic Building Extraction from High-Resolution Remote Sensing Images.” Remote Sensing 12 (6): 1050. doi:10.3390/rs12061050.
- Song, J., S. Du, X. Feng, and L. Guo. 2014. “The Relationships between Landscape Compositions and Land Surface Temperature: Quantifying Their Resolution Sensitivity with Spatial Regression Models.” Landscape and Urban Planning 123: 145–157. doi:10.1016/j.landurbplan.2013.11.014.
- Song, X.P., M.C. Hansen, S.V. Stehman, P.V. Potapov, A. Tyukavina, E.F. Vermote, and J.R. Townshend. 2018. “Global Land Change from 1982 to 2016.” Nature 560 (7720): 639–643. doi:10.1038/s41586-018-0411-9.
- Strobl, C., A.L. Boulesteix, A. Zeileis, and T. Hothorn. 2007. “Bias in Random Forest Variable Importance Measures: Illustrations, Sources and a Solution.” BMC Bioinformatics 8: 25. doi:10.1186/1471-2105-8-25.
- Sun, R., Y. Lü, L. Chen, L. Yang, and A. Chen. 2013. “Assessing the Stability of Annual Temperatures for Different Urban Functional Zones.” Building and Environment 65: 90–98. doi:10.1016/j.buildenv.2013.04.001.
- Tu, W., Z. Hu, L. Li, J. Cao, J. Jiang, L. Qiuping, and Q. Li. 2018. “Portraying Urban Functional Zones by Coupling Remote Sensing Imagery and Human Sensing Data.” Remote Sensing 10 (1): 141. doi:10.3390/rs10010141.
- Vanderhaegen, S., and F. Canters. 2017. “Mapping Urban Form and Function at City Block Level Using Spatial Metrics.” Landscape and Urban Planning 167: 399–409. doi:10.1016/j.landurbplan.2017.05.023.
- Vargo, J., B. Stone, D. Habeeb, P. Liu, and A. Russell. 2016. “The Social and Spatial Distribution of Temperature-related Health Impacts from Urban Heat Island Reduction Policies.” Environmental Science & Policy 66: 366–374. doi:10.1016/j.envsci.2016.08.012.
- Wu, H., A. Lin, K.C. Clarke, W. Shi, A. Cardenas-Tristan, and Z. Tu. 2020. “A Comprehensive Quality Assessment Framework for Linear Features from Volunteered Geographic Information.” International Journal of Geographical Information Science 35 (9): 1826–1847. doi:10.1080/13658816.2020.1832228.
- Wu, H., L.-P. Ye, W.-Z. Shi, and K.C. Clarke. 2014. “Assessing the Effects of Land Use Spatial Structure on Urban Heat Islands Using HJ-1B Remote Sensing Imagery in Wuhan, China.” International Journal of Applied Earth Observation and Geoinformation 32: 67–78. doi:10.1016/j.jag.2014.03.019.
- Wu, H., Z. Gui, and Z. Yang. 2020. “Geospatial Big Data for Urban Planning and Urban Management.” Geo-spatial Information Science 23 (4): 273–274. doi:10.1080/10095020.2020.1854981.
- Xing, H., and Y. Meng. 2018. “Integrating Landscape Metrics and Socioeconomic Features for Urban Functional Region Classification.” Computers, Environment and Urban Systems 72: 134–145. doi:10.1016/j.compenvurbsys.2018.06.005.
- Xing, H., and Y. Meng. 2020. “Measuring Urban Landscapes for Urban Function Classification Using Spatial Metrics.” Ecological Indicators 108: 105722. doi:10.1016/j.ecolind.2019.105722.
- Yang, C., Q. Zhan, S. Gao, and H. Liu. 2020. “Characterizing the Spatial and Temporal Variation of the Land Surface Temperature Hotspots in Wuhan from a Local Scale.” Geo-spatial Information Science 23 (4): 327–340. doi:10.1080/10095020.2020.1834882.
- Yao, L., Y. Xu, and B. Zhang. 2019. “Effect of Urban Function and Landscape Structure on the Urban Heat Island Phenomenon in Beijing, China.” Landscape and Ecological Engineering 15 (4): 379–390. doi:10.1007/s11355-019-00388-5.
- Yu, X., X. Guo, and Z. Wu. 2014. “Land Surface Temperature Retrieval from Landsat 8 TIRS—Comparison between Radiative Transfer Equation-Based Method, Split Window Algorithm and Single Channel Method.” Remote Sensing 6 (10): 9829–9852. doi:10.3390/rs6109829.
- Yuan, N.J., Y. Zheng, X. Xie, Y. Wang, K. Zheng, and H. Xiong. 2015. “Discovering Urban Functional Zones Using Latent Activity Trajectories.” IEEE Transactions on Knowledge and Data Engineering 27 (3): 712–725. doi:10.1109/TKDE.2014.2345405.
- Zhang, X., and S. Du. 2015. “A Linear Dirichlet Mixture Model for Decomposing Scenes: Application to Analyzing Urban Functional Zonings.” Remote Sensing of Environment 169: 37–49. doi:10.1016/j.rse.2015.07.017.
- Zhang, X., S. Du, and Q. Wang. 2017. “Hierarchical Semantic Cognition for Urban Functional Zones with VHR Satellite Images and POI Data.” ISPRS Journal of Photogrammetry and Remote Sensing 132: 170–184. doi:10.1016/j.isprsjprs.2017.09.007.
- Zhang, X., P. Xiao, X. Feng, and M. Yuan. 2017. “Separate Segmentation of Multi-temporal High-resolution Remote Sensing Images for Object-based Change Detection in Urban Area.” Remote Sensing of Environment 201: 243–255. doi:10.1016/j.rse.2017.09.022.
- Zhou, S., K. Wang, S. Yang, W. Li, Y. Zhang, B. Zhang, Y. Fu, et al. 2020. “Warming Effort and Energy Budget Difference of Various Human Land Use Intensity: Case Study of Beijing, China.” Land 9 (9): 280. doi:10.3390/land9090280.
- Zhou, W., G. Huang, and M.L. Cadenasso. 2011. “Does Spatial Configuration Matter? Understanding the Effects of Land Cover Pattern on Land Surface Temperature in Urban Landscapes.” Landscape and Urban Planning 102 (1): 54–63. doi:10.1016/j.landurbplan.2011.03.009.
- Wu, Hao, Anqi Lin, Xudong Xing, Danxia Song, and Yan Li. 2021. ”Identifying core driving factors of urban land use change from global land cover products and POI data using the random forest method.” International Journal of Applied Earth Observation and Geoinformation 103:102475. doi: https://doi.org/10.1016/j.jag.2021.102475