
 ?Mathematical formulae have been encoded as MathML and are displayed in this HTML version using MathJax in order to improve their display. Uncheck the box to turn MathJax off. This feature requires Javascript. Click on a formula to zoom.
ABSTRACT
The frequency-modulated continuous wave (FMCW) ladar is a useful sensor for remote sensing applications and has been widely used in both the military and civilian fields for precise geospatial data acquisition. Typically, the FMCW-ladar signal is collected by use of the heterodyne detection through the dechirping so as to decrease the sampling rate commensurate with the bandwidth. In this manuscript, we proposed a novel scheme for processing the FMCW-ladar signal acquired through the simplified heterodyne detection, and the sampling rate was the same as that in the dechirp detection. Based on the time–frequency relation of the FMCW-ladar signal, two algorithms were proposed to post-process the echo acquired by the simplified heterodyne detection with the sub-Nyquist sampling rate. For the FMCW-ladar echo data acquired by the simplified heterodyne detection with the same sampling rate as in the traditional dechirp detection, the algorithms can achieve the unambiguous range image retaining the range resolution commensurate with the transmitted chirp bandwidth. The effectiveness of the scheme was validated by simulation and real data processing experiments. The capability of the proposed scheme provides an alternative for the FMCW-ladar system without use of the dechirp detection, which can benefit the future FMCW-ladar and microwave photonics radar applications in the remote sensing.
1. Introduction
The coherent ladar has been used for both the commercial and military applications, including the range measurement, range-resolved velocity and vibration measurement, range imaging, and synthetic aperture ladar imaging (Beck et al. Citation2005; Gao, Maurice, and H. Rongqing Citation2012; Klotz, Halmos, and Bulot Citation2013; Hu et al. Citation2018; Salas Citation2021). One of the key capabilities required of the coherent ladar system is to provide the fine range resolution with a high signal-to-noise ratio (SNR). From the radar/ladar community, the FMCW-ladar system can provide the large bandwidth and high SNR. In comparison to the pulsed ladar system, FMCW-ladar transmits chirp with long duration and large bandwidth. Besides, the FMCW-ladar benefits from its lower peak power, smaller volume, and lower cost. Thus, the FMCW-ladar system has been widely used in many applications, such as the remote precision range, range imaging, and SAL imaging (Karlsson and Olsson Citation1999; Barber et al. Citation2013; Barber and Dahl Citation2014; Li et al. Citation2017).
For the high resolution FMCW-ladar system, the bandwidth can be as large as several gigahertz or even several terahertz. According to the Shannon–Nyquist theorem, directly sampling the received echo acquired by the simplified heterodyne detection requires an unreasonable analog-to-digital converter (ADC) rate (Gao and Hui Citation2012). Thus, the dechirp detection is employed to compress the bandwidth in the optical domain by using a delayed copy of the transmitted chirp signal as the local oscillator (LO) for the coherent detection. Then an ADC with lower sampling rate can convert the analog signal to the discrete samples. The dechirp technique benefits the FMCW-ladar system and is the most common heterodyne detection in the ladar community (Gao, Maurice, and Rongqing Citation2012; Li et al. Citation2017). However, in some applications of the FMCW-ladar with dechirp detection, there are some problems that need to be concerned. First, the delay of the LO should be approximately equal to the round-trip delay of the ladar signal in the space (Meta, Hoogeboom, and Ligthart Citation2007). This limits the flexibility when the ladar works with varying operating distance. When the difference between the real round-trip delay and the LO dalay is becoming larger, the beat frequency may be folded (i.e. wrap around in the frequency domain). Then the folded beat frequency may result in a wrong range measurement. Second, in the real measurement situations, the error between the LO delay and the round-trip time is inevitable. Thus, the beat signal comprises two components, one is the desired with lower beat frequency and the other is of higher beat frequency. This results in a bandwidth loss and energy loss. Third, as the echo and reference replica signal are acquired by the dechirp detection, the estimation and compensation of the nonlinear phase are troublesome (Meta, Hoogeboom, and Ligthart Citation2007). Besides, the delay of the LO is typically accomplished by traveling the LO in the fiber delay line. The platform vibration can affect the fiber line and induce phase noises to the LO, which will degenerate the coherence. Thus, extra measures are needed to isolate the vibration from the fiber line in the airborne applications.
In this manuscript, to avoid those shortcomings of the dechirp detection, a novel scheme for FMCW-ladar with simplified heterodyne detection was proposed. In the practical applications of the FMCW-ladar, the range swath delay (i.e. the round-trip delay difference between the nearest target and the farthest target) is usually much shorter than the chirp duration. Then according to the time–frequency relation of the FMCW, the signal instantaneous bandwidth in the receiver is proportional to the swath, which means that the signal instantaneous bandwidth is much smaller than the chirp bandwidth. Thus, by using the sampling rate higher than the instantaneous bandwidth, signal can be acquired without spectrum aliasing in a short interval. While for the signal in the whole chirp duration, the signal is still spectrum aliased. To effectively process the echo acquired by the sub-Nyquist sampling rate, two post-processing methods were proposed in the manuscript. The methods can achieve the unambiguous range imaging result and retain the range resolution commensurate with the transmitted chirp bandwidth. In the proposed scheme, disadvantages of the dechirp detection were avoided and the ADC rate was the same as that in the traditional dechirp detection scheme.
The rest of the manuscript consists of six sections discussing the novel scheme of the FMCW-ladar system and its processing algorithms. Section 2 describes the previous work related to the manuscript. Section 3 focuses on the time frequency relation analysis and provides the rational for the novel scheme. Section 4 proposes the short-time deramping method for post-processing the echo. Section 5 proposes the SPECAN de-aliasing based method. In Section 6, the simulation and real data processing experiments are both performed. The conclusion is given in Section 7.
2. Related work of the FMCW-ladar
In our previous work, we mainly focused on the FMCW-ladar system with both high repetition frequency and wide bandwidth (Mottet and Nicolas Citation2016; Li, Mo, and Wang et al. Citation2018), and the developed system is the basis of the proposed novel scheme in the manuscript.
The generation scheme of the FMCW-ladar signal is illustrated in . The generator is mainly based on a LiNbO3-I&Q modulator, which consist of a dual-parallel Mach–Zehnder interferometer (MZI) nested inside a third MZI. In the figure, the red line denotes the driving signal travel line and the blue line denotes the bias voltage control.
Figure 1. The generation of the FMCW-ladar with high repetition and wide bandwidth.
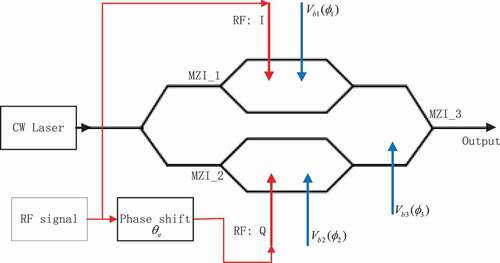
By properly biased the MZIs, the output of the modulator can be the same as the radio frequency (RF) driving signal while at the optic waveband. Thus, by setting the RF signal to be of the FMCW signal, the FMCW-ladar signal can be generated, and the wavelength is the same as the seed laser, which is denoted by the continuous wave (CW) laser in .
For the traditional FMCW-ladar system and our previously developed system, the delay of the modulator output was used as the LO signal. Thus, the dechirp detection was performed in the optical domain. After the optical dechirp detection, the bandwidth of the electronic signal was decreased drastically. Thus, the echo can be sampled by a slow ADC rate. However, the slow ADC rate was achieved at the cost of the optical delay of the same FMCW-ladar signal and may induce some troublesome problems such as the limits of flexibility and the loss of the effective power.
3. Time–frequency relation of the ladar echo
The time–frequency relation is shown in . In the diagrammatic sketch, the abscissa axis is the range time with the round-trip delay of the center target as the origin. The vertical axis is the range frequency with 0 Hz as the origin. The solid oblique lines denotes the linear frequency modulation of the nearest target, the center target, and the farthest target, respectively. and
are the bandwidth and the pulse duration of the transmitted signal, respectively.
is the instantaneous bandwidth depending on the
.
Figure 2. Time–frequency relation of the echo.
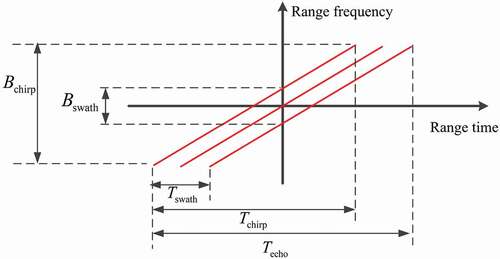
Based on the time–frequency relation in , we have:
where is the chirp rate of the transmitted signal.
As the instantaneous bandwidth is constant during the chirp duration, the echo can be complex sampled by use of the sampling frequency higher than
. However, a certain interval of samples is always needed for the signal processing. Thus, in a small time burst, the bandwidth is
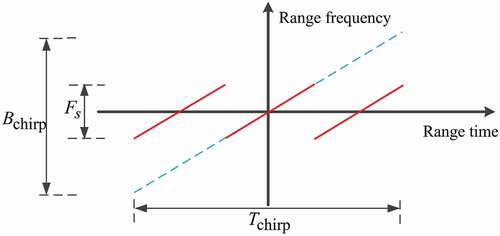
By using the sampling frequency , the received echo can by sampled without spectrum aliasing in the burst. However, in the total time duration of the echo, signal is aliased (Oppenheim and Schafer Citation1999). By taking the center target as the example, the observed time–frequency relation of the sampled echo is shown in . For simplicity and without loss of generality, the sampling frequency is one third of the total bandwidth, i.e.
. The observed frequency spectrum is aliased. While in each burst (one third of the total duration), signal has no aliasing and corresponds to a frequency folding due to its frequency center in the burst.
Figure 3. The observed time–frequency relation of the sampled echo.
Obviously, even the signal is aliased in the total duration, the signal in each short burst can be properly sampled. This provides the feasibility to obtain the unambiguous range imaging result as the echo sampled by use of the Nyquist sampling frequency. In the following, two post-processing methods are proposed. Both methods can achieve the range image without ghost images and retain the range resolution commensurate with the transmitted chirp bandwidth. The short-time deramping-based method is suitable for range imaging in real time implementation, while the SPECAN de-aliasing-based method is suitable for the SAL imaging.
4. The short-time deramping-based method
First, according to the constraints of sampling rate and distance range, the collected signals are divided into several time slots in the signal cycle, so that there is no spectrum aliasing in the time slots; for different time slots, short-time deramp processing is adopted, so that the targets of different distances correspond to single frequency signals of different frequencies; because different time slots are processed by deramp, the same signal is generated. The target corresponds to the same frequency in different time slots, so all time slots are spliced directly, and the signal of the whole cycle is analyzed in time-frequency, then the imaging result of range direction non aliasing can be obtained, and the imaging resolution is the same as that of the ideal Nyquist sampling condition.
For a point target, the received echo can be written as:
where is the range time,
is the round-trip delay,
is the ladar carrier frequency,
is the rectangular window, which is defined as:
As the derivation mainly concerns the phase, the nonessential amplitude terms are ignored in EquationEquation (3)(3)
(3) .
Since the signal satisfies the Nyquist sampling theorem in a certain time interval, the received echo signal can be divided it into several time burst in the range time. The burst duration is:
Then, the signal in the burst is:
where is the burst index number along the range time. Compared with the total echo duration, the burst length is very short.
For the burst, we define the reference deramp function as
where:
and is the reference time to perform the short-time deramping.
Multiplying EquationEquation (7)(7)
(7) to EquationEquation (6)
(6)
(6) yields:
where . The term “short-time” means that the burst duration is far smaller than the chirp duration, and the deramping is performed on a burst basis.
In EquationEquation (7)(7)
(7) ,
is typically set as the range center delay time so as to convert the signal denoted by EquationEquation (9)
(9)
(9) to the baseband. By combining all the bursts after deramping, we have:
From EquationEquation (10)(10)
(10) , the recombined signal after deramping is of single frequency and its frequency is
.
The previous analysis has been focused on the signal component backscattered by a single target located at . For the practical application, we consider a scene in the swath. Then the total bandwidth of the echo is:
where and
are the round-trip delays of the nearest target and the farthest target, respectively,
is the swath in range. According to EquationEquation (3)
(3)
(3) , the signal denoted by EquationEquation (10)
(10)
(10) is sufficiently sampled and the non-aliasing frequency spectrum can be obtained. Performing the discrete Fourier transform (DFT) to EquationEquation (10)
(10)
(10) yields:
where and
is the range frequency. In EquationEquation (12)
(12)
(12) , the
term represents the compressed range image and the target is compressed to its frequency
. The first exponential term in EquationEquation (12)
(12)
(12) is the delay phase and can be used for the Doppler measurement and Azimuth resolving. The second and the third exponential terms are constant for a particular target, but they depend on the target position.
For the phase preservation of the coherent detection, extra step is needed to compensate the second and the third terms. The signal after FFT has been compressed, and the main energy has been focused on its peak location . Thus, similar to the residual video phase compensation in [11], the compensation function can be developed as:
Multiplying (13) with (12) yields the final range compressed image as:
The range image is compressed in the frequency domain, and its resolution (in distance unit meter) is:
where is the bandwidth of the transmitted signal. The resolution is the same as the theoretical one commensurate with the transmitted chirp bandwidth.
In the range compression, each burst can be processed individually and only a small number of samples in each burst. Thus, the method is computational efficient and suitable for parallel or real-time computing implementation. For real-time implementation, the reference deramp functions for all the bursts can be constructed beforehand. Then along with the arriving of the signal samples, each burst can be processed in real-time one by one in the short interval. Finally, only a long-time FFT is needed to achieve the high resolution range compressed image. The computational amount consists of the short-time deramping ( points complex multiplication), the full-time frequency spectrum analysis (
points FFT), and the residual phase compensation (
points complex multiplication). As the
is much smaller than the chirp bandwidth, the total computational amount decreased significantly. Compared to the traditional match filter-based range imaging method, the sampling rate and computational amount are both decreased significantly.
5. The SPECAN de-aliasing-based method
The previous short-time deramping-based method is very efficient and amenable for real-time implementation. However, for the SAL imaging, due to the skew of the deramped echo in the time domain, accurately performing the azimuth weighting needs extra steps. Also, in some applications such as the SAL imaging, the non-aliased frequency spectrum is needed for the fine image formation. In the RDA and the CSA, some steps of the imaging formation are carried out in two-dimensional frequency domain (Jakowatz et al. Citation1996; Raney et al. Citation1994; Bamler Citation1994; Lanari et al. Citation2001). Thus, reconstructing the non-aliased spectrum is essential for the echo sampled by sub-Nyquist rate. Here, based on the idea of the SPECAN, a method is proposed to de-aliasing the sub-sampled echo. As the non-aliasing spectrum is reconstructed, the windowing can be performed in frequency domain and the range image can be compressed in time domain. The derivation is as follows.
The received signal of the point target located away from the ladar is denoted by EquationEquation (4)(4)
(4) . And the de-aliasing is achieved through a convolution with a reference function. The reference function is:
The convolution of EquationEquation (16)(16)
(16) with EquationEquation (4)
(4)
(4) can be expressed as:
By letting , the EquationEquation (17)
(17)
(17) can be rewritten as:
After the convolution, the range compression is accomplished in range time domain. The resolution of the range compressed image is , the same as the traditional coherent ladar system under the Nyquist sampling rate.
As the received ladar data are sampled by ADC, we investigate the implementation of the SPECAN-based de-aliasing in the discrete domain. The output of the convolution in discrete domain is:
where is the sampling interval of input signal, which is the same as the ADC sampling interval,
is the effective sampling interval of the output signal,
is the number of input signal samples, and we have
. To ensure that the output signal spectrum has no aliasing, we have:
In order to keep a certain over-sampling ratio, we assume , where
. Then EquationEquation (19)
(19)
(19) can be written as:
With , where
is the output signal sample number, and
is the nearest integer function. From EquationEquation (21)
(21)
(21) , the last exponential factor has the form of the Fourier transform (FT) kernel. In order to use the Fast FT (FFT) to the signal denoted by EquationEquation (21)
(21)
(21) , we set
to meet the following equation as:
where with
being the nearest integers greater than or equal operator. Then, we can rewrite EquationEquation (21)
(21)
(21) as follows:
with . From EquationEquation (20)
(20)
(20) , EquationEquation (21)
(21)
(21) , and EquationEquation (22)
(22)
(22) , we have that the
is of the order of
. A small number of zero padding of the input signal is required and then the discrete implementation can be performed by a SPECAN processing (involving a chirp multiplication and a subsequent FFT) and an additional phase multiplication.
From EquationEquation (23)(23)
(23) , the effective sampling rate of the output signal is
which is sufficient to sample the received echo data. As the spectrum aliasing has been eliminated, the spectrum of signal denoted by EquationEquation (23)(23)
(23) can be obtained by performing the FT directly as:
with ,
is the Fourier transformation of the transmitted signal
and
is the FT of the referenonction
. Both signals are effectively sampled with
. Then, those processes that are required to be performed in the frequency domain can be carried out directly. Taking the range compression of EquationEquation (25)
(25)
(25) in frequency domain as an example, we have:
where
with is the frequency in the discrete domain.
is the match filter of the transmitted signal, which is employed to implement the range compression.
is the conjugated signal of
, which is used to compensate the SPECAN-based de-aliasing processing denoted by EquationEquation (17)
(17)
(17) . As the algorithm is developed in the discrete signal domain, we use the discrete variables.
In EquationEquation (26)(26)
(26) , the window function can by used as the signal are in the frequency domain. Performing the inverse FT to EquationEquation (26)
(26)
(26) yields the range compressed image without ghosts in the range time domain. As denoted by EquationEquation (17)
(17)
(17) , the compression of the echo is actually a convolution and the phase preservation can be guaranteed (Lanari et al. Citation2001).
6. Experiment and result
In order to validate the proposed methods for processing the FMCW-ladar signal acquired with low sampling rate, both the simulation and real data processing experiment were carried out.
6.1 Simulation and results
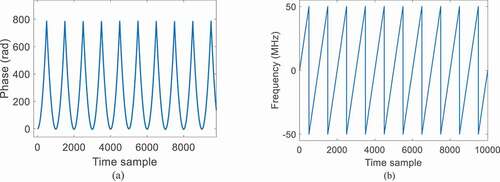
We first demonstrate the effectiveness of the proposed algorithm through simulation. In the simulation, the transmitted bandwidth was 1 GHz, chirp duration was 100 μs, and the wavelength of the seed laser was 1550 nm. Three point targets were located 12 km away from the ladar system, and the distances between couples of the adjacent point targets are 30 cm and 60 cm, respectively. The swath was 200 m. In the receiver, the simplified heterodyne detection was used to acquire the echo with the sampling rate of 100 MHz. The complex sampling rate was only 10% of the transmitted signal bandwidth. The received SNR was 10 dB.
For the sampled echo reflected from a single targets examined in isolation, the time–frequency map are shown in . It can be observed that the frequency is folded by 10 times.
Figure 4. Phase and frequency behavior of the sampled chirp. (a) Phase with samples, (b) Frequency with samples.
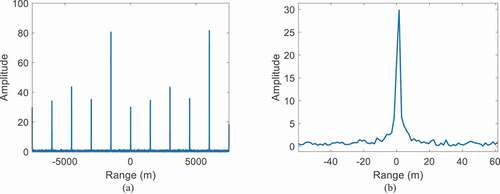
By employing the traditional match filter in our previous work (Li et al. Citation2017), the compressed range image was obtained as shown in . Nine ghost images can be observed. The ghost images are caused by the spectrum aliasing as the sampling rate is only 10% of the signal bandwidth. shows the enlarged view of target image with the highest intensity. Obviously, the three targets cannot be resolved effectively.
Figure 5. Range compressed image obtained by the traditional match filter. (a) Output of match filter, (b) local zoom in view.
By using the two proposed methods, the echo data were properly processed and the results are demonstrated in , respectively.
Figure 6. Range compressed image obtained by short-time deramping method. (a) Range image without ghost. (b) Enlarged view of the targets image. (c) The dB scaled range profile after proper interpolation.
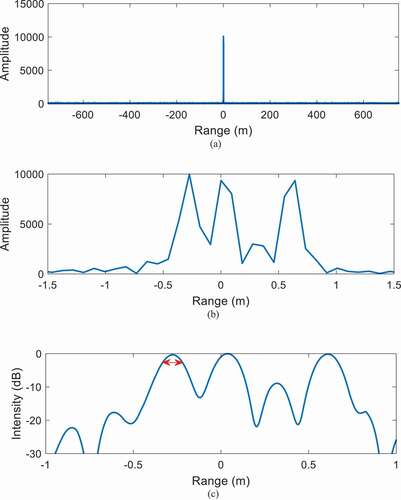
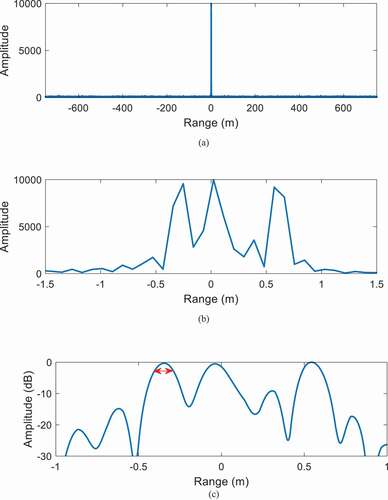
Figure 7. Range compressed image obtained by SPECAN de-aliasing method. (a) Range image without ghost. (b) Enlarged view of the targets image. (c) The dB scaled range profile after proper interpolation.
From , the range compressed image is obtained. In ), ghost images are eliminated. ) shows the enlarged view of the targets image. The designed three targets are resolved clearly. After the proper interpolation, the measured distances between the adjacent targets are 30.2 cm and 60.7 cm as in ), respectively. The range resolution can be calculated by the 3-dB range profile of the target in the right edge. The 3-dB resolution is 12.7 cm in ), which is in accord with the theoretic resolution corresponding to the 1 GHz bandwidth.
The processing result by the SPECAN de-aliasing method is shown in . From , the range compressed image without ghost was also obtained and the three targets were resolved clearly. The measured distances between adjacent targets are 30.6 cm and 59.3 cm, which is in accord with the real setting. From ), the 3-dB resolution of the range profile is 11.9 cm. The range resolution commensurate with the transmitted ladar bandwidth of 1 GHz.
6.2 Real data validation
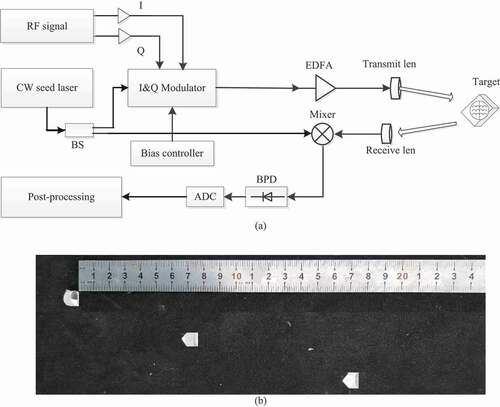
In order to verify the effectiveness of the proposed methods in the practical situations, a FMCW-ladar system was set up as shown in the ). The modulator is for the generation of the large bandwidth FMCW ladar, which has been discussed in our previous work (Li et al. Citation2017). The modulated signal was sent to the erbium-doped fiber amplifier (EDFA) for transmitting to the targets. Different from the traditional FMCW-ladar system, the local oscillator (LO) here was of single-frequency from the seed laser. In the receiver, the received echo and the LO were mixed, and the heterodyne signal was obtained. After the balanced photodetectors, echo data were sampled by the analog-to-digital converter (ADC). The modulated signal bandwidth was 10 GHz, the pulse duration was 100 , and the ADC rate was 1 GHz. Three corner cubes were located about 75 m away from the ladar system. From ), the relative distances between adjacent cubes are about 7.5 cm and 10 cm.
Figure 8. Real data experiment setting. (a) The system. (b) The targets.
For the collected real data, the post-processing was performed by employing the proposed algorithms. The reference delay time in EquationEquation (7)(7)
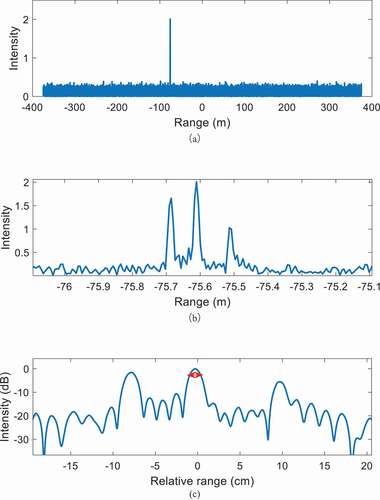
(7) was zero in the processing. shows the obtained result. From the figure, the unambiguous compressed range image was obtained and the three cubes can be resolved clearly. The measured distance between the targets and the ladar system is about 75.6 m. In ), the measured relative distances are 7.43 cm and 9.78 cm, respectively. The result is in agreement with the real targets setting in ). The resolution is analyzed in , and the 3-dB width is about 1.375 cm. For the transmitted ladar signal with bandwidth of 10 GHz, the theoretic 3-dB resolution is about 1.33 cm. The measured resolution is almost the same as the theoretic one.
Figure 9. Result of the real data experiment. (a) Range image without ghost. (b) Enlarged view of the targets image. (c) The dB scaled range profile after proper interpolation.
7. Conclusion
In conclusion, the manuscript proposed a novel scheme and developed two methods to process the FMCW-ladar data acquired with sub-Nyquist sampling rate. By use of the proposed algorithms, the novel FMCW-ladar system can work effectively without use of the dechirp detection while using the same sampling rate as that in the dechirp detection. Simulation and real data experiment validated the effectiveness of the proposed algorithms. The manuscript provides an alternative scheme for the FMCW-ladar system when the dechirp detection is not suitable. Also, the proposed algorithm benefits the microwave photonic radar for avoiding the dechirp detection.
Disclosure statement
No potential conflict of interest was reported by the author(s).
Data availability statement
The data that support the findings of this study are available on reasonable request from the corresponding author.
Additional information
Notes on contributors
Sujuan Fang
Sujuan Fang is a visiting professor in the School of Electronic Information and Electrical Engineering, Shanghai Jiao Tong University. Her research interest includes remote sensing, SAR imaging, advanced SAR system and remote sensing.
Guangzuo Li
Guangzuo Li is a researcher in the Aerospace Information Research Institute, Chinese Academy of Sciences (AIR-CAS). His research interest includes radar signal processing, ladar signal processing and SAR imaging.
Fei Zhang
Fei Zhang is a researcher in the School of Electronic Information and Electrical Engineering, Shanghai Jiao Tong University. His research interest includes radar signal processing and SAR imaging.
Bing Han
Bing Han is a professor in the Aerospace Information Research Institute, Chinese Academy of Sciences (AIR-CAS). Her research interest includes radar signal processing, high resolution SAR imaging.
Wen Hong
Wen Hong is a professor in the Aerospace Information Research Institute, Chinese Academy of Sciences (AIR-CAS). Her research interest includes advanced SAR system, radar signal processing.
References
- Bamler, R. 1994. “A Comparison of Range-Doppler and Wavenumber Domain SAR Focusing Algorithm.” IEEE Transactions on Geoscience and Remote Sensing 30 (4): 706–713. doi:10.1109/36.158864.
- Barber, Z.W., and J.R. Dahl. 2014. “Synthetic Aperture Ladar Imaging Demonstrations and Information at Very Low Return Levels.” Applied Optic 53 (7): 5531–5537. doi:10.1364/AO.53.005531.
- Barber, Z.W., J.R. Dahl, T.L. Sharpe, and B.I. Erkmen. 2013. “Shot Noise Statistics and Information Theory of Sensitivity Limits in Frequency-Modulated Continuous-Wave Ladar.” Journal of the Optical Society of America A Optics Image Science & Vision 30 (7): 1335–1341. doi:10.1364/JOSAA.30.001335.
- Beck, S.M., J.R. Buck, W.F. Buell, R.P. Dickinson, D.A. Kozlowski, N.J. Marechal, and T.J. Wright. 2005. “Synthetic-Aperture Imaging Laser Radar: Laboratory Demonstration and Signal Processing.” Applied Optics 44 (35): 7621–7629. doi:10.1364/AO.44.007621.
- Gao, S., O.S. Maurice, and H. Rongqing. 2012. “Complex-Optical-Field LiDAR System for Range and Vector Velocity Measurement.” Optics Express 20 (23): 25867–25875. doi:10.1364/OE.20.025867.
- Gao, S., and R. Hui. 2012. “Frequency-Modulated Continuous-Wave LiDAR Using I∕Q Modulator for Simplified Heterodyne Detection.” Optics Letters 37 (11): 2022–2024. doi:10.1364/OL.37.002022.
- Hu, Y., L. Guo, X. Dong, and S. Xu. 2018. “Overlapping Laser Micro-Doppler Feature Extraction and Separation of Weak Vibration Targets.” IEEE Geoscience and Remote Sensing Letters 15 (6): 952–956. doi:10.1109/LGRS.2018.2817127.
- Jakowatz, C.V., D.E. Wahl, P.H. Eichel, D.C. Ghiglia, and P.A. Thompson. 1996. “Spotlight-Mode Synthetic Aperture Radar: A Signal Processing Approach.” In Kluwer Academic Publishers101 Philip Drive Assinippi Park (pp. 32-37). Norwell, MAUnited States.
- Karlsson, C.J., and F.Å.A. Olsson. 1999. “Linearization of the Frequency Sweep of a Frequency-Modulated Continuous Wave Semiconductor Laser Radar and the Resulting Ranging Perfor mance.” Applied Optics 38 (15): 3376–3386. doi:10.1364/AO.38.003376.
- Klotz, M.J., M.J. Halmos, and J.-P. Bulot. 2013. “Range Resolved Vibration Using Large Time-Bandwidth Product LADAR Waveforms.” European Patent Application 19.06.2013 Bulletin 2013/25 EP 2 605 040 A1.
- Lanari, R., M. Tesauro, E. Sansosti, and G. Fornaro. 2001. “Spotlight SAR Data Focusing Based on a Two-Step Processing Approach.” IEEE Transactions on Geoscience and Remote Sensing 39 (9): 1993–2004. doi:10.1109/36.951090.
- Li, G.Z., D. Mo, N. Wang, et al. 2018. “A Novel Coherent Ladar System with High Repetition Frequency and Wide Bandwidth.” Journal of Electronics & Information Technology 40 (3): 525–531. doi:10.11999/JEIT170479.
- Li, G.Z., R. Wang, N. Wang, Q.Z. Song, Y. Wu, and J. Pan. 2017. “Linear Frequency-Modulated Continuous-Wave Ladar System for Synthetic Aperture Imaging.” Applied Optics 56 (12): 3257–3262. doi:10.1364/AO.56.003257.
- Meta, A., P. Hoogeboom, and L.P. Ligthart. 2007. “Signal Processing for FMCW SAR.” IEEE Transactions on Geoscience and Remote Sensing 45 (11): 3519–3532. doi:10.1109/TGRS.2007.906140.
- Mottet, A., and B. Nicolas. 2016. “Tunable Frequency Shifter Based on LiNbO3-I&Q Modulators.” Pthotline Delivering Modulation Solutions. doi:10.1364/COTA.2006.CFC3.
- Oppenheim, A.V., and R.W. Schafer, Buck, J. R. 1999. “Discrete-Time Signal Processing, 78–88.” Englewood Cliffs, NJ: Prentice-Hall: . . . https://ocw.mit.edu
- Raney, R., H. Runge, R. Bamler, I. Cumming, and F. Wong. 1994. “Precision SAR Processing Using Chirp Scaling.” IEEE Transactions on Geoscience and Remote Sensing 32 (4): 768–799. doi:10.1109/36.298008.
- Salas, E.A.L. 2021. “Waveform LiDAR Concepts and Applications for Potential Vegetation Phen ology Monitoring and Modeling: A Compre hensive Review.” Geo-spatial Information Science 24 (2): 179–200. doi:10.1080/10095020.2020.1761763.