
 ?Mathematical formulae have been encoded as MathML and are displayed in this HTML version using MathJax in order to improve their display. Uncheck the box to turn MathJax off. This feature requires Javascript. Click on a formula to zoom.
ABSTRACT
Most countries and territories worldwide are affected by coronavirus disease 2019 (COVID-19), and some cities have become known as epicenters owing to high outbreaks. Because of the changeable and unknown nature of the virus, managers of different cities could learn from the experiences of cities that have been successful in controlling COVID-19 instead of wasting time exploring different methods. It would be even more beneficial if they analyzed the experiences of similar cities. The similarity of such cities could be examined within a geographic information system based on various criteria. This study investigated the similarities among eight cities – Wuhan, Tehran, Bergamo, Madrid, Paris, Daegu, New York, and Berlin – in terms of the COVID-19 situation (target) in these locations based on proximity factors, weather, and demographic criteria. First, the factor and target layers were prepared, and then similar cities were identified using a similarity model and different distance metrics. The results were aggregated using the Copeland method because of the different outcomes for each metric. The most similar city was identified for each selected city, and its similarity level was determined based on these criteria. The results suggested the following pairs of similar cities: Wuhan–Berlin, Tehran–Berlin, Daegu–Wuhan, Bergamo–Madrid, Paris–Madrid, and New York–Paris based on COVID-19 related data up to 15 April 2020 (target T1), and Daegu–Wuhan, Tehran–Madrid, Bergamo–Paris, Berlin–Paris, and New York–Madrid up to 8 December 2021 (target T2) with a minimum and maximum similarity rate of 82.85% and 92.36%, respectively. For similar cities, the most similar factors among the proximity criteria are the distance from bus and metro stations; among weather, the criteria are humidity and pressure; and among demographics, the criteria are male and female population ratios, literacy ratio, and death ratio from asthma and cancer, with a minimum and maximum difference of 0% and 64.94%, respectively. In addition, according to the random forests ranking results (with root mean squared error = 0.23), temperature, distance from the bank, and gender were the most important criteria for the eight studied cities. Identifying these important factors helps to determine hotspots or places of future outbreaks to choose control strategies according to the cultural and ecological conditions of each city.
1. Introduction
Coronavirus disease 2019 (COVID-19) is a global health concern owing to its rapid worldwide spread. More than 450,229,635 confirmed cases and 6,019,085 deaths have been recorded as of 11 March 2022 (WHO Citation2022). COVID-19 was first discovered at the end of 2019 in Wuhan, China, and now affects more than 225 countries (Worldometers Citation2022). Outbreaks of this disease have caused many economic, political, and social problems in different countries. Economic (Belitski et al. Citation2022), cultural (UNESCO Citation2020), social (Yang et al. Citation2021), and human (Gelius et al. Citation2021) activities have also been disrupted. Therefore, it is very important to study the prevalence of this disease, its rate of spread, and its predictability to identify high-risk areas and affective factors (Mollalo, Vahedi, and Rivera Citation2020).
A Geographic Information System (GIS) is an essential computer-based tool for studying the spatial distribution, effective factors, and spatiotemporal distribution of infectious diseases (Mollalo, Vahedi, and Rivera Citation2020; Termeh and Niaraki Citation2015). COVID-19 has caused a notable increase in the number of cases and deaths in many countries such as the United States, Spain, and Italy (WHO Citation2022). Several factors such as age, sex, fever, smoking, and environmental criteria affect the cases and mortality of COVID-19 (Zhou et al. Citation2020). Hence, it is necessary to investigate the factors that influence this rapid increase and discover similarities among the epicenter cities of COVID-19. One of the most important theoretical issues of GIS is spatial similarity, and it is appropriate for classifying objects and solving problems. Spatial problems can be demonstrated by similar geospatial features, and the knowledge derived from these cases can help solve similar problems. By identifying similar cities in terms of COVID-19 prevalence, common effective factors can be detected, and the experience of similar successful cities can be used to better manage the disease.
Although COVID-19 vaccination has begun in many countries, preventing third and fourth waves in different countries and new COVID-19 variants are still major challenges in treating the global epidemic (Akova Citation2021). Therefore, prevention and control of COVID-19 will continue to be an important issue for maintaining public security and achieving sustainable urban development in the future. In this regard, the measurement of the spatial similarity among different cities and spatial entities can provide a basis for spatial problem decision-making and calculation processes. The utilization of managers and decision-makers in each city from the experience of other cities, especially similar cities, in the management of this pandemic is very important (Liao, Hou, and Jiang Citation2019). For example, assume that a pandemic increase is slightly controlled in a city with restrictions on the metro and bus stations. Another city that is very similar to this city (in terms of the disease situation and criteria) can use a similar solution. However, experience does not imply implementing exactly the same solutions. In different cities, the same actions can lead to different results owing to the different socio-ecological aspects of each city. Therefore, for the example mentioned above, the goal of the two similar cities is to control bus and metro stations, which may be achieved in one city by applying local quarantine and in another city by setting various limitations on the number of people in the bus station at one time. These cases can be examined by the managers and decision-makers of each city according to the cultural, political, and social situations.
This study investigated the spatial similarity between Wuhan, Tehran, Bergamo, Madrid, Paris, Daegu, New York, and Berlin based on proximity, weather, demographics, and COVID-19 data. These data include the location of supermarkets, bus stations, metro stations, bakeries, butchers, hospitals, pharmacies, gas stations, and banks; the maximum, minimum, and average temperatures, humidity, pressure, and wind speed; population, male population ratio, female population ratio, middle age dependency ratio, old age dependency ratio, literacy rate, and the World Bank’s income classifications split countries; and the death rate from cancer, air pollution, cardiovascular diseases, asthma, pneumonia, and smoking. The input data were prepared using a fuzzy membership function because of their uncertainty. Similarities among cities were calculated using a similarity model based on six distance metrics (Manhattan, Euclidean, Minkowski, Mahalanobis, Chebyshev, and Correlation). The results were aggregated using the Copeland method because the results of each metric could be different. In terms of the COVID-19 situation, the most similar city was selected for each city, and the similarity among the selected cities was calculated based on proximity, weather, and demographic criteria and was compared based on Ripley’s K-function. For a more accurate comparison, the selected factors of this study were ranked using General Regression Neural Network (GRNN), random forests (RF), and Support Vector Regression (SVR) methods. This comparison was performed in two periods: 15 April 2020 (before the start of vaccination) and 8 December 2021 (after 8,337,664,456 vaccine doses were administered [WHO Citation2021]).
The main contribution of this study is the development of a model that combines fuzzy logic and similarity metrics with different distance formulas for the similarity measurement of COVID-19 epicenters. In this research, important criteria for pairs of similar cities and the entire dataset were identified and ranked separately. Therefore, another innovation of this research is the comparison of important criteria at the level of pairs of cities and whole cities in two time steps (before and after vaccination).
The remainder of this paper is organized as follows. Section 2 presents a literature review in three parts. Section 3 introduces the study area and data, MS small fuzzy membership, similarity metrics, Ripley’s K-function, and methods for ranking the importance of variables. The results of the proposed model and discussions are presented in Sections 4 and 5, respectively. Finally, concluding remarks are presented in Section 6.
2. Literature review
This literature review comprises three parts. The first section describes relevant studies related to similarity measurements in spatial issues. In the second part, the research conducted in the field of methods for determining the importance of variables is reviewed. Third, a few studies in the field of spatial analysis of COVID-19 are investigated.
2.1. Similarity measurement
Spatial similarity can be examined based on location, time, semantics, attributes, topology, and conditions (Liao, Hou, and Jiang Citation2019; Mishra, Gayen, and Haque Citation2020). In many studies, the similarity of trajectories has been considered using the Manhattan and Euclidean distances (Furtado et al. Citation2016; Lehmann, Alvares, and Bogorny Citation2019; Wan, Zhou, and Pei Citation2017). In addition, the time-sequence similarity of spatial objects has been investigated in different studies (Yi, Jagadish, and Faloutsos Citation1998). However, research has been conducted on the similarities between different places and cities. Dobesova (Citation2019) considered the similarity of European cities based on image processing using neural networks. He identified similar cities based on green area patterns, patterns of urban fabrics, and special area forms. The study did not focus on urban facilities or variable data, such as climate. Preotiuc-Pietro, Cranshaw, and Yano (Citation2013) explored venue-based similarity of cities using social network data. They applied three vector-based representation methods to four-square venue data from 17 cities across the United States. Liao, Hou, and Jiang (Citation2019) proposed an approach for spatial data attribute similarity measurements based on a granular computing method. Their proposed model measures the similarity of a spatial entity in the form of a comprehensive index based on the distance and degree of membership. In their study, the similarity among different land uses was calculated based on Manhattan distance, and no comparison was performed among other distance metrics. Previous studies have not focused on measuring the socioeconomic, statistical, and temporal similarities of cities, especially the study of such similarities in pandemics such as COVID-19.
2.2. Variable importance analysis
In recent years, analysis of the most important variables has been the subject of research (Guyon, Elisseeff, and Kaelbling Citation2003). Ben Ishak (Citation2016) assessed SVR and RF for variable importance. The results of the research indicated that SVR and RF are recommended for variable ranking in linear and nonlinear situations, respectively. Gregorutti, Michel, and Saint-Pierre (Citation2015) proposed a group-based variable importance analysis with RF for real-life problems arising from aviation safety. Olden, Joy, and Death (Citation2004) compared nine different methods (connection weights, Garson’s algorithm, partial derivatives, input perturbation, sensitivity analysis, forward stepwise addition, backward stepwise elimination, and improved stepwise) for quantifying variable importance in Artificial Neural Networks (ANNs). Their results showed that the models that use raw input-hidden and hidden-output connection weights in the ANN are favorable methodologies for accurately quantifying variable importance in ecological problems. They emphasized the need to examine the importance of variables and compare different methods.
2.3. Spatial analysis for COVID-19
Several articles provide a review of many scientific papers published from the beginning to the present that used spatial science to study the pandemic (Franch-Pardo et al. Citation2020; Jiang, and de Rijke Citation2021; Ahasan et al. Citation2020; Franch‐pardo et al. Citation2021). Guan et al. (Citation2020) studied data from 1099 patients from 552 hospitals in 30 provinces of China. Based on their findings, over the first two months, COVID-19 spread worldwide with different conditions and symptoms. Lai et al. (Citation2020) studied COVID-19 patient data in countries worldwide up to 11 February 2020, and used graphs and maps to examine their patient numbers and specific symptoms. Numerous studies have been conducted in the field of COVID-19, which are categorized into five general groups (spatiotemporal analysis, health and social geography, environmental variables, data mining, and web-based mapping) (Franch-Pardo et al. Citation2020). In the field of effective parameters, many studies have been conducted in various countries and cities. In these studies, many factors, such as sociodemographic variables (population density, age groups, and diabetes), climate, pollution, population mobility, infrastructure, and health services, have been investigated (Franch‐pardo et al. Citation2021; Ahasan, and Hossain Citation2021; Zhang, Xue, and Jin Citation2020).
Recent studies have shown that the severity and speed of the COVID-19 spread can be affected by multiple factors, such as air pollution (Wu et al. Citation2020), high temperature and humidity (Wang et al. Citation2020; Ma et al. Citation2020), and smoking (Taghizadeh-Hesary, and Akbari Citation2020). Mollalo, Vahedi, and Rivera (Citation2020) used Geographically Weighted Regression (GWR) and multiscale GWR (MGWR) models to investigate the spatial dependence of COVID-19 cases associated with 35 environmental, socioeconomic, topographic, and demographic factors. Zhao et al. (Citation2020) investigated the association between national train transportation and COVID-19 outbreak in China. Their study results suggested a close correlation between the number of COVID-19 cases and number of train journeys. Zhou et al. (Citation2020) studied new challenges of GIS with COVID-19 big data, including huge data acquisition and integration, fast construction of information systems based on big data, spatial and spatiotemporal tracking, and risk assessment and prediction. Sun and Zhai (Citation2020) proposed two additional indicators in the Wells–Riley model with total impairment to forecast the possibility of a virus being present in the air, as well as a 1.6–3.0 m safe social distance. Kaffash Charandabi and Gholami (Citation2021) proposed a model that determines the important periods of each country for use as time series prediction delays and temporal neighborhood steps in spatiotemporal analysis. Griffith and Li (Citation2021) presented two space–time model specifications based on the generalized linear mixed model and the Moran eigenvector space–time filtering to describe the spread of COVID-19 in mainland China and the conterminous USA. The impact of effective environmental and social factors on COVID-19 was not examined in their study. Yahya, Yahya, and Thannoun (Citation2021) developed a model consisting of three ANN functions and a GIS spatial analyst to predict the COVID-19 separation in Iraq. Their research was local, and several parameters, such as age, gender, ethnicity, occupation, preexisting health conditions, and local weather, were not considered.
Zhang and Yuan (Citation2021) analyzed the epidemic risk of COVID-19 using fused data obtained by fusing multi-source big data combined with a logistic regression model and a geo-detector model. Sannigrahi et al. (Citation2020) analyzed the global and local spatial associations among the key sociodemographic variables (income, poverty, and population) and COVID-19 cases and deaths in 31 European countries using the GWR, spatial error model, spatial lag model, ordinary least squares, partial least squares, and principal component regression. In their investigation, the impact of other controlling variables, such as environmental conditions, socio-ecological status, and climatic extremity, was not considered. Dhamodharavadhani and Rathipriya (Citation2021) applied the Radial Basis Function Neural Network (RBFNN), GRNN, and Gaussian process regression to develop the COVID-19 mortality rate prediction model for India. Dharani, Bojja, and Kumari (Citation2021) used linear regression and SVR to predict the total number of COVID-19 cases, active cases, deaths, and cured cases in India. The aim of these studies was to develop a prediction model for COVID-19 data; however, variable importance analysis was not considered. The impact of effective variables, such as meteorological factors, on COVID-19 was investigated in several previous studies (Franch-Pardo et al. Citation2020; Ahasan et al. Citation2020; Franch‐pardo et al. Citation2021), but this comparison was for coronavirus data of a city or country. However, in comparisons among different cities or countries, the number of samples is less than the number of features, and this challenge was not considered.
In addition, previous studies investigated the similarities and differences between the flu and COVID-19, as well as the risk on public transportation, such as buses and metro trains. However, not all of the important proximity, weather, and demographic factors (such as death rates from cardiovascular diseases, asthma, pneumonia, and flu, and distance from metro stations, bus stations, supermarkets, etc.) for multiple cities have been considered in a comprehensive framework, although the possibilities of touching and transmitting are increasing at such locations. In addition, the study of spatial similarities in cities with a high number of confirmed COVID-19 cases and deaths has led to the discovery of common effective factors.
3. Materials and methods
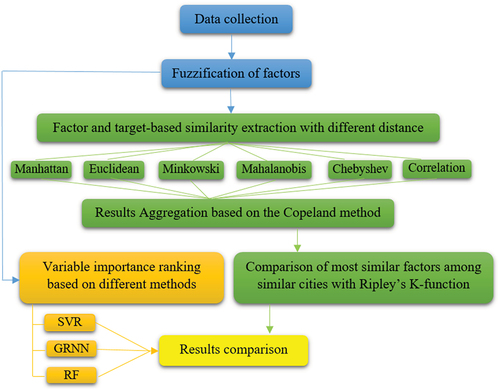
shows a flowchart of the steps followed in this study. It is primarily divided into the extraction of similar cities and variable importance analysis.
Figure 1. Flowchart of the research steps.
3.1. Data collection
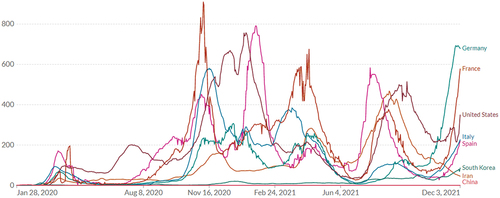
In this study, the following eight cities that had a high number of COVID-19 confirmed cases within a few months after infection were selected: Wuhan (1), Tehran (2), Bergamo (3), Madrid (4), Paris (5), Daegu (6), New York (7), and Berlin (8). Wuhan is the city where the first COVID-19 case was reported, in Hubei province of central China (Lin et al. Citation2020); Daegu is the city where the first large outbreak of COVID-19 outside of China was reported (Kim et al. Citation2020); New York is the first major urban center affected by the COVID-19 pandemic in the USA (Whittle and Diaz-Artiles, Citation2020); and Bergamo is the fourth largest city in the Lombardy region with a high number of COVID-19 cases in Italy (Setti et al. Citation2020). In addition, other epicenters of COVID-19, such as Paris and Madrid, with a high cumulative incidence of COVID-19 (Díaz-Olalla et al. Citation2021); Berlin, with a high influence of socioeconomic variables on case and death rates of the COVID-19 pandemic (Ehlert Citation2020); and Tehran, which is the focal point of Iran’s social and economic activities (the official website of Tehran municipality 2021), were chosen for the study. Daily newly confirmed COVID-19 cases per million people for the countries to which the eight cities belong are shown in .
Figure 2. Daily newly confirmed COVID-19 cases per million people (January 28, 2020–December 3, 2021).
First, the required data were gathered from suitable sources at the city scale. The proximity data for different cities were downloaded from OpenStreetMap (OSM). These data include the locations of supermarkets, bus stations, metro stations, bakeries, butcher shops, hospitals, pharmacies, gas stations, and banks. These criteria were selected because of the possibility of people in these places being close to each other and not maintaining social distance, resulting in the probability of COVID-19 transmission increasing.
Demographic data were collected owing to the impact of sex, age, and medical history on the probability of COVID-19 transmission (UNHCR Citation2020). For example, since the COVID-19 pandemic began, many people who need treatment for diseases such as cancer, cardiovascular disease, and diabetes have not received appropriate health services and are at a higher risk for COVID-19. Demographic data such as population, male population ratio, female population ratio, middle age dependency ratio, old age dependency ratio, literacy rate, World Bank’s income classifications, and death rates from cancer, air pollution, cardiovascular diseases, asthma, pneumonia, and smoking were obtained for the study areas from our world data up to 2017.
Because the severity and speed of COVID-19 emergence can be affected by multiple factors, such as air pressure, high temperature, and humidity, weather data were considered for the epicenter cities (Wang et al. Citation2020; Ma et al. Citation2020). For each city, the maximum, minimum, and average temperatures, humidity, pressure, and wind speed were gathered as weather data for March 2020. The COVID-19 data, including the number of confirmed cases, total deaths, total recovered cases, and transmission speed, were used based on WHO reports up to 15 April 2020 (https://www.who.int/emergencies/diseases/novel-coronavirus-2019/situation-reports) and up to 8 December 2021 (https://www.worldometers.info/coronavirus/). The sample of COVID-19 data used as target data is shown in . The sources of these research data are presented in .
Table 1. COVID-19 data for the study areas.
Table 2. Sources of the research data.
In this study, 43 factors were collected based on nine proximity, four weather, and 12 demographic criteria in different classes. The collected data were stored in a table where the table rows were the names of the cities and the columns were the names of the factors. For each city, the table value represented the number of pixels in each factor. Seven criteria were determined according to county-level and city-level data on COVID-19, seven criteria were determined. Then, according to the eight selected cities, a 43 × 8 table of the factors, a 7 × 8 table of Target 1 (T1) (COVID-19 related data up to 15 April 2020), and a 7 × 8 table of Target 2 (T2) (COVID-19 related data up to 8 December 2021) were created.
3.2. MS small fuzzy membership
The membership function of the fuzzy set is a generalization of the classical set-indicator function. It reflects the degree of truth in fuzzy logic as an extension of valuation. Zadeh (Citation1965) presented membership functions in the seminal study on fuzzy sets. He proposed using a membership function in the domain of all possible values within a range of (0,1). Several fuzzy membership functions were introduced and an MS small membership function was used in the study.
The fuzzy small membership function is utilized when it is more likely that smaller input values are members of the set. The identified midpoint determines the crossover point. Values greater than the midpoint have a lower probability of being a member of the set, and a higher probability of membership for the values under the midpoint. The form and character of the transition zone are determined using the spread parameter. The role of the fuzzy MS small membership is similar to that of the fuzzy small membership. In a fuzzy MS small membership, the mean and standard deviation are defined instead of the midpoint and spread. The fuzzy MS small function may be more applicable than the fuzzy small function if a member of the set is more likely to have very small values (Ziani Citation2017).
3.3. Similarity metrics
Spatial similarity is the similarity among objects on maps or in geospatial space that can show aspects such as location, attribute, direction, distance, geometry, and topology. The more factors that measure similarity, the more complex it becomes (Ding Citation2004). Granular computing-based methods have been used to address this complexity. Granular computing is a modern conceptual method for solving hierarchical issues in the problem-solving process (Liao, Hou, and Jiang Citation2019). This requires knowledge to be granulated first, and there are several methods to do so. In this study, the atomic formula was used to granulate the data; hence, the similarity was calculated according to EquationEquations (1)(1)
(1) –(Equation3
(3)
(3) ) (Liao, Hou, and Jiang Citation2019; Patra, Nandi, and Viswanath Citation2011).
Where p is the vector of input pixels for the p-th city. is the total number of pixels in the p-th city and the
is the i-th attribute, which is examined in this study. Different attributes have many variable values; however, in this study, three levels were investigated based on fuzzy-logic exports.
is the total number of pixels with attribute
at level j, such as the far, medium, and near levels of distance from supermarkets. It is clear that
and
.
and
are the distance and similarity between the p-th and q-th cities, respectively. In addition, r is the total number of pixels for each city and h is the total number of levels for each attribute (Liao, Hou, and Jiang Citation2019; Patra, Nandi, and Viswanath Citation2011).
In EquationEquation (2)(2)
(2) , the value of z determines the distance type. In this research, the Manhattan, Euclidean, Minkowski, Mahalanobis, Chebyshev, and Correlation distances were investigated. The Manhattan, Euclidean, and Minkowski distances were calculated using z = 1, 2, and 3 in EquationEquation (2)
(2)
(2) . The Mahalanobis distance was calculated according to EquationEquation (4)
(4)
(4) , where
is the correlation between the p-th and q-th cities (De Maesschalck, Jouan-Rimbaud, and Massart Citation2000). The Correlation distance was calculated as 1-
and the Chebyshev distance was obtained using
(Abello, Pardalos, and Resende Citation2002).
3.4. Ripley’s K-function
Ripley’s K-function was used to compare the most similar criterion distributions among similar cities. The K-function is a valuable tool for identifying point patterns, such as dispersed, clustered, or distributed patterns in the study area. This function is similar to Moran’s I function, but is capable of describing point patterns at multiple scales defined by users. The K-function is given by EquationEquation (5)(5)
(5) (Mitchell Citation2005).
where d is the distance, n is the total number of points, A is the total area, and kij is the weight. No edge correction occurs; kij = 1 if the distance between i and j is less than d; otherwise, kij = 0 (Mitchell Citation2005).
3.5. Methods for ranking the importance of variables
In modeling and prediction problems, many variable-selection techniques can be applied, such as backward elimination, forward selection, stepwise selection, the profile method, and the weight method. A classic and widely used method for this purpose is the stepwise method (Gevrey, Dimopoulos, and Lek Citation2003). This method consists of adding or rejecting one input variable step by step and noting the effect of the output result on the Mean Squared Error (MSE) (Sung Citation1998). There are two stepwise modeling approaches: forward stepwise (the one-by-one addition of the input variables) and backward stepwise (the one-by-one elimination of the input variables) (Gevrey, Dimopoulos, and Lek Citation2003). These methods can be used in modeling and prediction processes and can be ranked in terms of the importance of different variables. However, in this research, not every modeling method is suitable because the number of samples (cities) is less than the number of features (variables). SVR (Fan et al. Citation2016), GRNN (Zhang et al. Citation2018; Kaffash Charandabi, Gholami, and Abdollahzadeh Bina Citation2022), and RF (Li, Tamang, and Nantasenamat Citation2021) are strong methods for modeling small sample sizes. Therefore, in this study, they were implemented and compared.
4. Results
4.1. Fuzzy modeling
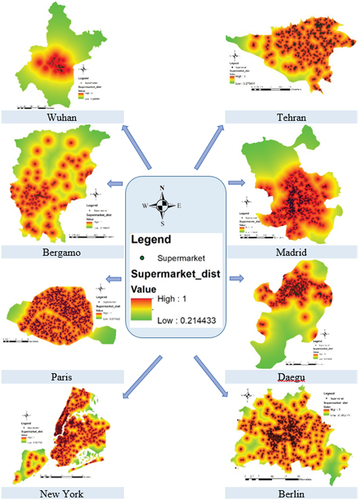
Euclidean distance was used to create distance layers from the selected proximity data. Owing to the uncertainty in the calculation of distances, fuzzy logic was used to prepare them. The MS small membership function was selected for fuzzification because the probability of COVID-19 transmission increased with proximity to these places. Therefore, the prepared criteria were classified into three classes: far, medium, and near. For example, the fuzzified distance layers from supermarkets in shows the number and distribution of supermarkets in the eight study areas. All the fuzzified factor layers were prepared in the same manner. The areas of the cities and number of features in each city differed. To create a 43 × 8 table, for the proximity factors, the number of pixels in each area of each city was divided by the total number of pixels in that city (instead of the feature number, the feature density was considered).
Figure 3. The fuzzified distance layers from supermarkets in the eight study areas.
4.2. Factor and target-based similarity
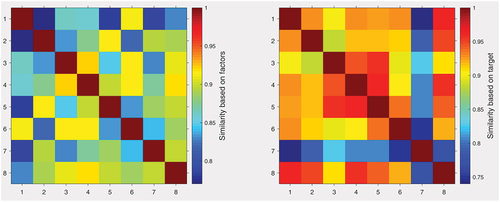
The prepared tables were entered into the similarity model, and the results in were obtained using six distance metrics. Factor- and target (T1)-based similarity are represented by F and T1 in ’s columns, respectively. According to the results obtained for each city, the most similar city was identified in terms of the factors and targets (T1). For instance, for Wuhan, with the Manhattan metric, the most similar cities in terms of factors were Bergamo and Daegu, and in terms of Target (T1), were Berlin and Daegu. According to the Mahalanobis metric, the most similar cities in terms of factors and targets (T1) were New York, Paris, Daegu, and Tehran.
Table 3. Results of the similarity model for the study areas based on six distance metrics.
The results of the Manhattan metric are shown in . The similarity range is 0.7–1, with a similarity measure of one for each city indicating the city itself. For each city, the largest number (less than one) represents the city with the highest similarity.
Figure 4. Results of the similarity model based on factors and target (T1) by the Manhattan distance metric.
4.3. Aggregate results based on the Copeland method
Because of the different results obtained from different distance similarity metrics, the aggregation method must be used to achieve the optimal unique answer. In the Copeland pairwise aggregation process, candidates are categorized by the number of pairwise wins minus the number of pairwise defeats. Based on the Copeland method, the different results in were scored, and the final similar cities were selected. Consequently, for each city, similar cities were obtained using different methods based on several factors.
The score for each city was calculated based on the Copeland method, and the most similar city with the highest score was selected. This procedure was also performed for the targets (T1). The results are presented in . For example, in terms of COVID-19-based targets (T1) for Wuhan, Berlin is the most similar city. Based on the selected factors, the similarity rate between Wuhan and Berlin is 82.88%. The most similar city for Bergamo is Madrid, with 92.36% similarity. Thus, the most similar city was chosen for all the studied cities in terms of coronavirus-based statistics, and the similarity percentages of environmental, climate, and demographic factors were calculated. The selected factors seem appropriate because the highest and lowest factor similarity percentages were 92.36% and 82.85%, respectively.
Table 4. Copeland aggregation results of similarity model for the study areas.
The criteria were examined for all similar cities. The resulting most similar and different criteria are presented in with their percentage differences. A 43 × 8 table of factors was investigated, and the columns with the lowest and highest differences were selected for each similar city. For example, between Wuhan and Berlin, the difference between the maximum humidity is 0.06%, whereas the difference among the numbers of pixels in areas far from bus stations is 64.94%. Therefore, the maximum humidity and areas far from bus stations were selected as the most similar and different factors, respectively. The same was observed for other similar cities; the results are presented in .
Table 5. Most similar and different factors among similar cities based on target T1.
The results show that there is high similarity among the COVID-19-implied cities. Based on the results, the paired cities Wuhan–Berlin, Berlin–Tehran, Daegu–Wuhan, Madrid–Bergamo, Madrid–Paris, and Bergamo–New York are the most similar cities based on COVID-19 data, such as confirmed, recovered, deaths, and speed of COVID-19 spread cases. By analyzing the similarity of cities based on COVID-19 data (T1), the obtained pairs of cities were classified into two groups: Wuhan–Berlin–Tehran–Daegu (first group) and Madrid–Bergamo–Paris and New York (second group). For example, Berlin is the city most similar to Wuhan and Tehran considering the COVID-19 T1 situation. From the 7 × 8 table target (T1) and the similarity index, the difference among these cities was the lowest, and they were selected as the most similar cities. Based on the 43 × 8 table of the factors and similarity metrics, the proximity, weather, and demographic similarities between Wuhan and Berlin and between Tehran and Berlin were 82.88% and 88.96%, respectively.
In like manner, the cities most similar to Madrid were Bergamo and Paris, with similarity rates of 92.36% and 89.70%, respectively. For Daegu and New York, Wuhan and Bergamo were the most similar cities, with similarities of 91.35% and 82.85%, respectively. In terms of the selected factors, the most similar city was often different from the most similar city in terms of the COVID-19 situation (target T1), except for Bergamo and Madrid, which were the most similar in terms of both factors and targets (T1).
The same steps were performed for the features and target T2; the results are shown in . After starting COVID-19 vaccinations and implementing different policies in different countries, some changes were expected in the group of similar cities. Similar cities could be classified into three groups: Wuhan–Daegu (first group), Berlin–Bergamo–Paris (second group), and New York–Madrid–Tehran (third group) based on the COVID-19 T2 situation. According to the results of the case study of this research, wind speed, temperature, humidity, death rate from air pollution, death rate from smoking, female population ratio, and distance from bus stations and banks are the most similar factors based on target T2.
Table 6. Most similar and different factors among similar cities based on target T2.
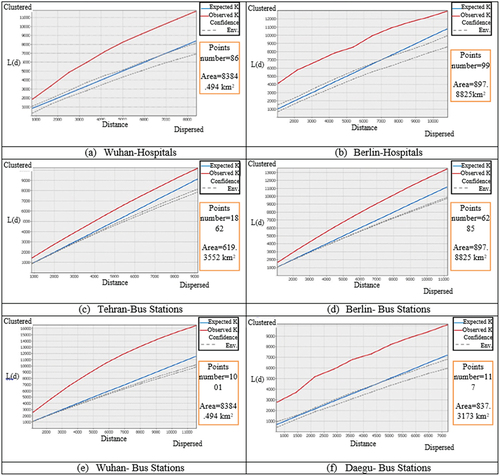
The results of the K-function for the most similar criteria among Wuhan–Berlin, Tehran–Berlin, and Daegu–Wuhan are shown in . For example, show the K-function values for hospital locations in Wuhan and Berlin, respectively. The red, blue, and dashed lines show the observed spatial patterns, expected spatial patterns, and lower-and higher-confidence envelopes, respectively. An observed spatial pattern higher than the expected spatial pattern indicates the existence of statistically significant clusters at different distances. The slope of the red line, the higher value of the red line relative to the blue line, and the distance from it indicate the similarity between plots in terms of the distribution of hospitals and bus stations, which were selected as the most similar criteria. Similar pair-plot properties demonstrate the similarity of the pairs of cities. For 86 hospitals in Wuhan and 99 in Berlin, the K-function ranges were 2000–12,000 and 4000–13,000 respectively, showing a similar pattern of spatial distribution. The details of the area, number of points, distances, and K-function values of other similar cities are shown in .
Figure 5. Results of the K-function for some similar criteria of similar cities.
4.4. Variable importance ranking
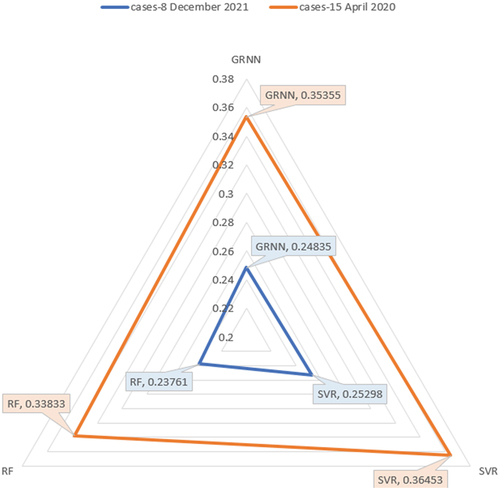
The criteria of this study were ranked for the eight selected cities using the GRNN, SVR, and RF methods. Cross-validation and the Root Mean Squared Error (RMSE) index were used to determine the rank of each criterion. The results of these three methods were prepared for targets T1 and T2 and are shown in . In the figure, the vertical and horizontal axes show the RMSE values and ranked criteria in the order of importance (from right to left), respectively. As can be seen in , the ranking results of the various methods were different. In addition, at two different times, owing to changing conditions and COVID-19 cases, the effective criteria changed. However, in general, wind speed, death rate from air pollution and asthma, gender, age, and distance from banks and pharmacies have been identified as high-ranking criteria in all three methods. The comparison results of the accuracy of GRNN, SVR, and RF for targets T1 and T2 are shown in . Considering that the accuracy of the RF method with RMSE 0.23 is better than that of the other methods, it seems that the ranking of this method is better than that of the other methods. According to the results of the RF method for target T2, temperature, distance from the bank, and gender were more important than the other criteria in this study for the eight selected cities.
Figure 6. Ranking results of the GRNN, RF, and SVR models for targets T1 and T2.
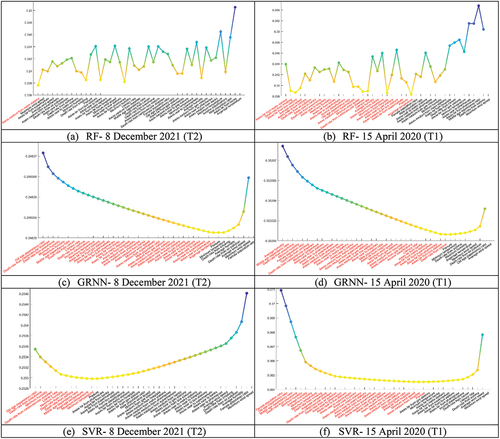
Figure 7. RMSE of the GRNN, RF, and SVR models for targets T1 and T2.
5. Discussion
The COVID-19 pandemic was one of the most significant human problems in 2020. Socioeconomic, temporal, and statistical analyses of this disease were investigated using GIS capabilities in various cities. In this study, based on proximity, weather, and demographic data, the similarities between high-risk cities were examined. For this purpose, a model combining fuzzy logic, similarity index, the Copeland method, and variable importance ranking methods was used. The discussion on the results is divided into two sections: general for everybody and specific for city managers and policymakers.
5.1. For the public
There are several advantages in calculating the similarity index by comparing the proposed model of this study with those of previous studies. The first is a comparison of the various distance metrics used in the granular model. The use of different distance indicators has provided various results. Then, to aggregate the results and find the best among them, the Copeland method was used. In previous research, the similarity index was used for different parts of a city or area. In this study, instead of a local model, a global model was used to compare the similarity of different cities around the world (Liao, Hou, and Jiang Citation2019; Patra, Nandi, and Viswanath Citation2011).
The most different and most similar criteria among similar cities were extracted based on 43 factors and similarity metrics (EquationEquation (2)(2)
(2) ). For similar cities, the most similar factors among the proximity criteria were the distance from bus and metro stations and hospitals; among climatic criteria were humidity, wind speed, and pressure; and among demographic criteria were male and female population ratios, literacy ratio, and death ratio from asthma, smoking, and cancer. These criteria differed very little between the two similar cities. For example, the percentage difference between the number and distribution of metro and bus stations by area is approximately 4% for Tehran and Berlin. For these two cities, the most similar criteria were areas near bus stations, and the most different criteria were areas close to the butchers, with a difference of 0.13% and 43.17%, respectively. The most similar and different criteria for Madrid and Bergamo are the maximum humidity and areas away from pharmacies, with a difference of 0% and 20.8%, respectively.
There was no similarity among similar cities in the second group in terms of distance from bus stations (in three classes: close, medium, and far distance), whereas this similarity was high for the first group. According to previous research, relative humidity (Wu et al. Citation2020) and wind speed (Rendana Citation2020) are negatively related to daily new cases and deaths of COVID-19. According to the results of this study, pairs of similar cities (Wuhan–Berlin and Madrid–Bergamo) were very similar in terms of maximum humidity. For epicenters such as Berlin and Wuhan, the most similar factor was the distance from hospitals. According to previous studies, their success story has been proven, and they have appropriate healthcare services in the area of COVID-19 control (Xiong et al. Citation2020; Wieler, Rexroth, and Gottschalk Citation2020). Meanwhile, Ripley’s K-function was calculated for each city for proximity factors, such as distance from bus stations and hospitals, and the results showed significant similarity of these factors in pairs of similar cities. Wehenkel (Citation2020) showed a direct relationship between COVID-19 deaths, flu vaccination rates, and age. These two criteria were also considered in this study but were not identified as high similarity factors among similar cities. In the Tehran–Berlin, Bergamo–Madrid, Paris–Madrid, and New York–Bergamo pairs, the ratio of male and female populations was a similar factor and was taken into account in previous studies (Bhopal and Bhopal Citation2020).
Over a select period, the number of cases and infection rate change according to the speed of vaccination and restriction policies of each country. Therefore, the main purpose of this study was to present a model for similarity measurement and variable importance ranking in different cities at different times. This model helps to make better decisions and uses the experience of successful cities to control the pandemic.
5.2. For city managers
Previous studies identified public transportation as a high-risk transportation environment, and careful consideration of mask usage and physical distance is important (Dzisi and Dei Citation2020). In this study, the most similar factor between Tehran–Berlin and Wuhan–Daegu was the distance from the bus stations. For example, the similarity between Tehran and Berlin based on the distances from the bus stations was due to the similarity in the distribution of bus stations and their density in relation to the area of these cities. However, the difference between the distribution and density of bakeries and butchers has made this factor the most dissimilar. This similar or dissimilar number and density could be rooted in the cultural and social habits of the people of those cities in using public transportation or face-to-face shopping.
It is proposed that managers and policymakers in Tehran and Berlin learn from the policies and rules of these cities to improve public transit systems, considering the relative success of Wuhan and Daegu in controlling the disease (Xu et al. Citation2020). The experience of these cities can be used as they applied strategies such as increasing the number of buses, halting long-distance buses, reducing the frequency of bus services, completely disinfecting many times per day, increasing physical distance, and using face masks. It is also advisable for city administrators to control the number of people with smart public transportation cards on each wagon or bus. A significant step in the management of public transportation is to automatically control the opening and closing of passenger doors by restricting the maximum number of people permitted in each lane.
In the case of pandemic diseases such as COVID-19, easy and quick access to medical centers and hospitals is critical because inadequate access to medical services has exacerbated existing social disadvantages even more (Núñez, Sreeganga, and Ramaprasad Citation2021). Therefore, the equitable allocation of hospitals in cities is important. In the pre-crisis phase, urban decision-makers could use GIS techniques to locate new hospitals. The determination of the location, size, and suitable access routes to field hospitals by GIS is also important during the crisis phase (similar to the experience of Wuhan hospital construction in the early days of COVID-19 and California in field hospital deployment). In addition, during the pandemic, medical centers were divided into three categories: COVID-19 diagnostic centers, COVID-19 treatment centers, and other centers, so the allocation of hospitals by considering these three categories separately could be useful, and the managers of pandemic diseases would be notified.
It is useful for epicenter managers to share their experiences with each other through teleconferences to better control the pandemic. In particular, advanced and successful cities in the management of COVID-19 could provide more effective and enforceable solutions to similar cities. However, the cultural and racial disparities in each city must be considered in these recommendations. For example, in terms of distance from bakeries and butchers, there was a 39–44% difference between Tehran and Berlin, which shows the cultural differences among the food habits of the citizens of these cities. In addition, the 64% difference between Wuhan and Berlin in terms of distance from pharmacies is noteworthy; the local managers of these cities should provide good access to pharmacies for people in these cities.
A limitation of this study was a lack of cultural and political data. Some cultural criteria in some cities have increased the number of COVID-19 cases. For example, family and friends parties are a interest of the Iranians, which in some areas led to an increase in COVID-19 cases, but may not be effective in other cities. Furthermore, by adding cultural and political criteria such as how to implement a quarantine law, its time, how to implement social distancing, and fines, similarities can be examined more accurately. Another limitation was unavailability of data for all cities worldwide. Owing to the collection of environmental and demographic data for all cities being time-consuming, eight cities were examined in this study. Further research should complete the required data for all countries and classify cities around the world based on the similarities of their COVID-19 situation.
6. Conclusions
In this study, the similarity indexes among eight cities – Wuhan, Tehran, Bergamo, Madrid, Paris, Daegu, New York, and Berlin – were calculated in terms of the COVID-19 situation. The similarity results were verified using six distance metrics. Then, for pairs of similar cities, similarity indexes were calculated based on proximity, weather, and demographic factors. In general, Wuhan, Berlin, Tehran, and Daegu, with an average factor-based similarity of 86.51%, and Madrid, Bergamo, New York, and Paris, with an average factor-based similarity of 89.32%, were the most similar cities in terms of COVID-19 target T1.
Based on COVID-19 target T2, similar cities were classified into Wuhan–Daegu (with an average factor-based similarity of 89.72%), Berlin–Bergamo–Paris (with an average factor-based similarity of 88.47%), and New York–Madrid–Tehran (with an average factor-based similarity of 82.32%).
These similarities help to better learn and understand these issues. Similarities in GIS can be investigated in the context of proximity, temporal, demographic, and statistical data. Identifying cities with similar COVID-19 conditions will help manage the disease effectively. Furthermore, determining the effective factors among similar cities is a way to identify the effective factors in the transmission of COVID-19. However, studies on COVID-19 and its effective factors are ongoing, and this study can be regarded as a basis for future research in this field. In addition, future studies can use GIS-based multicriteria techniques to generate similarity maps based on multiple criteria (Hasani, Sadeghi-Niaraki, and Jelokhani-Niaraki Citation2015; Jelokhani-Niaraki, and Malczewski Citation2012; Jelokhani-Niaraki, Hajiloo, and Samany Citation2019; Jelokhani-Niaraki Citation2021). The techniques could integrate factors/criteria maps and expert-derived criteria weights relevant to the similarity among the cities to assess the similarity levels. In addition, other factors (such as race/ethnicity and occupation) can be investigated and added to the model.
Consent for publication
All the coauthors consent the publication of this work.
Disclosure statement
No potential conflict of interest was reported by the author(s).
Data availability statement
The data that support the findings of this study are available in the public domain:
Demographic data: (https://ourworldindata.org/)
Weather data: (http://timeanddate.com/)
COVID-19 data: (https://www.who.int/emergencies/diseases/novel-coronavirus-2019/situation-reports)
Proximity data: (https://www.openstreetmap.org/)
Population data: https://worldpopulationreview.com/
COVID-19 data: https://www.worldometers.info/coronavirus/
Additional information
Funding
Notes on contributors
Neda Kaffash Charandabi
Neda Kaffash Charandabi received her PhD degree at K. N. Toosi University of Technology. Now she is an assistant professor at Geomatic Department, Marand Technical Faculty, University of Tabriz. Her research interests are health GIS, ubiquitous GIS, Neural network, machine learning algorithms and applications.
Abolghasem Sadeghi-Niaraki
Abolghasem Sadeghi-Niaraki is an Assistant Professor of Computer Science and Eng. at Artificial Intelligence Center, Sejong University, South Korea. Previously, he was an Assistant Professor at Geo-Informatics Eng. Dept., INHA University, Korea. He received the B.Sc. degree in geomatics Eng. and the M.Sc. degree in geospatial information system (GIS) Eng. from Faculty of Geomatics Eng., K. N. Toosi University of Technology (KNTU), and the PhD degree in Geo-Informatics Eng. from Inha University in 2008. He was a GIS project manager at Ministry of Roads and Urban Development, Tehran. He has a variety of teaching experiences at several universities (KNTU, INHA, and Sejong University). His current research interests include the Geo-AI, XR (MR, VR, AR), Geo-Metaverse, ubiquitous GIS, IoT, culture technology (CT), and indoor localization.
Soo-Mi Choi
Soo-Mi Choi is a Professor of Computer Science and Engineering at Sejong University, Korea and the Director of Mobile Virtual Reality Research Center. She received her BS, MS and PhD degrees in Computer Science and Engineering from Ewha University of Korea in 1993, 1995 and 2001, respectively. She was a visiting researcher of the Fraunhofer Institute for Computer Graphics Research in Germany in 1998. She joined the faculty of Computer Science and Engineering at Sejong University in 2002. From 2008 to 2009 she was a visiting professor at CG Lab of ETH Zurich in Switzerland. Prof. Choi is currently a Vice President of the Korea Computer Graphics Society and a Vice President of the HCI Society of Korea. Her current research interests include virtual and augmented reality, computer graphics, human-computer interaction, and biomedical imaging.
Tamer Abuhmed
Tamer Abuhmed received his PhD degree in information technology and telecommunication engineering from Inha University in 2012. He is currently an assistant professor with the College of Computing and Informatics, Sungkyunkwan University, South Korea. His research interests include information security, expert and decision support systems, and machine learning based systems.
References
- Abello, J. M., P. M. Pardalos, and M. G. Resende. 2002. Handbook of Massive Data Sets. NY: Springer.
- Ahasan, R., M. S. Alam, T. Chakraborty, and M. M. Hossain. 2020. “Applications of GIS and Geospatial Analyses in COVID-19 Research: A Systematic Review.” F1000Research 9: 1379. doi:10.12688/f1000research.27544.1.
- Ahasan, R., and M. M. Hossain. 2021. “Leveraging GIS and Spatial Analysis for Informed Decision-Making in COVID-19 Pandemic.” Health Policy and Technology 10 (1): 7–9. doi:10.1016/j.hlpt.2020.11.009.
- Akova, M. 2021. “COVID-19 Vaccination in the Wake of a Fourth Wave of the Pandemic: An Evidence-Based Strategy is Desperately Needed.” Infectious Diseases and Clinical Microbiology 2: 52–54. doi:10.36519/idcm.2021.82.
- Belitski, M., C. Guenther, A. S. Kritikos, and R. Thurik. 2022. “Economic Effects of the COVID-19 Pandemic on Entrepreneurship and Small Businesses.” Small Business Economics 58: 593–609. doi:10.1007/s11187-021-00544-y.
- Ben Ishak, A. 2016. “Variable Selection Using Support Vector Regression and Random Forests: A Comparative Study.” Intelligent Data Analysis 20 (1): 83–104. doi:10.3233/IDA-150795.
- Bhopal, S. S., and R. Bhopal. 2020. “Sex Differential in COVID-19 Mortality Varies Markedly by Age.” Correspondence 396 (10250): 532–533. doi:10.1016/S0140-6736(20)31748-7.
- De Maesschalck, R., and D. Jouan-Rimbaud, and D. L. Massart. 2000. “The Mahalanobis Distance.” Chemometrics and Intelligent Laboratory Systems 50 (1): 1–18. doi:10.1016/s0169-7439(99)00047-7.
- Dhamodharavadhani, S., and R. Rathipriya. 2021. “COVID-19 Mortality Rate Prediction for India Using Statistical Neural Networks and Gaussian Process Regression Model.” African Health Sciences 21 (1): 194–206. doi:10.4314/ahs.v21i1.26.
- Dharani, N. P., P. Bojja, and P. R. Kumari. 2021. “Evaluation of Performance of an LR and SVR Models to Predict COVID-19 Pandemic.” In Materials Today: Proceedings. doi:10.1016/j.matpr.2021.02.166.
- Díaz-Olalla, J.M., G. Blasco-Novalbos, and I. Valero-Otero. 2021. ”COVID-19 Incidence in Districts of Madrid and Its Relationship with Socio-Economic and Demographic Indicators.” Revista Espanola de Salud Publica 95: e202107091. Spanish. PMID: 34212940.
- Ding, H. 2004. “A study on Spatial Similarity Theory and Calculation Model.” PhD diss., Wuhan University.
- Dobesova, Z. 2019. “The Similarity of European Cities Based on Image Analysis.” Intelligent Systems Applications in Software Engineering 341–348. doi:10.1007/978-3-030-30329-7_31.
- Dzisi, E. K. J., and O. A. Dei. 2020. “Adherence to Social Distancing and Wearing of Masks Within Public Transportation During the COVID 19 Pandemic.” Transportation Research Interdisciplinary Perspectives 7: 100191. doi:10.1016/j.trip.2020.100191.
- Ehlert, A. 2020. “The Socio-Economic Determinants of COVID-19: A Spatial Analysis of German County Level Data.” Socio-Economic Planning Sciences 78: 101083. doi:10.1016/j.seps.2021.101083.
- Fan, G. F., L. L. Peng, W. -C. Hong, and F. Sun. 2016. “Electric Load Forecasting by the SVR Model with Differential Empirical Mode Decomposition and Auto Regression.” Neurocomputing 173 (3): 958–970. doi:10.1016/j.neucom.2015.08.051.
- Franch-Pardo, I., B. M. Napoletano, F. Rosete-Verges, and L. Billa. 2020. “Spatial Analysis and GIS in the Study of COVID-19. A Review.” The Science of the Total Environment 739: 140033. doi:10.1016/j.scitotenv.2020.140033.
- Franch‐pardo, I., and M. R. Desjardins, I. Barea‐navarro, and A. Cerdà. 2021. “A Review of GIS Methodologies to Analyze the Dynamics of COVID‐19 in the Second Half of 2020.” Transactions in GIS 25 (5): 2191–2239. doi:10.1111/tgis.12792.
- Furtado, A. S., and D. Kopanaki, L. O. Alvares, and V. Bogorny. 2016. “Multidimensional Similarity Measuring for Semantic Trajectories.” Transactions in GIS 20 (2): 280–298. doi:10.1111/tgis.12156.
- Gelius, P., A. Tcymbal, S. Whiting, S. Messing, K. Abu-Omar, W. Geidl, A. K. Reimers, et al. 2021. “Impact of the First Wave of COVID-19 on Physical Activity Promotion in the European Union: Results from a Policymaker Survey.” Journal of Physical Activity & Health 18 (12): 1490–1494. doi:10.1123/jpah.2021-0083.
- Gevrey, M., I. Dimopoulos, and S. Lek. 2003. “Review and Comparison of Methods to Study the Contribution of Variables in Artificial Neural Network Models.” Ecological Modelling 160: 249–264. doi:10.1016/S0304-3800(02)00257-0.
- Gregorutti, B., B. Michel, and P. Saint-Pierre. 2015. “Grouped Variable Importance with Random Forests and Application to Multiple Functional Data Analysis.” Computational Statistics & Data Analysis 90 (C): 15–35. doi:10.1016/j.csda.2015.04.002.
- Griffith, D., and B. Li. 2021. “Spatial-Temporal Modeling of Initial COVID-19 Diffusion: The Cases of the Chinese Mainland and Conterminous United States.” Geo-Spatial Information Science 24 (3): 340–362. doi:10.1080/10095020.2021.1937338.
- Guan, W., Z. Ni, Y. Hu, W. Liang, C. Ou, J. He, L. Liu, et al. 2020. “Clinical Characteristics of Coronavirus Disease 2019 in China.” The New England Journal of Medicine 382: 1708–1720. doi:10.1056/NEJMoa2002032.
- Guyon, I., A. Elisseeff, and L. P. Kaelbling. 2003. “An Introduction to Variable and Feature Selection.” Journal of Machine Learning Research 3: 1157–1182. doi:10.1162/153244303322753616.
- Hasani, S., A. Sadeghi-Niaraki, and M. Jelokhani-Niaraki. 2015. “Spatial Data Integration Using Ontology-Based Approach.” The International Archives of Photogrammetry, Remote Sensing and Spatial Information Sciences 40 (1): 293. doi:10.5194/ISPRSARCHIVES-XL-1-W5-293-2015.
- Jelokhani-Niaraki, M., and J. Malczewski. 2012. “A User-Centered Multicriteria Spatial Decision Analysis Model for Participatory Decision Making: An Ontology-Based Approach.” In Proceedings of GSDI, Quebec City, 13.
- Jelokhani-Niaraki, M., F. Hajiloo, and N. N. Samany. 2019. “A Web-Based Public Participation GIS for Assessing the Age-Friendliness of Cities: A Case Study in Tehran, Iran.” Cities 95: 102471. doi:10.1016/j.cities.2019.102471.
- Jelokhani-Niaraki, M. 2021. “Collaborative Spatial Multicriteria Evaluation: A Review and Directions for Future Research.” International Journal of Geographical Information Science 35 (1): 9–42. doi:10.1080/13658816.2020.1776870.
- Jiang, B., and C. de Rijke. 2021. “A Power-Law-Based Approach to Mapping COVID-19 Cases in the United States.” Geo-Spatial Information Science 24 (3): 333–339. doi:10.1080/10095020.2020.1871306.
- Kaffash Charandabi, N., and A. Gholami. 2021. ”COVID-19 Spatiotemporal Hotspots and Prediction Based on Wavelet and Neural Network. COVID-19 Pandemic.” In Geospatial Information, and Community Resilience Global Applications and Lessons. Boca Raton: CRC Press. doi:10.1201/9781003181590.
- Kaffash Charandabi, N., and A. Gholami, and A. Abdollahzadeh Bina. 2022. “Road Accident Risk Prediction Using Generalized Regression Neural Network Optimized with Self-Organizing Map.” Neural Computing & Applications 34: 8511–8524. doi:10.1007/s00521-021-06549-8.
- Kim, J.H., J.A. An, P.K. Min, A. Bitton, and A.A. Gawande. 2020. “How South Korea Responded to the COVID-19 Outbreak in Daegu.” NEJM Catalyst Innovations in Care Delivery.
- Lai, C. C., and T. P. Shih, W. -C. Ko, H. J. Tang, and P. R. Hsueh. 2020. “Severe Acute Respiratory Syndrome Coronavirus 2 (SARS-CoV-2) and Coronavirus Disease-2019 (COVID-19): The Epidemic and the Challenges.” International Journal of Antimicrobial Agents 55 (3): 105924. doi:10.1016/j.ijantimicag.2020.105924.
- Lehmann, A. L., L. O. Alvares, and V. Bogorny. 2019. “SMSM: A Similarity Measure for Trajectory Stops and Moves.” International Journal of Geographical Information Science 1–26. doi:10.1080/13658816.2019.1605074.
- Li, H., T. Tamang, and C. Nantasenamat. 2021. “Toward Insights on Antimicrobial Selectivity of Host Defense Peptides via Machine Learning Model Interpretation.” Genomics 113 (6): 3851–3863. doi:10.1016/j.ygeno.2021.08.023.
- Liao, W., D. Hou, and W. Jiang. 2019. “An Approach for a Spatial Data Attribute Similarity Measure Based on Granular Computing Closeness.” Applied Sciences 9 (13): 2628. doi:10.3390/app9132628.
- Lin, Y., P. Zhong, and T. Chen. 2020. “Association Between Socioeconomic Factors and the COVID-19 Outbreak in the 39 Well-Developed Cities of China.” Front Public Health 8: 546637. https://doi.org/10.3389/fpubh.2020.546637
- Ma, Y., Y. Zhao, J. Liu, X. He, B. Wang, S. Fu, J. Yan, J. Niu, J. Zhou, and B. Luo. 2020. “Effects of Temperature Variation and Humidity on the Death of COVID-19 in Wuhan, China.” The Science of the Total Environment 724: 138226. doi:10.1016/j.scitotenv.2020.138226.
- Mishra, S. V., A. Gayen, and S. M. Haque. 2020. “COVID-19 and Urban Vulnerability in India.” Habitat International 103: 102230. doi:10.1016/j.habitatint.2020.102230.
- Mitchell, A. 2005. The ESRI Guide to GIS Analysis Volume 2: Spatial Measurements and Statistics. Redlands, CA: Esri Press.
- Mollalo, A., B. Vahedi, and K. M. Rivera. 2020. “GIS-Based Spatial Modeling of COVID-19 Incidence Rate in the Continental United States.” The Science of the Total Environment 728. doi:10.1016/j.scitotenv.2020.138884.
- Núñez, A., S. D. Sreeganga, and A. Ramaprasad. 2021. ““Access to Healthcare During COVID-19”.” International Journal of Environmental Research and Public Health 18 (6): 2980. doi:10.3390/ijerph18062980.
- Olden, J. D., M. K. Joy, and R. G. Death. 2004. “An Accurate Comparison of Methods for Quantifying Variable Importance in Artificial Neural Networks Using Simulated Data.” Ecological Modelling 178 (3–4): 389–397. doi:10.1016/j.ecolmodel.2004.03.013.
- Patra, B. K., S. Nandi, and P. Viswanath. 2011. “A Distance Based Clustering Method for Arbitrary Shaped Clusters in Large Datasets.” Pattern Recognition 44 (12): 2862–2870. doi:10.1016/j.patcog.2011.04.027.
- Preotiuc-Pietro, D., J. Cranshaw, and T. Yano. 2013. “Exploring Venue-Based City-To-City Similarity Measures.” UrbComp 13: Proceedings of the 2nd ACM SIGKDD International Workshop on Urban Computing 16: 1–4. doi:10.1145/2505821.2505832.
- Rendana, M. 2020. “Impact of the Wind Conditions on COVID-19 Pandemic: A New Insight for Direction of the Spread of the Virus.” Urban Climate 34: 100680. doi:10.1016/j.uclim.2020.100680.
- Sannigrahi, S., F. Pilla, B. Basu, A. S. Basu, and A. Molter. 2020. “Examining the Association Between Socio-Demographic Composition and COVID-19 Fatalities in the European Region Using Spatial Regression Approach.” Sustainable Cities and Society 62: 102418. doi:10.1016/j.scs.2020.102418.
- Setti, L., F. Passarini, G. De Gennaro, P. Barbieri, M.G. Perrone, M. Borelli, J. Palmisani, et al.$3$2 2020. “SARS-Cov-2RNA Found on Particulate Matter of Bergamo in Northern Italy: First Evidence.” Environmental Research 188 (109754). doi:10.1016/j.envres.2020.109754.
- Sun, C., and Z. Zhai. 2020. “The Efficacy of Social Distance and Ventilation Effectiveness in Preventing COVID-19 Transmission.” Sustainable Cities and Society 62: 102390. doi:10.1016/j.scs.2020.102390.
- Sung, A. H. 1998. “Ranking Importance of Input Parameters of Neural Networks.” Expert Systems with Applications 15 (3–4): 405–411. doi:10.1016/S0957-4174(98)00041-4.
- Taghizadeh-Hesary, F., and H. Akbari. 2020. “The Powerful Immune System Against Powerful COVID-19: A Hypothesis.” Medical Hypotheses 140: 109762. doi:10.1016/j.mehy.2020.109762.
- Termeh, V. R., and A. S. Niaraki. 2015. “Design and Implementation of Ubiquitous Health System (U-Health) Using Smart-Watch Sensors.” International Archives of the Photogrammetry, Remote Sensing and Spatial Information Sciences- ISPRS Archives 40 (1W5): 607–612. doi:10.5194/isprsarchives-XL-1-W5-607-2015.
- UNESCO. 2020. “Monitoring World Heritage Site Closures.” Accessed 14 June 2020. https://en.unesco.org/covid19/cultureresponse/monitoring-worldheritage-site-closures
- UNHCR (United Nations High Commissioner for Refugees). 2020. “Agd Considerations – Covid-19.” https://data2.unhcr.org/en/documents/download/75295
- Wan, Y., C. Zhou, and T. Pei. 2017. “Semantic-Geographic Trajectory Pattern Mining Based on a New Similarity Measurement.” ISPRS International Journal of Geo-Information 6 (7): 212. doi:10.3390/ijgi6070212.
- Wang, J., K. Tang, K. Feng, X. Lin, L. Weifeng, K. Chen, and F. Wang. 2020. ”High Temperature and High Humidity Reduce the Transmission of COVID-19.” BMJ Open, arXiv:2003.05003. https://ssrn.com/abstract=3551767_2020
- Wehenkel, C. 2020. “Positive Association Between COVID-19 Deaths and Influenza Vaccination Rates in Elderly People Worldwide.” PeerJ 8: e10112. doi:10.7717/peerj.10112.
- Whittle, R.S., and A. Diaz-Artiles. 2020. “An Ecological Study of Socioeconomic Predictors in Detection of COVID-19 Cases Across Neighborhoods in New York City.” BMC Medicine 18: 271. doi:10.1186/s12916-020-01731-6.
- WHO (World Health Organization). 2021. “WHO Coronavirus (COVID-19) Dashboard.” Accessed 8 December 2021. https://covid19.who.int/
- WHO (World Health Organization). 2022. “WHO Coronavirus (COVID-19) Dashboard.” WHO. Accessed 11 March 2022. https://covid19.who.int/
- Wieler, L., U. Rexroth, and R. Gottschalk. 2020. “Emerging Covid-19 Success Story Germany’s Strong Enabling Environment.” Exemplars in Global Health (EGH) platform. https://ourworldindata.org/covid-exemplar-germany
- Worldometers. “Coronavirus Update (Live).” Accessed 11 March 2022. https://www.worldometers.info/coronavirus/
- Wu, X., R. C. Nethery, B. M. Sabath, D. Braun, and F. Dominici. 2020. “Exposure to Air Pollution and COVID-19 Mortality in the United States.” Science Advances 6 (45): eabd4049. doi:10.1126/sciadv.abd4049.
- Wu, Y., W. Jing, J. Liu, Q. Ma, J. Yuan, Y. Wang, M. Du, and M. Liu. 2020. “Effects of Temperature and Humidity on the Daily New Cases and New Deaths of COVID-19 in 166 Countries.” The Science of the Total Environment 729: 139051. doi:10.1016/j.scitotenv.2020.139051.
- Xiong, Y., B. Mi, A. C. Panayi, L. Chen, and G. Liu. 2020. ”Wuhan: The First Post‐covid‐19 Success Story.” The British Journal of Surgery 107 (10): e431–e431. doi:10.1002/bjs.11875.
- Xu, T. L., M. Y. Ao, X. Zh, W. F. Zh, H. Y. Nie, J. H. Fang, X. Sun, B. Zheng, and X. F. Chen. 2020. “China’s Practice to Prevent and Control COVID-19 in the Context of Large Population Movement.” Infectious Diseases of Poverty 9 (1): 115. doi:10.1186/s40249-020-00716-0.
- Yahya, B. M., F. S. Yahya, and R. G. Thannoun. 2021. “COVID-19 Prediction Analysis Using Artificial Intelligence Procedures and GIS Spatial Analyst: A Case Study for Iraq.” Applied Geomatics 13 (3): 481–491. doi:10.1007/s12518-021-00365-4.
- Yang, M., P. He, X. Xu, D. Li, J. Wang, Y. Wang, B. Wang, W. Wang, M. Zhao, and H. Lin. 2021. “Disrupted Rhythms of Life, Work and Entertainment and Their Associations with Psychological Impacts Under the Stress of the COVID-19 Pandemic: A Survey in 5854 Chinese People with Different Sociodemographic Backgrounds.” Plos One 16 (5): e0250770. doi:10.1371/journal.pone.0250770.
- Yi, B. K., H. Jagadish, and C. Faloutsos. 1998. “Efficient Retrieval of Similar Time Sequences Under Time Warping.” In Proceedings 14th International Conference on Data Engineering: IEEE, 201–208 ,Orlando, FL, USA.
- Zadeh, L. A. 1965. “Fuzzy Sets.” Information and Control 8 (3): 338–353. doi:10.1016/S0019-9958(65)90241-X.
- Zhang, Y., S. Na, J. Niu, and B. Jiang. 2018. “The Influencing Factors, Regional Difference and Temporal Variation of Industrial Technology Innovation: Evidence with the FOA-GRNN Model.” Sustainability 10 (2): 187. doi:10.3390/su10010187.
- Zhang, Z., T. Xue, and X. Jin. 2020. “Effects of Meteorological Conditions and Air Pollution on COVID-19 Transmission: Evidence from 219 Chinese Cities.” The Science of the Total Environment 741: 140244. doi:10.1016/j.scitotenv.2020.140244.
- Zhang, J., and X. Yuan. 2021. “COVID-19 Risk Assessment: Contributing to Maintaining Urban Public Health Security and Achieving Sustainable Urban Development.” Sustainability 13 (8): 4208. doi:10.3390/su13084208.
- Zhao, S., Z. Zhuang, J. Ran, J. Lin, G. Yang, L. Yang, and D. He. 2020. “The Association Between Domestic Train Transportation and Novel Coronavirus (2019-nCov) Outbreak in China from 2019 to 2020: A Data-Driven Correlational Report.” Travel Medicine and Infectious Disease 33: 101568. doi:10.1016/j.tmaid.2020.101568.
- Zhou, C., F. Su, T. Pei, A. Zhan, Y. Du, B. Luo, and Z. Cao, J. Wang, W. Yuan, Y. Zhu, C. Song, J. Chen, J. Xu, F. Li, T. Ma, L. Jiang, F. Yan, J. Yi, Y. Hu, Y. Liao, and H. Xiao. 2020. “COVID-19: Challenges to GIS with Big Data.” Geography and Sustainability 1 (1): 77–87. doi:10.1016/j.geosus.2020.03.005.
- Zhou, F., T. Yu, and R. Du, G. Fan, Y. Liu, Z. Liu, J. Xiang, et al. 2020. ”Clinical Course and Risk Factors for Mortality of Adult Inpatients with COVID-19 in Wuhan, China: A Retrospective Cohort Study.” The Lancet 395 (10229): 1054–1062. doi:10.1016/s0140-6736(20)30566-3.
- Ziani, S. 2017. “Time-Varying Fuzzy Sets Based on Gaussian Membership Functions for Developing Fuzzy Controller.” Iranian Journal of Fuzzy Systems 14 (3): 15–39.