
 ?Mathematical formulae have been encoded as MathML and are displayed in this HTML version using MathJax in order to improve their display. Uncheck the box to turn MathJax off. This feature requires Javascript. Click on a formula to zoom.
ABSTRACT
As a special branch of global trade, the trade of agricultural products has an important impact on food security and the environment. In this paper, we studied international trade network of agricultural products from 2000 to 2016 as a whole and in part. We explored the overall characteristics of the network, analyzed the evolution of communities and identified core countries of the communities. The results show that the structure of the trade network became increasingly complex and the trade relations became closer over time. There were four major communities in the network, whose primary core countries were Germany, the United States, Brazil, and China. Since 2007, the community represented by China has disappeared, and the community pattern of the network has been in a three-pillar state and basically stable. We discuss the actual roles of certain trading countries, the formation of communities and the impact of economic events on agricultural products trade. This paper reveals the underlying patterns of the agricultural products trade and provides a way to track its evolution over time.
1. Introduction
Agricultural products are the basis for human survival. The free trade of agricultural products results in the redistribution of agricultural resources on a global scale, forming important links between areas that are rich and scarce in agricultural resources throughout the world (Huang, von Lampe, and van Tongeren Citation2011). However, the international trade of agricultural products is a very sensitive, complicated and special problem. Its particularities mainly result from the industrial and product characteristics of agricultural products as well as the specifics of agricultural policies (Dela Torre, Gao, and Macinnis-Ng Citation2021; Zhou and Ismaeel Citation2021). Therefore, our research focuses on agricultural products.
The trade of agricultural products is an important subset of global trade and has significant implications for both food security and energy safety. The trade flows in agricultural products reflect relations among countries and can naturally be represented as a network in which countries are the nodes and trade relationships are the connecting edges, forming a complex system of exchanges that affects all of the associated countries (Piccardi and Tajoli Citation2012). Moreover, in the international trade of agricultural products, some countries are closely related and prone to forming communities or clusters. Therefore, we can use complex network theory to study the agricultural products trade network. Complex network theory is a comprehensive theory of the formation mechanism, geometric properties and evolution of networks (Brond Citation2018; Newman Citation2003). It can not only identify the relevant characteristics and evolution of trade networks but also reveal the inherent community structure in the networks and reflect the relative importance of different economies, facilitating a more accurate and effective analysis of the trade patterns of agricultural products.
In recent years, a large number of studies have applied complex network theory to analyze agricultural products trade, and significant achievements have been reported in some aspects, such as the characteristics of the agricultural products trade network (Ercsey-Ravasz et al. Citation2012; Qiang et al. Citation2020), competitive relationships in agricultural products trade (Dong et al. Citation2018; Liu, Xu, and Zhang Citation2020), the virtual water network related to agricultural products (Dalin et al. Citation2012), and the identification of community structures for specific agricultural products (Torreggiani et al. Citation2018). However, the evolution of communities and their core countries in the international trade network of agricultural products still needs further exploration to elucidate the underlying trade patterns.
This study aims to provide a better understanding of the structure and evolution of international trade network for agricultural products. We first studied the statistical characteristics and topological properties of the trade network from 2000 to 2016, including the average in-degree, clustering coefficient, average path length, and number of unreachable pairs. Then, we detected the inherent community structure in the network by means of the fast-unfolding algorithm and introduced a new approach for tracking its evolution. Moreover, a comparative analysis was performed on the communities from the perspectives of core countries, community scale, and stability. Finally, we discussed the actual roles of certain trading countries, the formation of communities and the impact of economic events on the agricultural products trade.
Our contributions are as follows. First, we conducted an integral and partial analysis of the worldwide trade of agricultural products over 17 years (rather than considering a shorter period), thus revealing many new features that are different from those of other types of trade in terms of topology and dynamics. Second, there is little research on the relative importance and interactions of the countries involved in the trade of agricultural products. By comprehensively considering the global indices and local properties of nodes, we applied Principal Component Analysis (PCA)-entropy method to rank countries in terms of importance and influence, which can be an accurate and effective way. In addition, we introduced a new approach for matching communities that is based on the match function, the antecedent and consequent of community and community cores. Then, we captured the changes that occurred to communities and identified the events pertaining to them.
The rest of the paper is organized as follows. The related works are reviewed in Section 2. In Section 3, the data sources, network model and methods are introduced. Section 4 describes the experimental results and analyzes the agricultural products trade network. Section 5 discusses the results from three perspectives. Finally, the conclusions are presented in the last section.
2. Literature review
2.1. Agricultural products trade network
In recent years, an increasing number of scholars have used complex network theory to study agricultural products trade issues. Most previous researches have employed network analysis to study the statistical properties of the agricultural products trade network and examine how the network evolves over time. Qiang et al. (Citation2020) constructed international agricultural trade networks weighted by trade quantity and monetary value, compared the differences in the two kinds of networks, and analyzed the main network characteristics. Ercsey-Ravasz et al. (Citation2012) explored the structure and dynamics of international agricultural trade network during 1998–2008. Shutters, Muneepeerakul, and Huerta-Quintanilla (Citation2012) applied triadic network analysis to the international trade network of agricultural products. Xanat et al. (Citation2018) examined the international trade of a variety of genetically modified food products. Lin, Dang, and Konar (Citation2014) discussed domestic food flows within the United States.
In addition, some studies have begun to detect the communities in the agricultural products trade network. Community analysis can reflect trade patterns more clearly and intuitively (Serrano and Boguna Citation2003). For example, Torreggiani et al. (Citation2018) constructed the international food-trade multilayer network in which each layer represented bilateral trade among countries for a specific commodity, and detected a multilayer community structure, explaining the probability that any two countries are co-present in the same community. Furthermore, agricultural products trade issues can be analyzed from the perspective of competition. Dong et al. (Citation2018) considered global competitive relationships in wheat trade. Liu, Xu, and Zhang (Citation2020) investigated the evolution of international agricultural trade competitiveness and complementarity networks along the Belt and Road. Additionally, some studies have focused on the virtual water network related to agricultural products. Dalin et al. (Citation2012) analyzed the evolution of the virtual water trade network from 1986 to 2007 and linked it to trade policies, socioeconomic circumstances, and agricultural efficiency. Chen et al. (Citation2018a) expounded on the global land-water nexus by simultaneously tracking agricultural land and freshwater use flows along global supply chains.
2.2. Detection methods
The detection of community evolution, that is, the changes in community structures over time, can be used to identify the underlying behavior of networks. There are two common ways to analyze community evolution. One is the two-stage method. First, the communities are discovered independently for each time-step network, and then, different time-step communities are compared to identify their evolution. The other is to find a continuously evolving community structure, in which community mining at a specific time is influenced by previously detected communities. In recent years, some scholars have proposed new methods of community detection and evolution. Liu et al. (Citation2015) proposed a fast incremental community evolution tracking framework. Ahuja and Singh (Citation2018) proposed a multi-objective community detection method using a new optimization algorithm that considers the graph structure and the content associated with the nodes.
Identifying the important nodes in the complex network is the focus of many researchers. The importance of nodes can be a combination of node influence, status, or other factors. Currently, the importance ranking of nodes based on network structure is mainly performed from four perspectives: local attributes, global attributes, location in the network, and random walk (Liu et al. Citation2013). The ranking indicators based on the local attributes of a network mainly consider the information of each node and its neighbors. Degree centrality is a typical local property of a node. Some ranking indices primarily consider the global information of the network, such as closeness centrality, betweenness centrality, and eigenvector centrality. Zhong et al. (Citation2018) presented a new eigen-centrality method to identify node influence. Indices of the third type are based on network location attributes. Kitsak et al. (Citation2010) first proposed the idea that the importance of a node depends on its position in the whole network, and obtained a node importance ranking index (k-shell) using k-kernel decomposition. Importance ranking based on the random walk method is mainly used for linking relationships between webpages. A link relationship can be interpreted as mutual correlation and support between webpages; thus, the importance of webpages can be judged on this basis. Typical methods include the PageRank, LeaderRank and HITS algorithms. Liu et al. (Citation2015) used a modified weighted PageRank algorithm to select the top-N most important nodes. In addition to the four types of methods described above, the importance of nodes can also be measured from other perspectives (Chen Y Citation2003, Chen D Citation2012; Ren et al. Citation2014; Tulu, Hou, and Younas Citation2017).
3. Data and methods
3.1. Data
The international trade data of agricultural products were obtained from the website of UN Comtrade and Chatham House Resource Trade Database (http://resourcetrade.earth/), which contains all export and import flows among more than 200 countries and territories worldwide. Chatham House Resource Trade Database reorganizes data around natural resources and amalgamates a variety of HS codes. Among them, agricultural products specifically include cereals, dairy, eggs and honey, fish and aquatic resources, horticulture, live animals, meat, oilseeds, pulses, roots and tubers, rubber and gums, stimulants, tobacco, spices, sugar, water and other agricultural products. This study included annual trade data for all available countries from 2000 to 2016. The “countries” in the text refers to countries and territories. Data of China Hong Kong Special Administerial Region and China Macao Special Administerial Region are listed separately.
3.2. International trade network model
According to complex network theory, the international trade network of agricultural products can be abstracted as a connected network G= (V, E) consisting of nodes V and edges E. We took countries as nodes and the trade relations between countries as edges, forming a complex system of exchanges that affects all participating countries. The directions of the edges are the directions of agricultural products trade flows, and the weights of the edges are the values of agricultural products. The data from one year form a single complex network; therefore, our model consists of a time series of 17 networks.
3.3. Overall network features
The overall features of the trade network are the most direct reflection of trade patterns at the global level. Thus, we analyzed some of the general topological properties of agricultural products trade patterns using various network metrics, including the degree, clustering coefficient and average path length.
In the trade network, the node degree measures how many trade partners each country has, which is an unweighted property. The larger a country’s degree is, the more trade relationships it has. Since our network is directed, we consider two different degrees, i.e. the in-degree and out-degree, which represent the number of incoming and outgoing edges, respectively. The average degree of the network is the average value of degrees of all nodes. Note that the average in-degree value in the network is equal to the average out-degree value.
The clustering coefficient is an attribute representing the probability that adjacent edges of a node are connected. The clustering coefficient of the overall trade network is the average of the clustering coefficients of all nodes. A higher clustering coefficient represents a closer relationship between trade neighbors.
The average path length reflects the transmission performance and efficiency of the trade network and is defined as the average number of steps along the shortest paths for all possible node pairs in the network. The larger the average path length is, the lower the efficiency of trade transmission is.
3.4. Importance of a node
It is of great value in practical applications to explore and evaluate the importance of nodes. Thus, we present a multi-index evaluation algorithm based on PCA-entropy method that synthesizes various structural features of the network, such as in-degree centrality, out-degree centrality, betweenness centrality, incloseness centrality, outcloseness centrality and eigenvector centrality, to reflect the relative importance of nodes.
3.4.1. Centralities
Many centrality measures have been proposed for ranking the nodes in a network. A simple measure is degree centrality, which is a typical local, weighted property of a node. Degree centrality includes in-degree centrality and out-degree centrality. A node with a larger degree centrality is likely to have higher influence and informal power in the network.
Other methods that consider global information, such as closeness centrality, betweenness centrality and eigenvector centrality, may produce different ranking results.
The closeness centrality of node v is defined as the reciprocal of the average distance from v to all other nodes. A higher closeness centrality of a country represents closer connections between it and the rest of the countries in the trade network, indicating that the country’s dependence on other countries is lower.
The betweenness centrality of node v is the frequency of shortest paths passing through node v, and this value quantifies the importance of a node in the overall network architecture. A country with a high betweenness centrality will act as an intermediary in trade between many other countries; additionally, this country will have high market and bargaining power in trade negotiations (Choi, Galeotti, and Goyal Citation2017).
The eigenvector centrality evaluates not only the number of connections a node has but also the importance of adjacent nodes (Gephart and Pace Citation2015). In the world trade network, countries with high eigenvector centralities are those that have substantial trade relationships with many other central countries.
3.4.2. PCA-entropy method
The relative importance of nodes can be evaluated through various centrality measures. However, given the one-sidedness and limitations of using a single centrality measure, the results cannot fully reflect the circumstances of the network. Therefore, we need a multi-index evaluation algorithm to synthesize several centralities.
In this study, we calculated the importance of each node in the network based on PCA-entropy method. PCA is a statistical analysis method that replaces existing multidimensional variables with aggregate variables. These aggregate variables retain as much information as possible about the raw data and are independent of each other (Li et al. Citation2014; Liu, Singleton, and Arribas-Bel Citation2019). The entropy method is an objective weighting method that constructs a judgment matrix for an evaluation index and determines the entropy weight of each index. This method can avoid the influence of subjective factors. The computation steps of PCA-entropy method are as follows: 1) create the evaluating system, 2) apply PCA to solve for the set of principal components of the centrality indices, 3) apply the entropy method to calculate the entropy weights of the principal components, and 4) perform a synthetic evaluation (Wen, Zhang, and Wang Citation2010). The algorithm quantifies the importance of each node through a series of mathematical transformations, and the importance sequences of nodes in the entire network can be established; this method is more rational, accurate, complete and effective than methods using a single index (Jin et al. Citation2012).
3.5. Measurement of communities
Identifying communities is necessary when studying the structure and dynamics of networks. We used a two-stage framework to analyze the community structure. The communities were first detected independently for each time snapshot, and then, we captured the community evolutionary events.
3.5.1. Algorithm for community detection
In the trade network, communities represent clusters of countries. To identify communities, we adopted the fast-unfolding algorithm, which is a community-detection algorithm based on modularity optimization developed by Blondel et al. (Citation2008). The algorithm is based on a variable called the modularity, Q, which measures the density of links within communities compared to the density of links between communities. The greater the value of modularity is, the better the partition will be. It is generally thought that when the value is greater than 0.3, the network has an obvious community structure (Newman Citation2004). Compared to other community-delection algorithms, e.g. CNM algorithm (Clauset, Newman, and Moore Citation2004), fast unfolding algorithm can find high modularity partitions of a network within less time (Clauset, Newman, and Moore Citation2004; Newman Citation2004; Zhong et al. Citation2017). In addition, its steps are intuitive and easy to implement, and the results are unsupervised.
3.5.2. Dynamic evolution of communities
The community structure of the trade network is constantly changing, with communities surviving, forming, dissolving, splitting and merging. In this work, to capture the changes occurring in communities, we combined the match function with the antecedent and consequent of community and core countries. The first two definitions were introduced by Wang (Citation2014). The match matrix is a similarity function that is given as follows:
where represents community i at time t in the network,
represents community j at time t + 1, and
represents community j at time t-1. The more nodes are shared by two adjacent snapshots, the greater the matching value of the communities and the higher the similarity. If
and
have the largest matching value of all communities at time t-1 and
, where
is an empirical value, then
is the antecedent of
, which can be expressed as
. Likewise, if
and
have the largest overlap of all communities at time t + 1 and
, then
is the consequent of
; that is,
.
We assessed the importance of each country in the trade network, which could be represented by a definite value, using PCA-entropy method. Then, we ranked the countries within each community. For example, if M denotes the country with the greatest importance in a community whose comprehensive centrality value is X, then countries with values between X and 97% of X are considered to be core countries of the community. Thus, we could explicitly characterize the core of each community, which could consist of either one country or a group of countries.
The possible types of evolution of communities between different snapshots can be described as follows. Survival: if and only if is the antecedent of
and
is the consequent of
, while
is not the antecedent of any other community,
is not the consequent of any other community, and
and
have broadly the same core countries. Formation: if and only if
does not have an antecedent and the core of the community is also new. Dissolution: if and only if
does not have a consequent. Splitting: k communities
have a common antecedent
. As the community splits, so might the core countries. Merging: k communities
have a common consequent
. As the communities merge, so might the core countries.
A concrete analysis of the concrete conditions is necessary. When analyzing evolutionary events in communities, they should not be confined to adjacent time steps. For example, suppose that does not have an antecedent at time t-1, but there is a community similar to
at time t-2. Then, this community is not newly formed in terms of the whole evolutionary process.
4. Results
4.1. Overall characteristics of the trade network
4.1.1. Statistical properties of the network
From 2000 to 2016, the number of trading countries and territories in the network remained relatively constant, while the number of trade relations gradually increased over time. At the same time, the weights of the connections also increased significantly. This indicates that the structure of the trade network became increasingly complex. The changes in total amount of trade are shown in . The trade volume showed a downward trend in 2009, recovered one year later and then gradually surpassed the original level. In 2015, the volume of trade fell again.
Figure 1. Changes in total trade volume from 2000 to 2016.
4.1.2. General topological properties
The evolution and topological features shown in reveal how the agricultural products trade network dynamically changed with time. shows that the average in-degree continuously increased from 2000 to 2008 and stabilized at approximately 83 during 2010–2015, with an overall upward trend. This suggests that the trading partners of countries were diversifying. For a country, developing agricultural products trade with many countries simultaneously is conducive not only to expanding the development space but also to avoiding the risk of market fluctuations; for the international trade of agricultural products, an expanding world market will make it more competitive.
Figure 2. International trade network characteristics of agricultural products from 2000 to 2016 (a) average in-degree, (b) clustering coefficient, (c) average path length, (d) number of unreachable pairs.
shows the evolution curve of the clustering coefficient of the network from 2000 to 2016. The clustering coefficient varied from 0.72 to 0.76 with little fluctuation. This index showed an overall upward trend and was close to the maximum value of 1. However, the network clustering coefficient notably decreased in 2007, which may have been influenced by related events. Then, from 2010 to 2016, the clustering coefficient continued to increase, indicating that the network was more transitive in trade links and that the global trade partnerships were still very tight.
The evolutions of the average path length and the number of unreachable pairs are shown in , respectively. The trade network had an average shortest path length of approximately 1.7 (with slight fluctuations between 1.66 and 1.75 over time), meaning that any two countries could have a trade relationship with the removal of one middleman, and there was a declining trend, indicating increasing transmission efficiency. The agricultural products trade network was not a fully connected network, meaning that not all countries had direct connections or two countries could be indirectly connected through other countries. The number of unreachable pairs ranged from 470 to 2700, accounting for 0.8%-4.6% of the network node pairs, indicating that a fraction of countries was not integrated into the agricultural products trade network. In addition, the variation in the number of unreachable pairs reflected that the trade relations between some countries were not very stable.
4.2. Structure of communities
The agricultural products trade network has an obvious community structure, and there are much closer relationships and stronger trade dependencies among countries belonging to the same community. In this section, the modularity value and the evolution of communities are applied to analyze the network structure.
4.2.1. Modularity
The idea of modularity optimization was applied to detect the community structure of the trade network. Modularity is one of the most important indicators used to measure the quality of a partition of communities. shows the modularity of the trade network from 2000 to 2016. The modularity value was greater than 0.3, with the exception of very few years, and showed a slight overall increasing trend. This observation indicates that the communities in the network were apparent and that countries tended to establish small groups that enabled them to cooperate with each other (Hou et al. Citation2018). As seen from the line chart, the modularity in 2008 was 0.284, its lowest value. This indicates that the divisions among the communities may be blurred during the financial crisis.
Figure 3. Modularity of the trade network.
4.2.2. Evolution of communities
We identified the evolution of the community structure by considering the match function, the antecedent and consequent of community, and the core countries. To obtain a more intuitive understanding of the community divisions for the agricultural products trade, we created colored world maps, with countries belonging to the same community labeled in the same color. shows the colored world maps depicting the evolution of the trade communities. Some countries and territories are not shown in , because they split up during the study period, or data are not available for some years, etc. Some overseas territories of countries are missing.
Figure 4. Community divisions in the network from 2000 to 2016. shows some countries, territories and islands in the world. China, China Hong Kong SAR, and China Macao SAR have been located in one community except for 2014–2016. Communities that occurred in individual years are not illustrated in the legend.
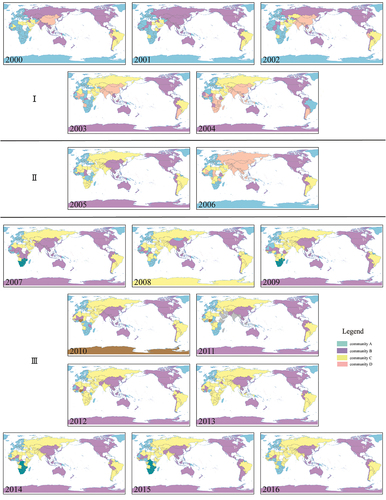
shows that the number of communities involved in the trade of agricultural products varied from 3 to 5. Community A included Germany, France, the Netherlands, Italy, and Spain. The United States, Canada, Mexico, Japan, Australia and other countries belonged to community B. The members of community C included Brazil, Egypt, and Iran. The three communities mentioned above were present over all 17 years. In addition, community D, represented by China, appeared in only some of the years. From , we can observe roughly three stages of community evolution. The first stage was 2000–2004, and the second stage was 2005–2006. From 2007 to 2016, the community pattern of the network was in a three-pillar state and was basically stable.
In the first phase of evolution, four main communities were present, except in 2001. Community D merged into community B in 2001 and then separated again in the following year. From 2002 to 2004, there was no major evolutionary event affecting the communities except for changes in the affiliations of some trading countries. For example, the Russian Federation left community B and joined community C in 2003, and its attribution remained largely stable thereafter. Brazil left community C in 2004 and joined community A temporarily. Additionally, a large number of countries in southern Africa left community A and joined community D in 2004.
The structures of the communities and their member states were relatively unstable during the second stage. In 2005, community D was dissolved, and its members joined different existing communities. Some countries initially in the community represented by China, including Indonesia and Malaysia, merged into community B. In addition, India and some countries in southern Africa and southern South America were incorporated into community C. In 2006, community D reemerged, and countries such as the Russian Federation joined, making the community stronger than it was before.
In 2007, community D was completely dissolved, with nearly 80% of the original members incorporated into community B; these countries included China, which became second to the United States in centrality and influence in community B. A small number of former members, such as the Russian Federation, joined community C. Subsequently, the international trade network of agricultural products was restored to a stable structure, and the pattern was clear. However, a few of the countries in the southern part of Africa notably had unstable affiliations. They either formed a small independent community, represented by South Africa, as in 2007, 2009, 2014, and 2015; belonged to community A, as in 2008, 2010, 2011, and 2016; or belonged to community C, as in 2012 and 2013. Another interesting change in the trade community structure was that community C split into two clusters in 2011. Other small clusters also appeared in certain years.
4.3. Comparative analysis of trading blocs
There were four major communities in the agricultural products trade network, each of which had a small number of large trading countries occupying a central position. We compared and analyzed the features of the different trading blocs by considering the core countries, community scale and stability.
4.3.1. Core countries
By ranking the importance of the nodes, we identified the core of each community, which could be one country or a group of countries. Core countries are countries with obvious centrality and an ability to control the community. shows the core countries for each community (only for years in which the community structure changed significantly).
Table 1. Characteristics for each community.
Germany possessed very stable centrality in community A, and France and the Netherlands reached core status in some years. The core countries of community B usually consisted of the United States. The core of community C was relatively volatile and was generally composed of Brazil and other countries. Because the importance of Brazil was not much higher than that of the rest of the community, it had no absolute leadership. Brazil withdrew from community C in 2004, and the community experienced a leadership change. In 2011, community C split into two clusters: one continued to be led by Brazil, and the other was led by India, Indonesia and Singapore. Later, the two clusters merged again. In 2016, the Netherlands and India improved their positions, surpassing the original most important countries of their communities, Germany and Brazil, respectively. When community D existed, it was mainly led by China.
Overall, only a few countries played key roles in their communities, and these countries were relatively stable, with little change over time. In Africa, agricultural products trade was at a low level overall, and there was no central country in the community.
4.3.2. Community scale and strength
In the agricultural products trade network, the number of countries and the strength varied from community to community. The community scale of the trade network varied substantially, and the distribution was uneven. The average number of countries (over many years) was the same for communities A and B at 80, far exceeding the average number of countries in community C (56). Over time, community A came to contain fewer countries, and the sum of the comprehensive centrality values of the countries in community A declined. The scale and strength of community B fluctuated. The number of countries in community C showed an overall upward trend, and the strength of community C was gradually enhanced. Of the top 10 countries in terms of comprehensive centrality, approximately six were located in community A, and four were located in community B (Ji, Zhang, and Fan Citation2014). The countries in community C ranked relatively low in terms of comprehensive centrality.
4.3.3. Stability of communities
Not all trading countries remained in a given community for a long time. Changes in trade relations between countries led some countries to migrate among communities, and these countries were the main driving force for the evolution of the agricultural products trade pattern.
Each community had some stable countries. Specifically, there were 30 stable countries belonging to community A, such as Germany, France, Italy, the Netherlands, Spain, and the United Kingdom, accounting for 37.5% of the total number of countries in community A (the average over many years). Similarly, there were 21 stable countries in community B, such as the United States, Canada, Mexico, Australia, and Japan, accounting for 26%. Community C was less stable, with the countries that remained unchanged accounting for only 19.6%; even its core country, Brazil, joined community A in 2004.
Among the four main communities, communities A and B were more stable than communities C and D. First, over the 17 years, communities A, B and C were always present, while community D disappeared, reemerged, and then disappeared again. Second, the intra-community structure was more stable in communities A and B in the sense that fewer countries were involved in migration.
5. Discussion and conclusions
5.1. Analysis of the status of major trading countries
We have ranked some countries according to their centrality or criticality in the trade network in . The rankings in terms of the various centrality measures differ significantly. For instance, Japan was ranked 3rd in in-degree centrality and 36th in out-degree centrality in 2004. This disparity justifies the use of several measures of centrality because they capture different characteristics of the network. By synthesizing the centrality indicators, the importance of a country in the agricultural products trade network can be measured more comprehensively and fairly. The statuses and actual roles of some major countries can be analyzed based on imports and exports, centrality measures and their communities.
Table 2. Rankings of certain countries in terms of degree centrality.
Table 3. Rankings of certain countries in terms of closeness centrality.
Table 4. Rankings of certain countries in terms of betweenness and eigenvector centrality.
The United States: Since 2000, the import and export of agricultural products increased year by year, but the export value remained higher than the import value. The United States was the country with the highest out-degree centrality, and it remained stable at the center of the agricultural products trade because of its important export status. The United States ranked first in in-degree and betweenness centrality in 2000–2006 and then declined after 2008. Additionally, the United States basically remained at the core of community B.
China: Over time, China’s central position in the international trade network of agricultural products has gradually strengthened. China was a major importer. China’s ranking in terms of in-degree centrality was higher than that in terms of out-degree centrality. Judging from the overall trend, its rankings in terms of in-degree centrality and eigenvector centrality continued to increase, and after 2008, it surpassed the United States and Japan to rank first. Regarding communities, China was initially the core country of community D. After 2007, community D was dissolved as ties between its members weakened relatively. Later, China joined community B and became one of the core countries in 2013 and 2016 (Chen et al. Citation2018b; Liu et al. Citation2020).
Japan: Japan adopts trade protection policies on agricultural products, and its annual imports are far greater than its exports. Japan was always one of the top two countries in terms of its eigenvector centrality. Overall, the central status of Japan in the agricultural products trade pattern gradually declined, and it was always in community B.
Germany, France and the Netherlands: These three countries are members of the European Union (EU) and are strong in agriculture. The trade connections among them have become increasingly strong, and they also have close ties with other EU members. From 2000 to 2014, exports of agricultural products exceeded imports in France; then, the trade role of the nation changed, with imports overtaking exports in 2016. From a centrality standpoint, Germany ranked highly in in-degree centrality and eigenvector centrality, while France had a higher ranking in terms of in-closeness centrality and the Netherlands had a higher ranking in terms of out-degree centrality. In general, Germany, France and the Netherlands, especially Germany, have been central to community A.
The Russian Federation: Compared with the other countries under discussion, the Russian Federation showed a poor level of agricultural development, and its centrality ranking was relatively low. The scale of the agricultural products trade in the Russian Federation continuously increased during 2000–2014, and then, there was a sharp decline from 2014 to 2016. This pattern could be related to agricultural trade agreements between Russia and the EU (Aller, Ductor, and Herrerias Citation2015). The Russian Federation, formerly in community B, joined community C in 2003.
Brazil: Brazil is a major exporter of agricultural products, mainly to China, the EU, the United States and Japan. After 2008, Brazil ranked second in out-degree centrality, while its values in terms of other centralities were relatively low. Brazil has played an increasingly important role as one of the largest hubs in community C.
5.2. Formation of communities
In complex network analysis, the division of communities depends on the connections between nodes rather than the characteristics of nodes (Piccardi and Tajoli Citation2012). Nodes in the same community are more closely connected. Thus, the formation and evolution of communities in the agricultural products trade network is determined by the trade flows between countries rather than the characteristics of countries, such as economic size and level of development. A country may be more likely to trade with certain other countries, such as members of its regional trade group, geographically close countries, states with a similar degree of development, countries with a common language or religion, or partners that have been historically close (Fagiolo, Reyes, and Schiavo Citation2010; Piccardi and Tajoli Citation2012).
5.2.1. Trade blocs and organizations
The establishment of trade blocs leads to the removal of tariffs and trade volume restrictions among member countries, promoting their trade links. We explored whether global organizations with strong economic influence affected the community distribution of agricultural products trade.
Asia-Pacific Economic Cooperation (APEC): When community D existed (phases I and II), a small number of APEC members, such as China and Malaysia, belonged to community D, whereas most of them were in community B. In 2007–2016 (phase III), almost all member states belonged to community B.
The EU: The trade relationships between the member states of the EU are tight, and they almost exclusively belong to community A, except for individual countries such as Malta, Estonia, Latvia and Lithuania.
The Organization for Economic Co-operation and Development (OECD): There are currently 36 countries in the OECD, but 6 of them, such as Chile and Slovenia, joined the organization during the course of this study. We only analyzed the community distribution of the member states that joined the organization before 2000 (approximately 30). There were 7 countries (Australia, Canada, Japan, Korea, Rep., Mexico, New Zealand, and the United States) in community B, and the remaining 22 countries belonged to community A throughout the study period. Turkey was a special country.
Association of Southeast Asian Nations (ASEAN): The ASEAN member countries mostly belonged to community B throughout the study period. In addition, in 2002, 2003, 2004 and 2011, individual countries, such as Myanmar and Singapore, belonged to other communities.
North American Free Trade Area (NAFTA): The members of NAFTA are the United States, Canada and Mexico, and these three countries all belonged to community B.
From the above analysis, we can see that countries in the same trade organization generally belong to the same community. Trade groups and organizations play an important role in promoting trade links among countries. Countries with close ties and strong dependencies tend to be in the same community. However, the effects of such organizations are limited. For example, the countries of the OECD were divided into two communities during the study period. Therefore, potential trade groups, that is, the community distribution based on actual trade relationships and the volume of trade, are more important.
5.2.2. Geographical distance
In some literature on other types of trade (e.g. integrated or energy trade), most of the communities studied followed certain geographical patterns, generally consisting of an American cluster, a European cluster (sometimes connected to North Africa), and a cluster composed of China, Japan, India, Australia, and so on. These results of community division show strong geographical correlations, which reflect the influence of distance on the trade structure.
However, according to our community division for the trade of agricultural products, the countries of community A were mainly located in Europe, with some in Africa. Community B covered North America, Oceania, and part of Asia, with a few countries in South America and Africa also belonging to community B. Some countries in South America, Africa and Asia belonged to community C, and the countries of community D were concentrated in parts of Asia.
In general, the countries of community A were geographically close to each other, as were the countries of community B. In contrast, the geographical distribution of community C was relatively scattered. In Europe, North America and Oceania, the community composition was relatively single, whereas in South America, Africa and Asia, there was generally more than one community. In part, communities tended to be regionalized, and some countries tended to have trade relations with other geographically close countries, which not only reduces transportation costs but also allows resources to be distributed more efficiently. Overall, the structure of the trade communities for agricultural products was affected by geographical factors, but to a lesser degree than for other products, such as energy.
5.3. Impact of economic events
Different events have different impacts on the international trade of agricultural products. A country’s trade situation, in addition to being affected by its own policies, is related to international markets and the global economy. The food crisis that swept the world in 2007–2008 coincided with the global financial crisis, and within a year, food prices increased sharply in the first half of the year, followed by a sharp decline at the same rate, with this sharp volatility exacerbating poverty and food insecurity.
We can trace a number of relevant economic episodes, such as the food crisis and the financial crisis, and their impacts on the agricultural products trade by changes in descriptive indicators. Regarding the overall trade characteristics, the total trade volume decreased in 2009 and then recovered to exceed the original levels in 2010; the network clustering coefficient decreased significantly in 2007; and the modularity fell to 0.284, its lowest point, in 2008. Regarding the evolution of the trade communities, community D was completely dissolved in 2007, and the old pattern was broken; subsequently, the community pattern of the network remained basically stable in a three-pillar state, with the main core countries of communities A, B and C remaining unchanged (Germany, the United States, and Brazil, respectively). Regarding the centrality, the rankings of the United States in terms of in-degree and betweenness centrality decreased beginning in 2008; China came to rank first in terms of in-degree centrality and eigenvector centrality; and Brazil ranked second in terms of out-degree centrality.
As a necessity for human life, agricultural products, especially grain, have less elasticity than other products. Overall, the global crisis had some impact on the world agricultural products trade, but that impact was slight, and subsequently, growth largely returned to pre-2008 levels. However, the agricultural products trade was affected differently by the crisis in different countries.
6. Conclusions
In this paper, we studied the international trade network of agricultural products from 2000 to 2016 from a complex network perspective. A two-stage analysis method for community-detection and matching was applied and extended. The results showed that the agricultural products trade network contained four major communities, whose main core countries were Germany, the United States, Brazil and China, and there were roughly three stages of community evolution. In phase I (2000–2004) and phase II (2005–2006), four main communities were present, and the affiliations of some trading nations were unstable. In phase III (2007–2016), community D, represented by China, dissolved, and the community pattern of the network was in a three-pillar state. Furthermore, through a comparative analysis of the communities, we can see that the status of the three main communities has been relatively balanced in recent years, with the communities represented by Germany and the United States being more stable. The community distribution based on actual trade relationships and the volume of trade is more referential when making foreign trade policies.
A more fundamental analysis of the agricultural products trade network indicated that the structure of the network became increasingly complex and efficient. Although the trading partners of various countries were diversifying, there was still a fraction of countries that had not yet integrated into the agricultural products trade network. In addition, the modularity showed a slight overall increasing trend, indicating that the divisions among the communities became apparent. The countries should strengthen agricultural products trade cooperation and establish more comprehensive and perfect trade relations, which is of great significance to the optimization and stability of the international trade structure of agricultural products. This paper provides a new perspective on analyzing international trade patterns of agricultural products by quantitatively analyzing the evolution of communities. The current work only considers a period of 17 years, 2000–2016, and in the future the observation time will be extended to learn more about the evolution of agricultural products trade network. In particular, the trade conflicts between some countries and the COVID-19 pandemic in recent years may have an impact on the trade pattern of agricultural products, and we will continue to follow up. In addition, we will combine a robustness analysis to further reveal the relative positions of various countries and focus on more refined categories of agricultural products.
Acknowledgments
The authors express their gratitude to the Standard Map Service website (http://bzdt.ch.mnr.gov.cn/) and Institute of Geographic Sciences and Natural Resources Research, CAS (https://www.resdc.cn/) for providing the world map.
Disclosure statement
No potential conflict of interest was reported by the author(s).
Data availability statement
The data that support the findings of this study were derived from the UN Comtrade and Chatham House Resource Trade Database at https://resourcetrade.earth/. Derived data are available from the corresponding author.
Additional information
Funding
Notes on contributors
Jiaxin Dong
Jiaxin Dong is currently pursuing the PhD degree at the School of Remote Sensing and Information Engineering, Wuhan University. Her main research interests are remote sensing and complex network analysis.
Siwei Li
Siwei Li is a professor at the School of Remote Sensing and Information Engineering, Wuhan University. His main research interests are atmospheric remote sensing and air pollution.
Lina Huang
Lina Huang is an associate professor at the School of Resource and Environmental Sciences, Wuhan University. Her main research interests are geographic information visualization, spatial data multi-representation and complex network.
Jing He
Jing He is a PhD student of School of Resource and Environmental Sciences, Wuhan University. Her research interests focus on data mining, spatial analysis and poverty research.
Wenping Jiang
Wenping Jiang is an associate professor at the School of Resource and Environmental Sciences, Wuhan University. His research interests include digital map, geographic information visualization and spatial analysis.
Fu Ren
Fu Ren is a professor at the School of Resource and Environmental Sciences, Wuhan University. His main research interests are big data analysis and geographic information visualization.
Yujing Wang
Yujing Wang received her PhD degree from the School of Resource and Environmental Sciences, Wuhan University. Her research interests include satellite remote sensing data management and knowledge graph.
Jiang Sun
Jiang Sun is an assistant engineer with Hydrogeology & Geoengineering Investigation Institute of Hubei Province.
Hao Zhang
Hao Zhang received his master’s degree in 2019 from Wuhan University. His research interests include spatio-temporal data mining and mapping.
References
- Ahuja, M. S., and J. Singh. 2018. “Finding Communities in Social Networks with Node Attribute and Graph Structure Using Jaya Optimization Algorithm.” International Journal of Future Generation Communication and Networking 11 (2): 33–48. doi:10.14257/ijfgcn.2018.11.2.04.
- Aller, C., L. Ductor, and M. J. Herrerias. 2015. “The World Trade Network and the Environment.” Energy Economics 52 (A): 55–68. doi:10.1016/j.eneco.2015.09.008.
- Blondel, V. D., J. Guillaume, R. Lambiotte, and E. Lefebvre. 2008. “Fast Unfolding of Communities in Large Networks.” Journal of Statistical Mechanics-Theory and Experiment 2008 (10): P10008. doi:10.1088/1742-5468/2008/10/P10008.
- Brond, F. 2018. “Territory and Trade Networks in the Small-Scale Oil-Palm Industry in Rural Ghana.” Applied Geography 100: 90–100. doi:10.1016/j.apgeog.2018.10.002.
- Chen, B., M. Y. Hanb, K. Peng, S. L. Zhou, L. Shao, X. F. Wu, W. D. Wei, et al. 2018a. ”Global Land-Water Nexus: Agricultural Land and Freshwater Use Embodied in Worldwide Supply Chains.” The Science of the Total Environment 613: 931–943. doi:10.1016/j.scitotenv.2017.09.138.
- Chen, Y., A. Q. Hu, K. W. Yip, J. Hu, and Z. G. Zhong. 2003. “Finding the Most Vital Node with Respect to the Number of Spanning Trees.” In International Conference on Neural Networks and Signal Processing, Nanjing, China, December 14–17.
- Chen, B., J. S. Li, X. F. Wu, M. Y. Han, L. Zeng, Z. Li, and G. Q. Chen. 2018b. “Global Energy Flows Embodied in International Trade: A Combination of Environmentally Extended Input-Output Analysis and Complex Network Analysis.” Applied Energy 210: 98–107. doi:10.1016/j.apenergy.2017.10.113.
- Chen, D., L. Lu, M. Shang, Y. Zhang, and T. Zhou. 2012. “Identifying Influential Nodes in Complex Networks.” Physica A-Statistical Mechanics and Its Applications 391 (4): 1777–1787. doi:10.1016/j.physa.2011.09.017.
- Choi, S., A. Galeotti, and S. Goyal. 2017. “Trading in Networks: Theory and Experiments.” Journal of the European Economic Association 15 (4): 784–817. doi:10.1093/jeea/jvw016.
- Clauset, A., M. Newman, and C. Moore. 2004. “Finding Community Structure in Very Large Networks.” Physical Review E 70 (62). doi:10.1103/PhysRevE.70.066111.
- Dalin, C., M. Konar, N. Hanasaki, A. Rinaldo, and I. Rodriguez-Iturbe. 2012. “Evolution of the Global Virtual Water Trade Network.” Proceedings of the National Academy of Sciences of the United States of America 109 (16): 5989–5994. doi:10.1073/pnas.1203176109.
- Dela Torre, D. M. G., J. Gao, and C. Macinnis-Ng. 2021. “Remote Sensing-Based Estimation of Rice Yields Using Various Models: A Critical Review.” Geo-Spatial Information Science 24 (4): 580–603. doi:10.1080/10095020.2021.1936656.
- Dong, C., Q. Yin, K. J. Lane, Z. Yan, T. Shi, Y. Liu, and M. L. Bell. 2018. “Competition and Transmission Evolution of Global Food Trade: A Case Study of Wheat.” Physica A-Statistical Mechanics and Its Applications 509: 998–1008. doi:10.1016/j.physa.2018.06.052.
- Ercsey-Ravasz, M., Z. Toroczkai, Z. Lakner, J. Baranyi, and V. Colizza. 2012. “Complexity of the International Agro-Food Trade Network and Its Impact on Food Safety.” Plos One 7 (5). doi:10.1371/journal.pone.0037810.
- Fagiolo, G., J. Reyes, and S. Schiavo. 2010. “The Evolution of the World Trade Web: A Weighted-Network Analysis.” Journal of Evolutionary Economics 20 (4): 479–514. doi:10.1007/s00191-009-0160-x.
- Gephart, J. A., and M. L. Pace. 2015. “Structure and Evolution of the Global Seafood Trade Network.” Environmental Research Letters 10 (12): 125014. doi:10.1088/1748-9326/10/12/125014.
- Hou, W., H. Liu, H. Wang, and F. Wu. 2018. “Structure and Patterns of the International Rare Earths Trade: A Complex Network Analysis.” Resources Policy 55: 133–142. doi:10.1016/j.resourpol.2017.11.008.
- Huang, H., M. von Lampe, and F. van Tongeren. 2011. “Climate Change and Trade in Agriculture.” Food Policy 361: S9–S13. doi:10.1016/j.foodpol.2010.10.008.
- Ji, Q., H. Zhang, and Y. Fan. 2014. “Identification of Global Oil Trade Patterns: An Empirical Research Based on Complex Network Theory.” Energy Conversion and Management 85: 856–865. doi:10.1016/j.enconman.2013.12.072.
- Jin, J., K. Xu, N. Xiong, Y. Liu, and G. Li. 2012. “Multi-Index Evaluation Algorithm Based on Principal Component Analysis for Node Importance in Complex Networks.” Networks 1 (3): 108–115. doi:10.1049/iet-net.2011.0013.
- Kitsak, M., L. K. Gallos, S. Havlin, F. Liljeros, L. Muchnik, H. E. Stanley, and H. A. Makse. 2010. “Identification of Influential Spreaders in Complex Networks.” Nature Physics 6 (11): 888–893. doi:10.1038/NPHYS1746.
- Li, F., N. Wan, B. Shi, X. Liu, and Z. Guo. 2014. “The Vulnerability Measure of Tourism Industry Based on the Perspective of ‘Environment-Structure’ Integration a Case Study of 31 Provinces in Mainland China.” Geographical Research 33 (3): 569–581. doi:10.11821/dlyj201403015.
- Lin, X., Q. Dang, and M. Konar. 2014. “A Network Analysis of Food Flows Within the United States of America.” Environmental Science & Technology 48 (10): 5439–5447. doi:10.1021/es500471d.
- Liu, Y., H. Gao, X. Kang, Q. Liu, R. Wang, and Z. Qin. 2015. “Fast Community Discovery and Its Evolution Tracking in Time-Evolving Social Networks.” In 2015 IEEE International Conference On Data Mining Workshop (ICDMW), 13–20. Atlantic City, NJ, USA, November 14–17. doi:10.1109/ICDMW.2015.177
- Liu, J., Z. Ren, Q. Guo, and B. Wang. 2013. “Node Importance Ranking of Complex Networks.” Acta Physica Sinica 62 (17): 9–18. doi:10.7498/aps.62.178901.
- Liu, Y., A. Singleton, and D. Arribas-Bel. 2019. “A Principal Component Analysis (PCA)-Based Framework for Automated Variable Selection in Geodemographic Classification.” Geo-Spatial Information Science 22 (4): 251–264. doi:10.1080/10095020.2019.1621549.
- Liu, C., J. Xu, and H. Zhang. 2020. “Competitiveness or Complementarity? A Dynamic Network Analysis of International Agri-Trade Along the Belt and Road.” Applied Spatial Analysis and Policy 13 (2): 349–374. doi:10.1007/s12061-019-09307-5.
- Liu, W., H. Yang, P. Ciais, M. Kummu, and A. Y. Hoekstra. 2020. “China’s Food Supply Sources Under Trade Conflict with the United States and Limited Domestic Land and Water Resources.” Earths Future 8 (3). doi:10.1029/2020EF001482.
- Newman, M. 2003. “The Structure and Function of Complex Networks.” SIAM Review 45 (2): 167–256. doi:10.1137/S003614450342480.
- Newman, M. 2004. “Fast Algorithm for Detecting Community Structure in Networks.” Physical Review E 69 (6). doi:10.1103/PhysRevE.69.066133.
- Piccardi, C., and L. Tajoli. 2012. “Existence and Significance of Communities in the World Trade Web.” Physical Review E 85 (6). doi:10.1103/PhysRevE.85.066119.
- Qiang, W., S. Niu, X. Wang, C. Zhang, A. Liu, and S. Cheng. 2020. “Evolution of the Global Agricultural Trade Network and Policy Implications for China.” Sustainability 12 (1). doi:10.3390/su12010192.
- Ren, Z., A. Zeng, D. Chen, H. Liao, and J. Liu. 2014. “Iterative Resource Allocation for Ranking Spreaders in Complex Networks.” Europhysics Letters 106 (4): 48005. doi:10.1209/0295-5075/106/48005.
- Serrano, M. A., and M. Boguna. 2003. “Topology of the World Trade Web.” Physical Review E 68 (12). doi:10.1103/PhysRevE.68.015101.
- Shutters, S. T., R. Muneepeerakul, and R. Huerta-Quintanilla. 2012. “Agricultural Trade Networks and Patterns of Economic Development.” Plos One 7 (7): e39756. doi:10.1371/journal.pone.0039756.
- Torreggiani, S., G. Mangioni, M. J. Puma, and G. Fagiolo. 2018. “Identifying the Community Structure of the Food-Trade International Multi-Network.” Environmental Research Letters 13 (5): 054026. doi:10.1088/1748-9326/aabf23.
- Tulu, M. M., R. Hou, and T. Younas. 2017. “Finding Important Nodes Based on Community Structure and Degree of Neighbor Nodes to Disseminate Information in Complex Networks.” In 2017 3rd IEEE International Conference on Computer and Communications (ICCC), 269–273. Chengdu, China, December 13-16. doi:10.1109/CompComm.2017.8322554.
- Wang, J. 2014. “Research on Dynamic Networks Community Structure Discovery Methods and Its Applications.” Master diss., Dalian University of Technology.
- Wen, L., X. Zhang, and H. Wang. 2010. “Method of Synthetic Evaluation Based on the Principal Component Analysis and Entropy Weight.” In The 2010 International Conference on Computer Application and System Modeling, Taiyuan, China, October 22–24. doi: 10.1109/ICCASM.2010.5619261.
- Xanat, V. M., K. Jiang, G. A. Barnett, and H. W. Park. 2018. “International Trade of GMO-Related Agricultural Products.” Quality & Quantity 52 (2): 565–587. doi:10.1007/s11135-017-0521-8.
- Zhong, W., H. An, L. Shen, T. Dai, W. Fang, X. Gao, and D. Dong. 2017. “Global Pattern of the International Fossil Fuel Trade: The Evolution of Communities.” Energy 123: 260–270. doi:10.1016/j.energy.2017.02.033.
- Zhong, L., M. Shang, X. Chen, and S. Cai. 2018. “Identifying the Influential Nodes via Eigen-Centrality from the Differences and Similarities of Structure.” Physica A-Statistical Mechanics and Its Applications 510: 77–82. doi:10.1016/j.physa.2018.06.115.
- Zhou, Q., and A. Ismaeel. 2021. “Integration of Maximum Crop Response with Machine Learning Regression Model to Timely Estimate Crop Yield.” Geo-Spatial Information Science 24 (3): 474–483. doi:10.1080/10095020.2021.1957723.