
 ?Mathematical formulae have been encoded as MathML and are displayed in this HTML version using MathJax in order to improve their display. Uncheck the box to turn MathJax off. This feature requires Javascript. Click on a formula to zoom.
Abstract
Karst area is one of the most ecologically fragile regions. Monitoring spatial and temporal variation of net primary productivity (NPP) and its response to climate change are essential for vegetation restoration. In this study, we used the CASA (Carnegie-Ames-Stanford Approach) model to estimate the NPP in the karst area of China during 2001 to 2019. We analyzed the response of multi-scale NPP to climate change by using Theil-Sen Median trend analysis, partial correlation analysis and time lag analysis. The results showed that the average NPP was 399.06 gC·m−2, decreased from southeast to northwest, with an annual increase rate of 1.93 gC·m−2 from 2001 to 2019. The broadleaf forest had the highest NPP, and summer NPP accounted for 48.12% of annual NPP. Climate change significantly promotes the increase of NPP in the early growing season. Partial correlation analysis showed that NPP was more correlated with precipitation (0.20) than temperature (0.12), this phenomenon was more pronounced in some arid regions. Where precipitation caused a decrease in NPP during the rainy season. The time lag of NPP to temperature change was shorter than precipitation, indicating that NPP is more sensitive to temperature in most regions. The time lag of NPP to temperature changes was very short in spring. Whereas, even in arid regions, the time lag of NPP to precipitation changes was still long. This study can deepen our knowledge of the response of NPP to climate change in karst ecosystems.
1. Introduction
The IPCC points out that the emission of CO2 is the leading cause the of global temperature increase (Stocker Citation2014). The increasing concentration of CO2 has affected global climate (Keenan et al. Citation2012). Carbon cycle research has become a global issue under global warming (Pan et al. Citation2011). Net primary productivity (NPP) is an essential factor of the terrestrial carbon cycle, it reflects the carbon sequestration capacity in the natural environment (Yang et al. Citation2017). In addition, it is also a critical factor for assessing the function of vegetation ecosystems (Field et al. Citation1998; Gahlot et al. Citation2017; Ogle Citation2018). Therefore, exploring the influences of climate change on NPP is crucial to reveal the response mechanism of vegetation ecosystems to environmental changes.
Karst area is one of the ecologically fragile areas (Song et al. 2021), which accounts for 36% of China (Xiao and Weng Citation2007; Hu et al. Citation2020; Wei et al. Citation2021). In the karst area, biological, mineral, and water resources are abundant; however, excessive human exploitation has led to extensive soil erosion and land desertification, making the already fragile ecological environment even worse (Wu et al. Citation2020; Chen et al. Citation2021a). Karst area is distributed in the southwest, northwest and Tibetan Plateau in China. Regional heterogeneities lead to significant differences in vegetation response to climate change (Qiao et al. Citation2021; Chen et al. Citation2021b). Analysis of the spatial and temporal changes of NPP and exploring the relationship between NPP and climatic factors in karst ecosystem can provide essential references for vegetation conservation.
Early studies mainly obtained NPP by field measurements, while this method is only applicable to small-scale regions. It is more challenging to get NPP data for large-scale regions, because of the high cost and complexity of getting long-time series data. With the advancements of space technology, remote sensing data has become more prominent in deriving spatiotemporal NPP at large scales by inverse modelling methods (Prince and Goward Citation1995). Representative models for estimating NPP include the Thornthwaite Memorial model, the Miami model, the BEPS model and the CASA model (Zhou et al. Citation2002). The Carnegie-Ames-Stanford Approach (CASA) is a remote sensing model based on vegetation physiological processes (Potter et al. Citation1993), which has been widely used for estimating NPP at regional and global scales (Xue et al. Citation2022; Yang et al. Citation2021). Previous studies have shown a high correlation between vegetation dynamics and climate change (Pei et al. Citation2019; Wang et al. Citation2021), and have pointed out that NPP is affected by precipitation, temperature and radiation (Liu et al. Citation2020). Due to the difference in geographical location, the response of NPP to different climatic factors varies greatly. In higher elevations, temperature is a key factor limiting the increase in NPP, precipitation restricts the rise of NPP in arid regions (Yan et al. Citation2022). Climatic factors such as temperature produce different effects on NPP in different regions (Chang et al. Citation2020; Yuan et al. Citation2021). For example, higher temperatures both lengthen the growing season of plants and improve photosynthesis; but they also increase evapotranspiration, lower soil water content and restrict plant development. With the deepening of NPP research, many studies found that NPP has a time lag effect on climate change. The time lag effect changes significantly with vegetation type, growth stage, geographic location and climatic factors (Eisfelder et al. Citation2014; Ding et al. Citation2020). Previous studies have shown an overall increasing trend of NPP in karst areas of China. However, this variation still varies significantly in different karst regions (Wang et al. Citation2019; Song et al. 2021). In recent years, scholars have conducted research on the relationship between NPP and climate change in karst areas and have made some progress (Wang et al. Citation2008; Song et al. 2021; Wang et al. Citation2021). Among the available studies, Wu et al. found that solar radiation had a negative effect on NPP growth, while precipitation promoted NPP increase in all regions except the Qinghai–Tibet Plateau (Wu et al. Citation2020); Ma et al. also demonstrated in a study for the southwestern karst region that both temperature and precipitation contributed to the increase in NPP (Ma et al. Citation2022). These existing studies have focused on the southwest region, while fewer studies have assessed NPP in the entire karst region, especially in the ecologically fragile regions, such as Qinghai–Tibet Plateau region, the arid region of China, where many karst landscapes exist. Most of the available studies have illustrated the response mechanism of NPP to climate change at annual scale, whereas fewer studies have examined seasonal-scale and have systematically analyzed the time lag effect between them. Therefore, this study used the CASA to estimate NPP from 2001 to 2019 and detected the association between NPP and climate change at multiple scales in the karst region of China. Our main objectives are: (1) reveal the trends of NPP in the karst regions of China at multiple scales; (2) identify the major climate factors that influence NPP; (3) explore the correlations and time lag periods between NPP and major climate factors at multiple scales.
2. Materials and methods
2.1. Study area
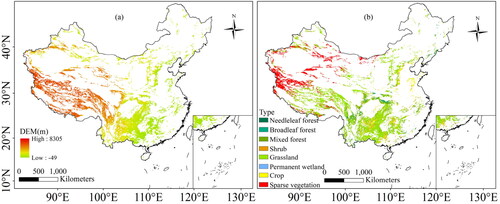
In this study, we took the karst region of China as the subject. China is a vast country with a land area about 9.6 million km2, karst landscapes cover an area of 3.4 million km2. The study area has a large latitudinal span and the spatial distribution of karst landscapes are uneven (). Climate types of China are diverse, the eastern region is monsoon climate; the northwestern region is temperate continental climate; and the Qinghai–Tibet Plateau region is alpine climate (Ding et al. Citation2021). Vegetation types are also diverse in the study area (), with sparse vegetation mainly distributed in the west, grassland primarily in the Qinghai-Tibet Plateau, and forests mainly in the central and northern part. Due to different climatic conditions, vegetation cover in western China is much lower than in the east (Ge et al. Citation2021).
Figure 1. Elevation (a) and vegetation types (b) in the karst area of China.
2.2. Data source and processing
We used MOD13A3 NDVI, meteorological and MCD12Q1 vegetation type data to estimate NPP. The spatial resolution of NDVI and vegetation type are 1000 m and 500 m, and their temporal resolution are one month and one year, respectively. Firstly, we applied MODIS (Moderate-resolution Imaging Spectroradiometer) Reprojection Tool to extract, splice, crop the NDVI and vegetation type datasets, and we obtained the NDVI data and vegetation type data in the study area. Secondly, we used S-G filtering to reconstruct the NDVI data where data quality is influenced by clouds and snow (Yin et al. Citation2020). In addition, we used the same approach to obtain MOD17A3 NPP, and this data was used to validate the estimated results. MODIS data are available from NASA (https://modis.gsfc.nasa.gov).
We obtained monthly mean meteorological data for 699 stations during 2001 to 2019 from the National Meteorological Science Data Center of China (http://data.cma.cn/). We interpolated the meteorological data by using the Anusplin (Guo et al. Citation2020). The above data were interpolated and resampled to unify into a 500 m resolution raster image.
Some studies have demonstrated that the temperature threshold of 5 °C is the minimum temperature for plant growth activities (Kira Citation1991), but it does not provide a good indication in this study. Since karst areas are mainly distributed in the low latitudes, the average monthly temperature is higher than 5 °C in most regions. It is impossible to clearly distinguish between vegetation zones, so we used 10 °C as the threshold of temperature and calculated the biological warmth index (BWI), biological coldness index (BCI) and biological aridity/humidity index (BK) (Jian Citation1997).
(1)
(1)
(2)
(2)
(3)
(3)
where TMPi is the monthly average temperature, n is the eligible month and P is the annual precipitation.
2.3. Methods
2.3.1. Casa Model
The CASA model is the primary model used to estimate the NPP of terrestrial ecosystems, which is based on remote sensing and meteorological data (Potter et al. Citation1993; Potter and Klooster Citation1997). Scholars have constructed an improved model based on the original model with biomes of China (Zhu et al. Citation2007), which is widely used for assessing NPP in China (Luo et al. Citation2018). The estimation formula is as follows:
(4)
(4)
where APAR(x,t) is the absorbed photosynthetically active radiation by vegetation (MJ/m2), ε(x,t) is the light utilization efficiency, t and x represents time and pixel x, respectively.
APAR(x,t) is influenced by the biomes and the total solar radiation, and the formula is as follows:
(5)
(5)
where SOL(x,t) is the total solar radiation; FPAR(x,t) is the fraction of photosynthetically active radiation absorbed.
ε(x,t) is influenced by the stress of temperature and moisture and is calculated as follows:
(6)
(6)
where Tε1(x,t) and Tε2(x,t) denote the stress coefficients of low and high temperature on light utilization efficiency, Wε(x,t) is the moisture stress coefficient and εmax is the maximum light utilization efficiency of vegetation.
2.3.2. Geodetector
The Geodetector model is a set of statistical methods that detect spatial heterogeneity and reveal the driving forces behind it (Wang and Hu Citation2012). The Geodetector model is divided into four parts for solving different problems, and we used factor detection to detect the effect of meteorological factors on NPP. Factor detection is calculated as follows:
(7)
(7)
where q is the power of a single factor on the spatial distribution of NPP, the more the value of q tends to 1, the greater the degree of influence of the factor on the NPP, the significance level of q follows the F-test. n is the total samples, nh is the number of region h, σ2 is the variance of the whole region and
is the variance in region h.
2.3.3. Theil–Sen median trend analysis and Mann–Kendall test
In this study, we investigated NPP changes at each growth stage (annual scale, growing season scale and seasonal scale). Based on previous studies, we defined growing season NPP as total NPP from April to October, spring as March to May, summer as June to August, autumn as September to November and winter as December to February of the following year (Liu et al. Citation2015). Theil–Sen Median trend analysis is a robust non-parametric statistical trend calculation method that can reduce the effect of data outliers (Theil Citation1950; Sen Citation1968). The formula is as follows:
(8)
(8)
where SNPP >0, it indicates an increasing trend of NPP at raster points; SNPP <0 indicates a decreasing trend of NPP at raster points.
The Mann–Kendall test is often combined with the Theil–Sen Median trend analysis to test for significance of trends in long time series. The formula is as follows:
The NPP values are defined as NPP1, NPP2, …, NPPn by time series, and the ith cumulative sample size S is calculated as:
(9)
(9)
The test statistic Z is calculated as follows:
(10)
(10)
(11)
(11)
where Var(S) is the variance and S is the normal distribution. According to the normal distribution table, |Z| >1.95 and |Z| >2.33 were selected to pass the 95% and 99% significance tests, respectively.
2.3.4. Partial correlation analysis and time lag analysis
We used partial correlation analysis to investigate the influence of key factors on NPP. When we examined the influence degree of NPP on two factors, partial correlation analysis can remove one factor and obtain the influence of the other factor on NPP (Chu et al. Citation2019). The formula is as follows:
(12)
(12)
where RNPPX·Y is the partial correlation coefficient between NPP and X climate factor when controlling Y climate factor. When RNPPX·Y > 0, it indicates a positive relationship between NPP and X climate factor; while RNPPX·Y < 0 indicates a negative relationship between NPP and X climate factor. RNPPX, RNPPY and RXY are the correlation coefficients between the two parameters (Asuero et al. Citation2006).
NPP does not respond immediately to climate change; in fact, there is a lag time. We chose 0–3 months to reveal the time lag effect of NPP to climate change (Wang et al. Citation2021; Zhe and Zhang Citation2021). First, we calculated the partial correlation coefficients between NPP and climate factors under different stages, including the current month (R0), the previous month (R1), the previous two months (R2) and the previous three months (R3) (Wang et al. Citation2021). Second, we identify the month with the largest absolute value among the four partial correlation coefficients, and this month was taken as the best time lag. Formulas are as follows:
(13)
(13)
(14)
(14)
where Ri is the absolute value of the partial correlation coefficient between NPP and the X factor in the previous i months. LagT is the month corresponding to the absolute value of the largest partial correlation coefficient in the time lag.
3. Results
3.1. Validation of the estimated NPP
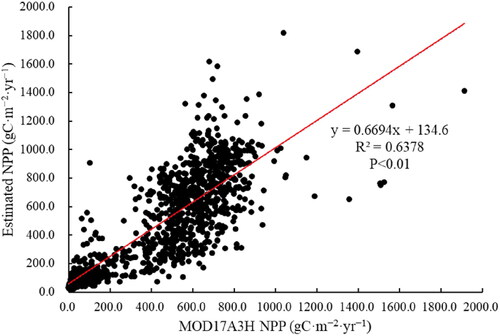
In China’s karst regions, it was challenging to collect the necessary measured NPP data. Therefore, we validated the estimated NPP against the MOD17A3H NPP. The validation result illustrated that the mean MOD17A3H NPP (420.25 gC·m−2) was higher than the mean estimated NPP (399.06 gC·m−2), both data indicated the same trend on interannual scale in the karst regions of China. In addition, both the mean NPP of different vegetation types fluctuated similarly, with broadleaf forests having the highest NPP and sparse vegetation having the lowest NPP. In addition, we randomly selected 10,000 validation sites within the study area. We used SPSS to calculate the correlation between the two data, where the results show that the estimated NPP and MOD17A3H NPP demonstrated a significant correlation (). In conclusion, there is a deviation between the estimated NPP data and MOD17A3H NPP, but they were in the acceptable range, and the estimation results could reflect the actual situation of NPP.
Figure 2. Validation between the estimated NPP and MOD17A3H NPP.
3.2. Spatial distribution of NPP
As shown in , the NPP of each growth stage showed a decreasing trend from southeast to northwest in the karst area of China from 2001 to 2019. On annual scale, the average NPP was 399.06 gC·m−2. As seen in , the low NPP was distributed in the arid region and Qinghai–Tibet Plateau. In those areas, arid and cold climate conditions are the limitation factors for the growth of vegetation. The northwest lacks precipitation necessary for vegetation growth, and the Tibetan plateau has lower temperatures, which results in low vegetation cover. The medium NPP was distributed in north and northeast China. The high NPP was mainly located in southwest China, where karst landscapes were widely distributed. Therefore, the average annual NPP was not low in the study area, mainly due to the higher contribution from the southwest.
Figure 3. Spatial distribution of NPP in karst area of China at different growth stages.
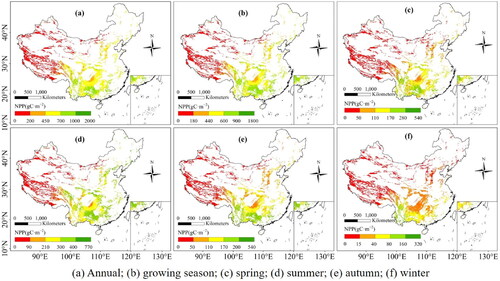
The mean growing season NPP was 371.41 gC·m−2 in the entire region, which showed a slight variation both in value and spatial distribution compared to the mean annual NPP (). On seasonal scale (), summer NPP was the highest (192.01 gC·m−2); and winter NPP was the lowest (27.19 gC·m−2); spring NPP and autumn NPP were 87.69 gC·m−2 and 91.71 gC·m−2, respectively. In spring, high NPP areas were distributed in the southern; in summer, they were transferred to the eastern, and the NPP increased significantly in the east part of the Tibetan Plateau; and in autumn, high NPP area shifted to the southern region again with the similar spatial patterns as spring; whereas in winter, the NPP decreased rapidly in the northern part of China, which might be related to the presence of snow in the north that affected the NPP estimation.
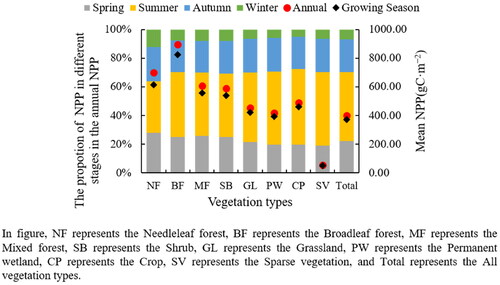
As shown in , NPP varied among vegetation types at different growth stages. NPP was not significantly different at annual and growing season scales, while there were significant differences at seasonal scale. Forest biomes had the highest mean NPP, of which NPP of broadleaf and needleleaf forest were 894.39 gC·m−2 and 700.17 gC·m−2, respectively. NPP of needleleaf forest exceeded broadleaf forest in winter. In contrast, the accumulation of broadleaf forest far exceeded needleleaf forest in other seasons. In winter, broadleaf forests shed their leaves, while needleleaf forests are more of an evergreen tree species. The grassland area was the largest in the karst area of China, and its NPP was 452.37 gC·m−2. In summer, the accumulation of NPP was fastest, and crop (52.76%) had the highest proportion of summer NPP accumulation to annual accumulation. In China, crops grow most abundantly in summer, while in spring and autumn, the crops are planted and harvested, respectively, so the accumulation of NPP is higher in summer.
Figure 4. Variations of NPP for different vegetation types.
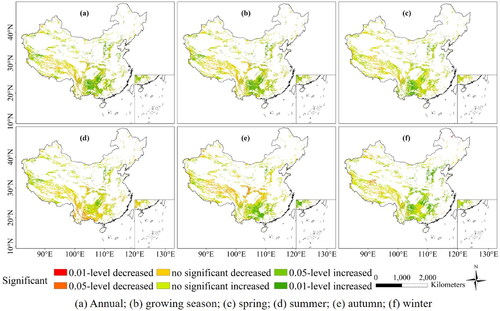
3.3. Trends in NPP
As seen in , NPP showed an increasing trend at a different growth stage in the karst area of China. The annual and growing season NPP increased by 1.93 gC·m−2 and 1.62 gC·m−2 per year from 2001 to 2019, respectively. On seasonal scale, spring NPP increased fastest, reaching 0.90 gC·m−2, accounting for 46.77% of the annual increase (see Supplementary Fig. S-1). The increase in global temperature leads to early and longer vegetation growth reaching maturity in the spring, resulting in a significant rise in accumulation of NPP (Piao et al. Citation2007). Although NPP showed an increasing trend in different stages, it varied greatly within different areas. At the annual scale, NPP increased by 71.48% of the total area, with an extremely significant increase (0.01-level increased) accounting for 20.44%, mainly distributed in the southwest China. Even in summer, when the increase rate of NPP was low (0.26 gC·m−2), the area with NPP increased (62.55%) was still higher than that of decreased (37.45%).
Figure 5. Spatial distribution of NPP trends in karst area of China at different growth stages.
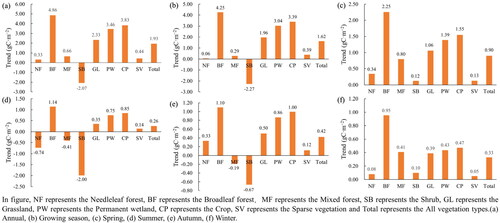
As can be seen from , NPP of broadleaf forest increased at a much higher rate (4.86 gC·m−2) than other vegetation types from 2001 to 2019, followed by crops (3.83 gC·m−2) and wetlands (3.46 gC·m−2). Only scrub showed a decreasing trend (−2.07 gC·m−2) among different vegetation types at an annual scale. NPP of different biomes indicated an increasing trend in most seasons, only few vegetation types showed a decreasing trend, among which NPP of scrub decreased by 2.00 gC·m−2 and 0.67 gC·m−2 in summer and autumn, respectively. For forest biomes, needleleaf and broadleaf forests showed completely different trends, NPP of needleleaf forests indicated an increasing trend (0.33 gC·m−2) on the annual scale and an increasing trend (0.06 gC·m−2) in growing season scale.
Figure 6. Change rate of NPP for different vegetation types at different growth stages.
3.4. Impact of climate change on NPP change
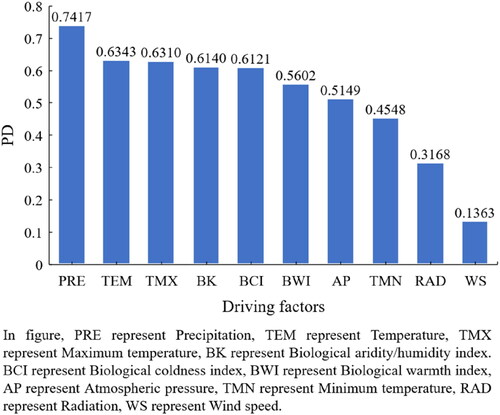
3.4.1. Pd of meteorological factors
We based on the Geodetector to detect the impact of meteorological factors on NPP changes. The q represents the power of determination (PD) of meteorological factors on NPP, and we analyzed the two meteorological factors with the highest PD. As seen in , all meteorological factors had a significant impact on NPP (P < 0.05), PD of PRE was the highest (0.7417), followed by TEM (0.6343), and the PD of WS (0.1363) was the lowest (). Therefore, we believe that PRE and TEM are the two key meteorological factors controlling NPP changes.
Figure 7. PD of meteorological factors on NPP.
3.4.2. Impact of climate change on NPP
The correlation between NPP and key meteorological factors showed spatial heterogeneity at different growth stages (). On annual scale (), temperature generally promoted the rise of NPP, and the correlation coefficient was 0.12 in the karst area of China (). The area with a positive correlation between NPP and temperature accounted for 68.91%. The area with extremely significant positive correlation (0.01-level positive correlation, P < 0.01) and significant positive correlation (0.05-level positive correlation, P < 0.05) were 1.88% and 6.15%, respectively. The area with a negative correlation was distributed in southwest China representing a tropical monsoon climate region, and high temperature had a suppressive impact on NPP (see Supplementary Fig. S-2). To some extent, precipitation promoted the increase of NPP (), and the correlation coefficient between NPP and precipitation was 0.20 (). The impact of precipitation on NPP was positive, which accounted for 76.75%. The area with extremely significant positive correlation (8.04%) and significant positive correlation (9.95%) were mainly distributed in the arid area of northwest China and Tibetan Plateau.
Figure 8. Correlation between NPP and temperature (TEM) and precipitation (PRE) in karst area of China at different growth stages.
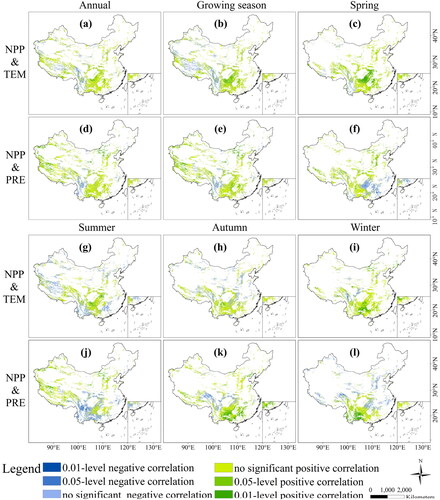
Figure 9. Correlation coefficients between NPP and temperature (a) and precipitation (b) for different vegetation types.
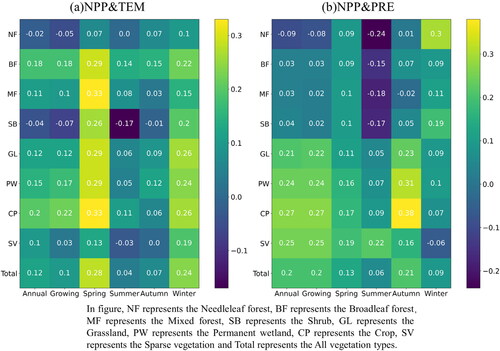
On seasonal scale, temperature promoted the increase of NPP in most seasons. In spring, areas with negative correlation were distributed in southeast (); areas with negative correlation shifted from westward to southwest China in summer (). Compared with temperature, the correlation between NPP and precipitation indicated more variability on seasonal scale. In spring, negative correlation regions were distributed in southeast (); in summer, negative correlation areas shifted westward to southwest China (); in autumn, they shifted to the eastern Tibetan Plateau (); and in winter, areas with negative correlation mainly existed in central and northern China (). Temperature fluctuated significantly throughout the seasons, which influenced the growth of vegetation and led to the change of NPP. In this study, we discovered that areas where NPP was more sensitive to temperature changes were mainly distributed in southwestern and northwestern China. While there were obvious spatial differences of NPP response to precipitation changes at different growth stages. So, we concluded that precipitation promoted NPP more significantly in the karst areas of China.
The relationship between NPP and climatic variables differed among vegetation types (). Compared to other vegetation types, NPP of broadleaf forest and crop had a higher correlation with temperature. In pre-growing season (early spring), higher temperatures led to vegetation entering the growing season earlier; in summer and autumn, there are negative effect of higher temperature on NPP of some vegetation types (). Compared to temperature, the positive correlation between NPP and precipitation was higher for sparse vegetation, crops, grasslands and wetlands. In spring, NPP of different biomes had a weak correlation with precipitation, while this weak positive correlation changed to a negative one in summer (). It is worth mentioning that there was a higher correlation between sparse vegetation and precipitation. Thus, excessive precipitation is the biggest problem limiting vegetation growth in these areas.
3.4.3. Time lagged impact of climate variables on NPP
Previous research has indicated that climatic changes have a time lag effect on vegetation. For the association between NPP and temperature, there was a significant difference at different seasons (). The time lag of NPP to temperature at annual scale (1.39 months) was longer than that at growing season scale (1.03 months). The spatial distribution of time lag also differed significantly, showing a general trend of decrease from west to east. The areas with longer time lag were distributed in the western regions, while the shorter time lag exhibited in the southeast areas. The time lag between NPP and temperature was more complex on seasonal scale. In spring, the time lag between NPP and temperature (0.68 months) was much shorter than that in summer (1.22 months), autumn (1.61 months) and winter (1.28 months). Spring is the early growing season, and the increase of temperature accelerates the vegetation growth. While vegetation enters the maturity period in summer () and autumn (), so it is not sensitive to the recent temperature changes. In general, the time lag of NPP to temperature changes is short in the karst area of China.
Figure 10. Spatial distribution of time lag in karst area of China at different growth stages.
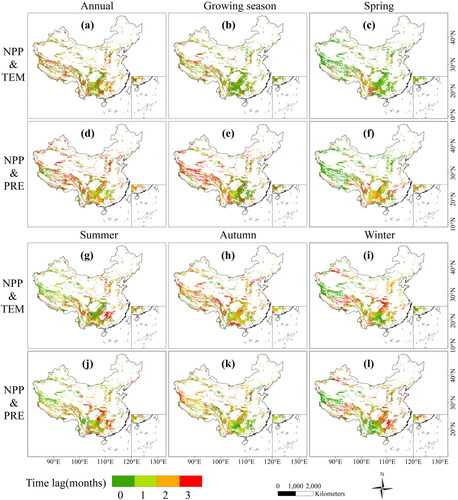
In the karst area of western China, NPP (1.53 months) had longer time lags to precipitation changes at growing season scale. The areas with shorter time lags were mainly distributed in the southern areas (). On seasonal scale, compared to temperature, the time lag of NPP to precipitation change was short (0.98 months) in the western and northern area, the longer time lag distributed in the south area (). With time, the area with short time lag gradually shifted to the southwest. In winter, areas with short time lag were mainly distributed in the southwest (). Overall, compared to the lag effect of NPP to two key factors, which was more sensitive to short-term temperature change in the karst area of China.
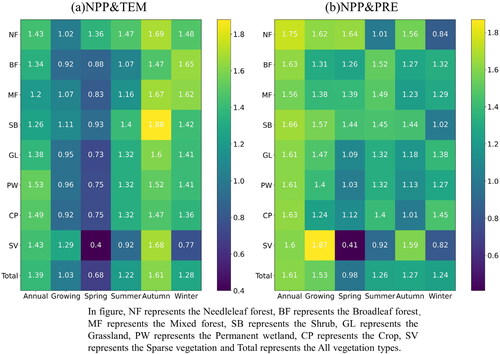
The time lag of NPP to two key factors varied among vegetation types (). The time lag of NPP to temperature was shorter for each vegetation type at different stages. At growing season scale, the response time of NPP to climate changes was shorter for different biomes than annual scale, which indicated that NPP was more sensitive to changes of climate in the early spring. On the other hand, the time lag of NPP to climate change was shorter for all vegetation types in spring than other seasons, except for broadleaf forests. In particular, for sparse vegetation, the time lag was extremely short in spring, these areas were sensitive to climate changes. However, NPP of sparse vegetation had a longer time lag to precipitation changes, which may be due to the time required for snowmelt in the growing season in these areas.
Figure 11. Time lag of NPP to temperature (a) and precipitation (b) for different vegetation types.
4. Discussion
4.1. Spatial distribution and variation of NPP
Spatial distribution of the estimated NPP is similar to previous research (Liang et al. Citation2015; Feng et al. Citation2019), and the distribution is due to the combined effect of climatic factors. The southwest area is located in low latitude, influenced by ocean currents and monsoons, which provides sufficient precipitation, suitable temperature and solar radiation, which is more suitable for vegetation growth. The vegetation type is mainly evergreen forest in the southwest of China. Although the ecological function of the karst landscape is not stable, NPP are still significantly higher in these regions than other regions. In contrast, these are dominated by alpine and arid climates in the Tibetan Plateau and the northwest area, where precipitation is low, and vegetation types are mainly meadows and grasslands. In the extensive deserts and sparse vegetations, the condition of vegetation growth is poor and leads to the lowest NPP.
There is significant spatial variation of NPP changes in the karst region of China. This result cannot be attributed entirely to climate changes, which is the result of the combination of climate and human factor (Ge et al. Citation2021; Li et al. Citation2021a). However, it is undeniable that NPP has shown a continuous increasing trend in most northern hemisphere regions under global warming (Rafique et al. Citation2016). In this study, NPP indicated an increasing trend (0.48%), with a slight difference compared with previous studies of the same period in China [0.42% from 1982 to 2010 (Liang et al. Citation2015) and 0.5% from 1982 to 2015 (Feng et al. Citation2019)]. This trend is mainly due to the significant increase of NPP in spring (46.84%). Against the background of global warming, the increase of seasonal NPP mainly attributes to an earlier growing season (early spring) and the enhanced vegetation growth in spring (Linderholm Citation2006; Liu et al. Citation2019).
4.2. Relationship between NPP and meteorological factors
The response of vegetation to climate changes is mainly characterized by the unique physiological mechanisms of vegetation and its sensitivity to surrounding climate changes (Sun et al. Citation2022). Although most previous research studies have shown that climate change facilitates vegetation growth in the northern hemisphere, the effect mechanism of climate change on vegetation are not fully understood (Jiang et al. Citation2011). There is a non-linear relationship between NPP and climate change. Several studies have shown that precipitation plays a determinant role on NPP changes in arid regions (Chen et al. Citation2013), while temperature is the dominant factor influencing NPP positively in the colder region of high altitudes (Chen et al. Citation2017). Higher temperature results in a longer growing season of vegetation and enhances photosynthesis (Sun et al. Citation2022). In addition, precipitation can provide sufficient water and contributes to vegetation growth (Qian et al. Citation2019). However, higher temperature can also lead to the increase of evapotranspiration, which in some areas may result in reduced surface water and lower water availability for the growth of vegetation, causing droughts (Cheng et al. Citation2020), and limiting the growth of vegetation, which are also confirmed by our study. In the tropical and the northwest arid zone, the positive effect of temperature is much less than that in the southwest; and precipitation attributes more positive effects in the arid area.
Our research found that the character of vegetation response to climatic variables shows that NPP is more sensitive to temperature in the early stage of the growing season (early spring). Even in arid regions, it is evident that the positive impact of temperature on the change of vegetation in spring; in summer, the reason for the decrease of NPP is the increase of precipitation, this has been demonstrated in previous studies (Li et al. 2022). In the northwest, precipitation alleviates drought and largely contributes to the increase of NPP in different stages. In the low-temperature period, increasing temperature has a positive role on NPP and can counteract the negative influence of cold precipitation. Previous results show that moisture has a positive effect on NPP and temperature has a weak negative correlation with NPP in the western part of the Tibetan Plateau (Kumar et al. Citation2019), this is consistent with our findings in the region. In studies addressing NPP changes in karst regions, results have shown that precipitation contributes more than temperature (Wu et al. Citation2020), again in agreement with our research that precipitation is the leading cause of NPP increase in karst regions. Our study for the southwest confirmed that the positive effect of temperature on NPP was higher than that of precipitation because summer precipitation led to a decrease in NPP, which is consistent with previous studies (Ma et al. Citation2022). It is worth considering that not all increases or decreases of NPP can be entirely explained by climate changes in different regions. Human activities can drastically change vegetation dynamics in short periods and local regions. To protect the ecosystem stability of karst area, it is extremely crucial to focus on and determine the effect of human activities.
4.3. Time lag effect
The growth of vegetation is not driven by current climatic conditions (Ding et al. Citation2020; Wang et al. Citation2021), as vegetation growth is complicated and slow, climate change does not immediately affect the growth of vegetation, even under the most favourable conditions (Wen et al. Citation2018). This study found that NPP responded more quickly to temperature changes compared to precipitation, as temperature changes will directly affect the photosynthesis of vegetation and influence soil temperature, colony activity and nutrient cycling; in alpine regions, the increase of temperature will cause thawing of permafrost and thawing of shallow subsurface water to provide the necessary water for vegetation. We found the time lag of NPP to precipitation changes is short in arid area, but this time lag effect still exists. The explanation is that precipitation changes subsurface runoff and vegetation roots take up water, this process takes some time.
This study found that the response times of vegetation to temperature and precipitation changes was much shorter in pre-growing season (early spring) than other growing stages, and NPP had significantly influenced by recent climate changes in spring. In the early growing season, suitable temperature and precipitation are important to vegetation. In summer, vegetation enters into a stable growth stage and is influenced little by the climatic drivers. The correlation between NPP and temperature and precipitation was negative in the southern region in summer, which indicated that the increase of temperature and precipitation may had a negative effect on vegetation (Wang et al. Citation2008; Qi et al. Citation2019). The thin soil layer and low water storage in karst areas are important reasons for the instability of the karst ecosystem (Li et al. Citation2021b). Elevated temperature can increase evaporation and cause droughts (Cheng et al. Citation2020), while extreme precipitation may lead to soil nutrient loss (Knapp et al. Citation2008), thus endangering vegetation growth.
4.4. Limitations
Reliable data are the basis of the study. Although vegetation and meteorological data used to calculate NPP have been widely used in vegetation studies, we are not sure about the errors in these data due to the lack of sufficient field measurement data. There are some connections between NPP and meteorological factors (). We only explored the relationships between NPP and the two key factors with the highest explanatory power, but in fact, some other meteorological factors also affect NPP. In addition, we did not explore the changes of NPP caused by human activities, while the role of human activities on NPP may be prominent. We discussed the impact of climatic variables on NPP at varying seasonal scales, but did not study it on monthly basis. We analysed the impacts of climate factors on different vegetation types as a whole, so our study may not be appropriate to conclude findings at the species level. Despite our study has some limitations, the results for comprehend the relationship between NPP and climatic variables in the karst area of China.
5. Conclusion
This study explored the spatial and temporal variation patterns of NPP at different growth stages and clarified the driving climate factors that influenced NPP change in the karst area of China during 2001–2019. Our results indicated that NPP had a decreasing trend from southeast to northwest at different growing stages. The increase of average annual NPP was 1.93 gC·m−2, and the increase rate of NPP in spring occupied 46.77% of the annual increase rate. NPP of different vegetation types showed significant variation, with broadleaf forests having the highest increase rate (4.86 gC·m−2).
The results indicate that temperature and precipitation are more deeply related to NPP changes. The increase in temperature promotes NPP in cold regions and suppresses it in arid regions. Precipitation had a powerful promoting effect in the arid region. The response of NPP to temperature and precipitation also varied significantly for different vegetation types at different stages. Overall, the time lag of NPP to temperature changes is shorter, while precipitation contributed more to NPP.
Authors’ contributions
Bingxin Ma: Conceptualization, Visualization, Methodology, Writing – original draft. Juanli Jing: Methodology, Validation, Visualization, Funding acquisition, Writing review and editing. Bing Liu: Methodology, Validation. Yong Xu: Methodology, Conceptualization. Shiqing Dou: Conceptualization, Resources. Hongchang He: Resources.
Supplemental Material
Download MS Word (36.9 MB)Disclosure statement
All authors declare that they have no known competing financial interests or personal relationships in this paper.
Data availability statement
All data can be obtained from the authors on reasonable request.
Additional information
Funding
References
- Asuero AG, Sayago A, Gonzalez AG. 2006. The correlation coefficient: An overview. Crit Rev Anal Chem. 36(1):41–59.
- Chang Q, Xiao XM, Wu XC, Doughty R, Jiao WZ, Bajgain R, Qin YW, Wang J. 2020. Estimating site-specific optimum air temperature and assessing its effect on the photosynthesis of grasslands in mid- to high-latitudes. Environ Res Lett. 15(3):034064.
- Chen F, Wang SJ, Bai XY, Liu F, Zhou DQ, Tian YC, Luo GJ, Li Q, Wu LH, Zheng C, et al. 2021a. Assessing spatial-temporal evolution processes and driving forces of karst rocky desertification. Geocarto Int. 36(3):262–280.
- Chen T, Werf GR, Jeu RAM, Wang G, Dolman AJ. 2013. A global analysis of the impact of drought on net primary productivity. Hydrol Earth Syst Sci. 17(10):3885–3894.
- Chen TT, Peng L, Liu SQ, Wang Q. 2017. Spatio-temporal pattern of net primary productivity in Hengduan Mountains area, China: impacts of climate change and human activities. Chin Geogr Sci. 27(6):948–962.
- Chen W, Bai S, Zhao HM, Han XR, Li LH. 2021b. Spatiotemporal analysis and potential impact factors of vegetation variation in the karst region of Southwest China. Environ Sci Pollut Res Int. 28(43):61258–61273.
- Cheng QP, Gao L, Zhong FL, Zuo XA, Ma MM. 2020. Spatiotemporal variations of drought in the Yunnan-Guizhou Plateau, southwest China, during 1960-2013 and their association with large-scale circulations and historical records. Ecol. Indic. 112:18.
- Chu HS, Venevsky S, Wu C, Wang MH. 2019. NDVI-based vegetation dynamics and its response to climate changes at Amur-Heilongjiang River Basin from 1982 to 2015. Sci Total Environ. 650(Pt 2):2051–2062.
- Ding YB, Xu JT, Wang XW, Cai HJ, Zhou ZQ, Sun YN, Shi HY. 2021. Propagation of meteorological to hydrological drought for different climate regions in China. J Environ Manage. 283:12.
- Ding YX, Li Z, Peng SZ. 2020. Global analysis of time-lag and -accumulation effects of climate on vegetation growth. Int J Appl Earth Obs Geoinf. 92:12.
- Eisfelder C, Klein I, Niklaus M, Kuenzer C. 2014. Net primary productivity in Kazakhstan, its spatio-temporal patterns and relation to meteorological variables. J. Arid. Environ. 103:17–30.
- Feng YH, Zhu JX, Zhao X, Tang ZY, Zhu JL, Fang JY. 2019. Changes in the trends of vegetation net primary productivity in China between 1982 and 2015. Environ Res Lett. 14(12):124009.
- Field CB, Behrenfeld MJ, Randerson JT, Falkowski P. 1998. Primary production of the biosphere: integrating terrestrial and oceanic components. Science. 281(5374):237–240.
- Gahlot S, Shu SJ, Jain AK, Roy SB. 2017. Estimating trends and variation of net biome productivity in India for 1980-2012 using a land surface model. Geophys Res Lett. 44:11573–11579.
- Ge WY, Deng LQ, Wang F, Han JQ. 2021. Quantifying the contributions of human activities and climate change to vegetation net primary productivity dynamics in China from 2001 to 2016. Sci Total Environ. 773:11.
- Guo BB, Zhang J, Meng XY, Xu TB, Song YY. 2020. Long-term spatio-temporal precipitation variations in China with precipitation surface interpolated by ANUSPLIN. Sci Rep. 10(1):17.
- Hu ZY, Wang SJ, Bai XY, Luo GJ, Li Q, Wu LH, Yang YJ, Tian SQ, Li CJ, Deng YH. 2020. Changes in ecosystem service values in karst areas of China. Agric Ecosyst Environ. 301:16.
- Jian N. 1997. Development of Kira’s indices and its application to vegetation-climate interaction study of China. J Appl Ecol. 8:161–170.
- Jiang DB, Zhang Y, Lang XM. 2011. Vegetation feedback under future global warming. Theor Appl Climatol. 106(1–2):211–227.
- Keenan TF, Baker I, Barr A, Ciais P, Davis K, Dietze M, Dragon D, Gough CM, Grant R, Hollinger D, et al. 2012. Terrestrial biosphere model performance for inter-annual variability of land-atmosphere CO2 exchange. Glob Change Biol. 18(6):1971–1987.
- Kira T. 1991. Forest ecosystems of east and southeast-Asia in a global perspective. Ecol Res. 6(2):185–200.
- Knapp AK, Beier C, Briske DD, Classen AT, Luo Y, Reichstein M, Smith MD, Smith SD, Bell JE, Fay PA, et al. 2008. Consequences of more extreme precipitation regimes for terrestrial ecosystems. Bioscience. 58(9):811–821.
- Kumar M, Singh H, Pandey R, Singh MP, Ravindranath NH, Kalra N. 2019. Assessing vulnerability of forest ecosystem in the Indian Western Himalayan region using trends of net primary productivity. Biodivers Conserv. 28(8–9):2163–2182.
- Li CH, Wang YT, Wu XD, Cao HJ, Li WP, Wu TH. 2021a. Reducing human activity promotes environmental restoration in arid and semi-arid regions: A case study in Northwest China. Sci Total Environ. 768:9.
- Li SL, Liu CQ, Chen JA, Wang SJ. 2021b. Karst ecosystem and environment: characteristics, evolution processes, and sustainable development. Agric Ecosyst Environ. 306:4.
- Li J, Xi MF, Wang LJ, Li N, Wang HW, Qin F. 2022. Vegetation responses to climate change and anthropogenic activity in China, 1982 to 2018. Int J Environ Res Public Health. 19:20.
- Liang W, Yang YT, Fan DM, Guan HD, Zhang T, Long D, Zhou Y, Bai D. 2015. Analysis of spatial and temporal patterns of net primary production and their climate controls in China from 1982 to 2010. Agric For Meteorol. 204:22–36.
- Linderholm HW. 2006. Growing season changes in the last century. Agric For Meteorol. 137(1–2):1–14.
- Liu FH, Xu CY, Yang XX, Ye XC. 2020. Controls of climate and land-use change on terrestrial net primary productivity variation in a subtropical humid basin. Remote Sens. 12:20.
- Liu Q, Piao SL, Fu YSH, Gao MD, Penuelas J, Janssens IA. 2019. Climatic warming increases spatial synchrony in spring vegetation phenology across the northern hemisphere. Geophys Res Lett. 46(3):1641–1650.
- Liu XF, Zhu X, Li SS, Liu YX, Pan YZ. 2015. Changes in growing season vegetation and their associated driving forces in China during 2001-2012. Remote Sens. 7(11):15517–15535.
- Luo ZH, Wu WC, Yu XJ, Song QM, Yang J, Wu JH, Zhang HJ. 2018. Variation of net primary production and its correlation with climate change and anthropogenic activities over the Tibetan plateau. Remote Sens. 10:22.
- Ma BX, Jing JL, Liu B, Xu Y, Dou SQ, He HC. 2022. Quantitative assessment of the relative contributions of climate change and human activities to NPP changes in the southwest karst area of China. Environ Sci Pollut Res. 1:15.
- Ogle K. 2018. Microbes weaken soil carbon sink. Nature. 560(7716):32–33.
- Pan YD, Birdsey RA, Fang JY, Houghton R, Kauppi PE, Kurz WA, Phillips OL, Shvidenko A, Lewis SL, Canadell JG, et al. 2011. A large and persistent carbon sink in the world’s forests. Science. 333(6045):988–993.
- Pei J, Wang L, Wang XY, Niu Z, Kelly M, Song XP, Huang N, Geng J, Tian HF, Yu Y, et al. 2019. Time series of Landsat imagery shows vegetation recovery in two fragile Karst watersheds in southwest China from 1988 to 2016. Remote Sens. 11:26.
- Piao SL, Friedlingstein P, Ciais P, Viovy N, Demarty J. 2007. Growing season extension and its impact on terrestrial carbon cycle in the Northern Hemisphere over the past 2 decades. Glob Biogeochem Cycle. 21:11.
- Potter CS, Klooster SA. 1997. Global model estimates of carbon and nitrogen storage in litter and soil pools: response to changes in vegetation quality and biomass allocation. Tellus Ser B-Chem Phys Meteorol. 49(1):1–17.
- Potter CS, Randerson JT, Field CB, Matson PA, Vitousek PM, Mooney HA, Klooster SA. 1993. Terrestrial ecosystem production – a process model-based on global satellite and surface data. Global Biogeochem Cycles. 7(4):811–841.
- Prince SD, Goward SN. 1995. Global primary production: a remote sensing approach. J Biogeogr. 22(4/5):815–835.
- Qi XZ, Jia JH, Liu HY, Lin ZS. 2019. Relative importance of climate change and human activities for vegetation changes on China’s silk road economic belt over multiple timescales. Catena. 180:224–237.
- Qian C, Shao LQ, Hou XH, Zhang BB, Chen W, Xia XL. 2019. Detection and attribution of vegetation greening trend across distinct local landscapes under China’s Grain to Green Program: a case study in Shaanxi Province. Catena. 183:104182.
- Qiao YN, Jiang YJ, Zhang CY. 2021. Contribution of karst ecological restoration engineering to vegetation greening in southwest China during recent decade. Ecol Indic. 121:15.
- Rafique R, Zhao F, de Jong R, Zeng N, Asrar GR. 2016. Global and regional variability and change in terrestrial ecosystems net primary production and NDVI: a model-data comparison. Remote Sens. 8:16.
- Sen PK. 1968. Estimates of the regression coefficient based on Kendall’s tau. J Am Stat Assoc. 63(324):1379–1389.
- Song LY, Li MY, Xu H, Guo Y, Wang Z, Li YC, Wu XJ, Feng LC, Chen J, Lu X, et al. 2021. Spatiotemporal variation and driving factors of vegetation net primary productivity in a typical karst area in China from 2000 to 2010. Ecol Indic. 132:18.
- Stocker T. 2014. Climate change 2013: the physical science basis: Working Group I contribution to the Fifth assessment report of the Intergovernmental Panel on Climate Change. Cambridge (UK), New York (NY): Cambridge University Press.
- Sun H, Chen Y, Xiong J, Ye C, Yong Z, Wang Y, He D, Xu S, J.I.J.o.A.E.O. 2022. Geoinformation relationships between climate change, phenology, edaphic factors, and net primary productivity across the Tibetan Plateau. 102708.
- Theil H. 1950. A rank-invariant method of linear and polynomial regression analysis. Indagationes Mathematicae. 12:173.
- Wang H, Liu G, Li Z, Wang P, Wang Z. 2019. Comparative assessment of vegetation dynamics under the influence of climate change and human activities in five ecologically vulnerable regions of China from 2000 to 2015. Forests. 10(4):317.
- Wang J, Meng JJ, Cai YL. 2008. Assessing vegetation dynamics impacted by climate change in the southwestern Karst region of China with AVHRR NDVI and AVHRR NPP time-series. Environ Geol. 54(6):1185–1195.
- Wang JF, Hu Y. 2012. Environmental health risk detection with GeogDetector. Environ Modell Softw. 33:114–115.
- Wang YH, Dai EF, Wu CS. 2021. Spatiotemporal heterogeneity of net primary productivity and response to climate change in the mountain regions of southwest China. Ecol. Indic. 132:13.
- Wei XC, Zhou QW, Luo Y, Cai MY, Zhou X, Yan WH, Peng DW, Zhang J. 2021. Vegetation dynamics and its response to driving factors in typical karst regions, Guizhou Province, China. Front Earth Sci. 15(1):167–183.
- Wen YY, Liu XP, Pei FS, Li X, Du GM. 2018. Non-uniform time-lag effects of terrestrial vegetation responses to asymmetric warming. Agric For Meteorol. 252:130–143.
- Wu LH, Wang SJ, Bai XY, Tian YC, Luo GJ, Wang JF, Li Q, Chen F, Deng YH, Yang YJ, et al. 2020. Climate change weakens the positive effect of human activities on karst vegetation productivity restoration in southern China. Ecol Indic. 115:16.
- Xiao HL, Weng QH. 2007. The impact of land use and land cover changes on land surface temperature in a karst area of China. J Environ Manage. 85(1):245–257.
- Xue P, Liu HY, Zhang MY, Gong HB, Cao L. 2022. Nonlinear characteristics of NPP based on ensemble empirical mode decomposition from 1982 to 2015 – a case study of six coastal provinces in Southeast China. Remote Sens. 14(1):15.
- Yan H, Ran Q, Hu R, Xue K, Zhang B, Zhou S, Zhang Z, Tang L, Che R, Pang Z, et al. 2022. Machine learning-based prediction for grassland degradation using geographic, meteorological, plant and microbial data. Ecol Indic. 137:108738.
- Yang HF, Zhong XN, Deng SQ, Xu H. 2021. Assessment of the impact of LUCC on NPP and its influencing factors in the Yangtze River basin, China. Catena. 206:105542.
- Yang J, Zhang XC, Luo ZH, Yu XJ. 2017. Nonlinear variations of net primary productivity and its relationship with climate and vegetation phenology, China. Forests. 8(10):361.
- Yin LC, Wang XF, Feng XM, Fu BJ, Chen YZ. 2020. A comparison of SSEBop-model-based evapotranspiration with eight evapotranspiration products in the Yellow River Basin. China Remote Sens. 12:30.
- Yuan XL, Hamdi R, Ochege FU, Kurban A, De Maeyer P. 2021. The sensitivity of global surface air temperature to vegetation greenness. Int J Climatol. 41(1):483–496.
- Zhe M, Zhang XQ. 2021. Time-lag effects of NDVI responses to climate change in the Yamzhog Yumco Basin, South Tibet. Ecol. Indic. 124:7.
- Zhou GS, Wang YH, Jiang YL, Yang ZY. 2002. Estimating biomass and net primary production from forest inventory data: a case study of China’s Larix forests. For Ecol Manage. 169(1–2):149–157.
- Zhu W-Q, Pan Y-Z, Zhang J-S. 2007. Estimation of net primary productivity of Chinese terrestrial vegetation based on remote sensing. Chin J Plant Ecol. 31:413.